This website uses cookies to ensure you get the best experience on our website.


- Table of Contents
Plan LGALS2 chromogenic IHC around cytoplasmic staining in gastrointestinal enterocytes and gallbladder glandular cells (HPA tissue IHC). The IHC-validated antibody A04114-2 has a recommended concentration of 2–5 μg/mL for paraffin sections (datasheet: A04114-2).

Expected localisation, validated protocols, controls and antibodies — the at-a-glance facts below, then the full design guide.
| Expected localisation | Cytoplasmic staining (HPA tissue IHC) | |
| Staining pattern | Enterocytes and glandular cells show cytoplasmic staining (HPA tissue IHC) | |
| Antigen retrieval | EDTA pH 8.0 HIER, heat-mediated (datasheet A04114-2) | |
| Positive control | Appendix+4 more · see all | |
| Negative control | Adipose tissue+4 more · see all |
| Fixation | Keep fixation consistent across sections. (standard IHC practice; not target-specific) | |
| Caveat | Staining and RNA show only medium consistency (HPA tissue IHC) | |
| Regulation | Regulation not established (UniProt) | |
| Isoform / epitope | No annotated isoforms or processing; chain 1–132 (UniProt) |
The catalog antibody protocol uses EDTA pH 8.0 heat retrieval (datasheet A04114-2). One published LGALS2 IHC protocol uses citrate pH 6.0 retrieval on tumor microarrays (PMC9242595).
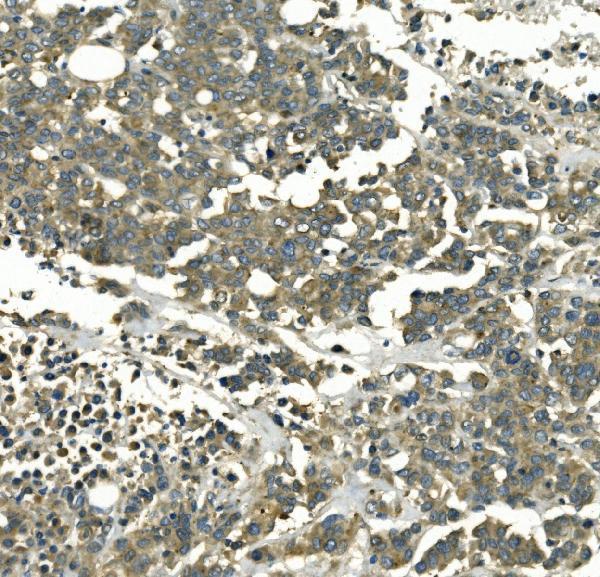
| Sample | Paraffin-embedded human pancreatic cancer tissue; fixative not specified (datasheet A04114-2) |
| Fixation | Image fixative and duration unreported (datasheet A04114-2); verify before use. |
| Sectioning | 4–5 µm sections on charged slides (standard) |
| Deparaffinisation | Xylene, graded ethanol series to water (standard) |
| Antigen retrieval | Heat retrieval: EDTA pH 8.0 (datasheet A04114-2); 20 min, 95–100 °C (standard) |
| Peroxidase block | 3% H2O2, 10 min, room temperature (standard) |
| Blocking | 10% goat serum (datasheet A04114-2) |
| Primary antibody | Rabbit anti-LGALS2, 2-5μg/ml (datasheet A04114-2) |
| Primary incubation | Overnight at 4 °C (datasheet A04114-2) |
| Detection | Streptavidin-biotin complex (SABC), DAB chromogen (datasheet A04114-2) |
| Counterstain | Hematoxylin, blue, dehydrate and mount (standard) |
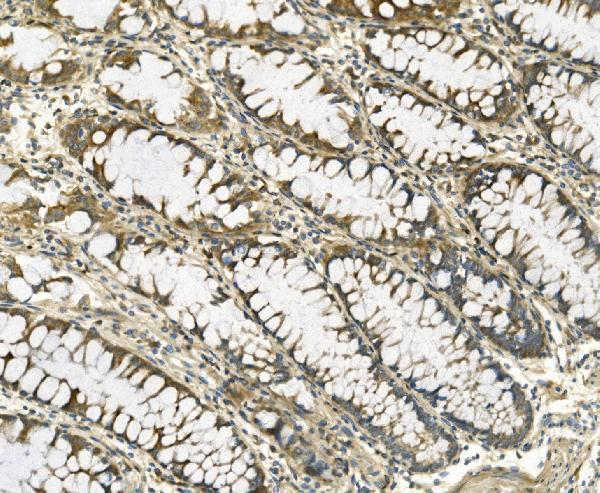
| Expected result | LGALS2-positive staining in enterocytes of appendix (HPA tissue IHC: High). HPA tissue profile: Cytoplasmic expression in gall bladder, gastrointestinal tract, exocrine pancreas and renal tubules. No signal in the no-primary control. |
In paraffin section IHC, expect mainly cytoplasmic LGALS2 staining in gastrointestinal enterocytes, gallbladder glandular cells and pancreatic exocrine glandular cells; kidney proximal tubules show a weaker reference pattern (HPA tissue IHC). HPA rates the tissue pattern Enhanced, with medium consistency between staining and RNA data (HPA tissue IHC). LGALS2 has no annotated transmembrane segment, and UniProt does not assign it a subcellular location (UniProt P05162 topology and subcellular annotation).
| Strong cytoplasmic staining in gastrointestinal enterocytes, gallbladder glands or pancreatic exocrine cells. | This matches HPA's High cell level observations and cytoplasmic tissue profile (HPA tissue IHC). Judge the cell type and compartment together: staining somewhere in a positive organ is insufficient if the expected cells remain clear. |
| Cytoplasmic staining of kidney proximal tubule cell bodies, less intense than the High reference cells. | This is compatible with HPA's Medium kidney observation (HPA tissue IHC). Compare matched sections and staining conditions before treating an intensity difference as biological; the HPA levels are reference categories, not a quantitative cutoff. |
| Predominantly nuclear, membranous or extracellular staining in an IHC positive reference tissue. | That does not match the reported cytoplasmic tissue IHC profile (HPA tissue IHC). Review morphology and controls before calling it LGALS2; HPA separately reports mitochondrial and additional nucleoplasmic localisation by ICC-IF, which is a different assay (HPA subcellular ICC-IF). |
| Strong signal in an unexpected cell population while the expected positive cells are faint or clear. | Consider antibody cross-reactivity or endogenous detection activity, and check the detection only control. HPA reports High staining in specified enterocytes and glandular cells, not every cell in those tissues (HPA tissue IHC). |
| Diffuse staining obscures cell borders, or a known High reference cell population has no signal. | The result cannot yet support a confident pattern call. Diffuse signal calls for background controls; absent signal calls for a run control and review of IHC processing. HPA's High reference populations provide a comparison, but do not diagnose the failed step (HPA tissue IHC). |
| Reference tissue and cell type | Appendix, colon, duodenum, rectum and small intestine enterocytes, gallbladder glandular cells and pancreatic exocrine glandular cells are High; kidney proximal tubules are Medium (HPA tissue IHC). Use the named cells when selecting and reading a positive reference. |
| Reported negative comparison | HPA reports Not detected in adipocytes of adipose tissue and respiratory epithelial cells of bronchus, among other specified populations (HPA tissue IHC). These are cell level comparisons; another cell type in the same section is not automatically a negative control. |
| Antibody validation and evidence limit | HPA lists IHC Enhanced for HPA003536 and CAB025198 and describes tissue reliability as Enhanced with medium staining–RNA consistency (HPA antibodies; HPA tissue IHC). This supports comparison with the reported pattern, but cannot establish the specificity of every signal in a new run. |
| Protein structure and processing | UniProt records a 132 aa chain, a galectin domain at residues 4–131, no transmembrane segment, no signal peptide or propeptide, and no annotated glycosylation sites (UniProt P05162). These entries do not identify an antibody epitope or establish antigen retrieval or fixation sensitivity. |
| IF/ICC localisation question | Does a mitochondrial pattern in IF/ICC contradict cytoplasmic IHC? HPA reports mitochondria as the main ICC-IF location and nucleoplasm as an additional location, while its tissue IHC profile is cytoplasmic (HPA subcellular ICC-IF; HPA tissue IHC). Interpret each against its own assay evidence. |
| Situation | Likely cause | Next action |
|---|---|---|
| No visible staining in a High reference cell population. | The IHC run may have lost detectable signal; the slide alone cannot identify whether processing, retrieval, antibody incubation or detection is responsible. | Check an on-run positive control and review the established paraffin IHC steps one at a time. Use HPA's High enterocyte or glandular cell references to assess recovery (HPA tissue IHC); no LGALS2-specific retrieval or fixation sensitivity is supplied. |
| Uniform haze or precipitate makes cytoplasmic detail hard to score. | Background from detection reagents, insufficient blocking or incomplete washing can obscure a cellular pattern in routine chromogenic IHC. | Inspect the detection only control and section morphology, then review blocking, washes and chromogen development. Score LGALS2 only after the expected cells can be distinguished from background (HPA tissue IHC for expected cells). |
| Strong staining appears in cells outside the reported positive populations. | Cross-reactivity or endogenous detection activity is possible; an unexpected cell signal is not proof of either cause. | Compare a detection only control and a matched positive reference. Check whether the named High cells show the expected cytoplasmic pattern before assigning LGALS2 positivity (HPA tissue IHC). |
| Kidney proximal tubules stain more weakly than gastrointestinal enterocytes. | HPA classifies proximal tubules as Medium and the specified enterocytes as High (HPA tissue IHC). | Read intensity relative to the correct cell level reference under comparable run conditions. Do not reject a clear proximal tubule cell body signal solely because it is weaker than a High reference (HPA tissue IHC). |
| A nominally negative section contains scattered stained cells. | HPA's Not detected calls apply to named cells, such as adipocytes in adipose tissue, rather than every cell in the section (HPA tissue IHC). | Identify the stained cell type first. If the named negative population itself stains, inspect controls for background or cross-reactivity before treating the result as LGALS2 (HPA tissue IHC). |
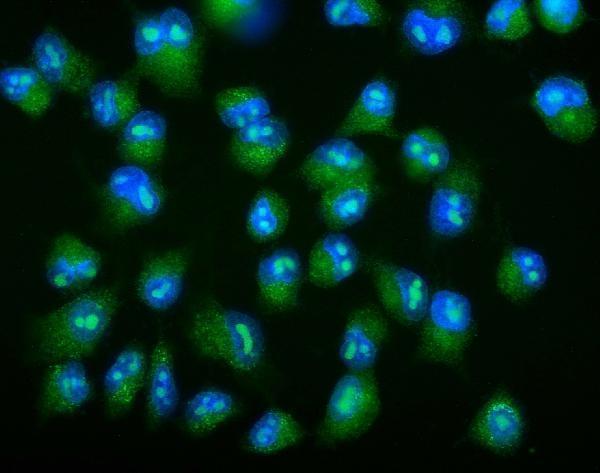
| IF/ICC shows mitochondrial puncta or additional nucleoplasmic signal. | Those locations are reported for ICC-IF, whereas the supplied tissue IHC profile is cytoplasmic (HPA subcellular ICC-IF; HPA tissue IHC). | Use the separate IF/ICC guide for that assay. For this paraffin IHC interpretation, compare the slide with HPA's cytoplasmic pattern in the specified tissue cells (HPA tissue IHC). |


Comprehensive Human Protein Atlas IHC scoring per tissue (reliability: Enhanced — Medium consistency between antibody staining and RNA expression data.). Rows are taken directly from the HPA tissue chart — click any row's HPA link to view the source.
| Tissue | Cell type | Level | Evidence | Source |
|---|---|---|---|---|
| Appendix | Enterocytes | High | Protein (IHC) | HPA → |
| Colon | Enterocytes | High | Protein (IHC) | HPA → |
| Duodenum | Enterocytes | High | Protein (IHC) | HPA → |
| Gallbladder | Glandular cells | High | Protein (IHC) | HPA → |
| Pancreas | Exocrine glandular cells | High | Protein (IHC) | HPA → |
| Tissue | Cell type | Level | Evidence | Source |
|---|---|---|---|---|
| Adipose tissue | Adipocytes | Not detected | Protein (IHC) | HPA → |
| Adrenal gland | Glandular cells | Not detected | Protein (IHC) | HPA → |
| Bone marrow | Hematopoietic cells | Not detected | Protein (IHC) | HPA → |
| Breast | Adipocytes | Not detected | Protein (IHC) | HPA → |
| Bronchus | Respiratory epithelial cells | Not detected | Protein (IHC) | HPA → |
Troubleshoot LGALS2 staining in paraffin sections by checking retrieval, controls, cell identity and compartment before assigning a biological interpretation.
Both antibodies list IHC and IF applications with human reactivity (catalog applications/reactivity). A04114 also lists mouse and rat reactivity (A04114 reactivity); their figures show paraffin-section IHC and cell IF (image captions).
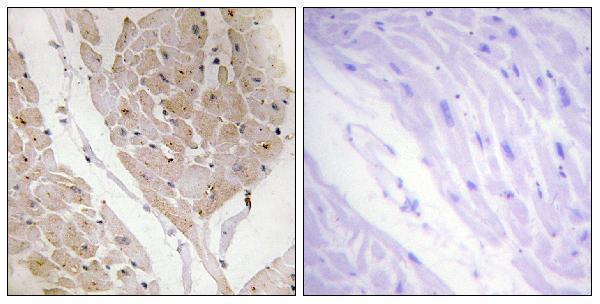
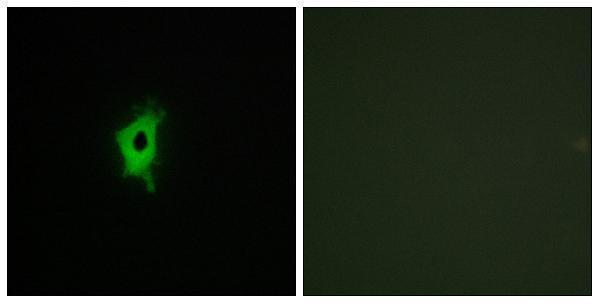
A04114-2 lists human IHC and IF applications; its figures show IHC in human pancreatic cancer paraffin sections and IF in A549 cells (A04114-2 applications/reactivity and image captions). A04114 lists human, mouse and rat reactivity with IHC and IF applications; its figures show human heart paraffin-section IHC and COS7 cell IF, each with a peptide-blocked comparison (A04114 applications/reactivity and image captions).
Which to pick: For tissue IHC, start with A04114-2 when its documented workflow fits: the human pancreatic cancer paraffin-section caption specifies EDTA pH 8 retrieval and 2 μg/ml primary antibody; A04114 instead shows human heart paraffin-section staining with peptide blocking, and neither IHC caption reports the fixative (respective IHC captions). For human cell IF/ICC, A04114-2 has an A549 IF figure using 5 μg/ml primary antibody, while A04114 has a COS7 IF figure with peptide blocking (respective IF captions). For planned mouse or rat work, choose the rabbit polyclonal A04114 based on its listed reactivity, then verify staining in the intended sample because its supplied IHC figure is human heart (A04114 host, dilution_raw, reactivity and IHC caption).