This website uses cookies to ensure you get the best experience on our website.


- Table of Contents
Real validated MAD2L1 Western blot protocols, expected-band and isoform facts, troubleshooting for weak or shifted signal, and recommended anti-MAD2L1 WB antibodies. Everything you need to plan the experiment before you commit precious samples.
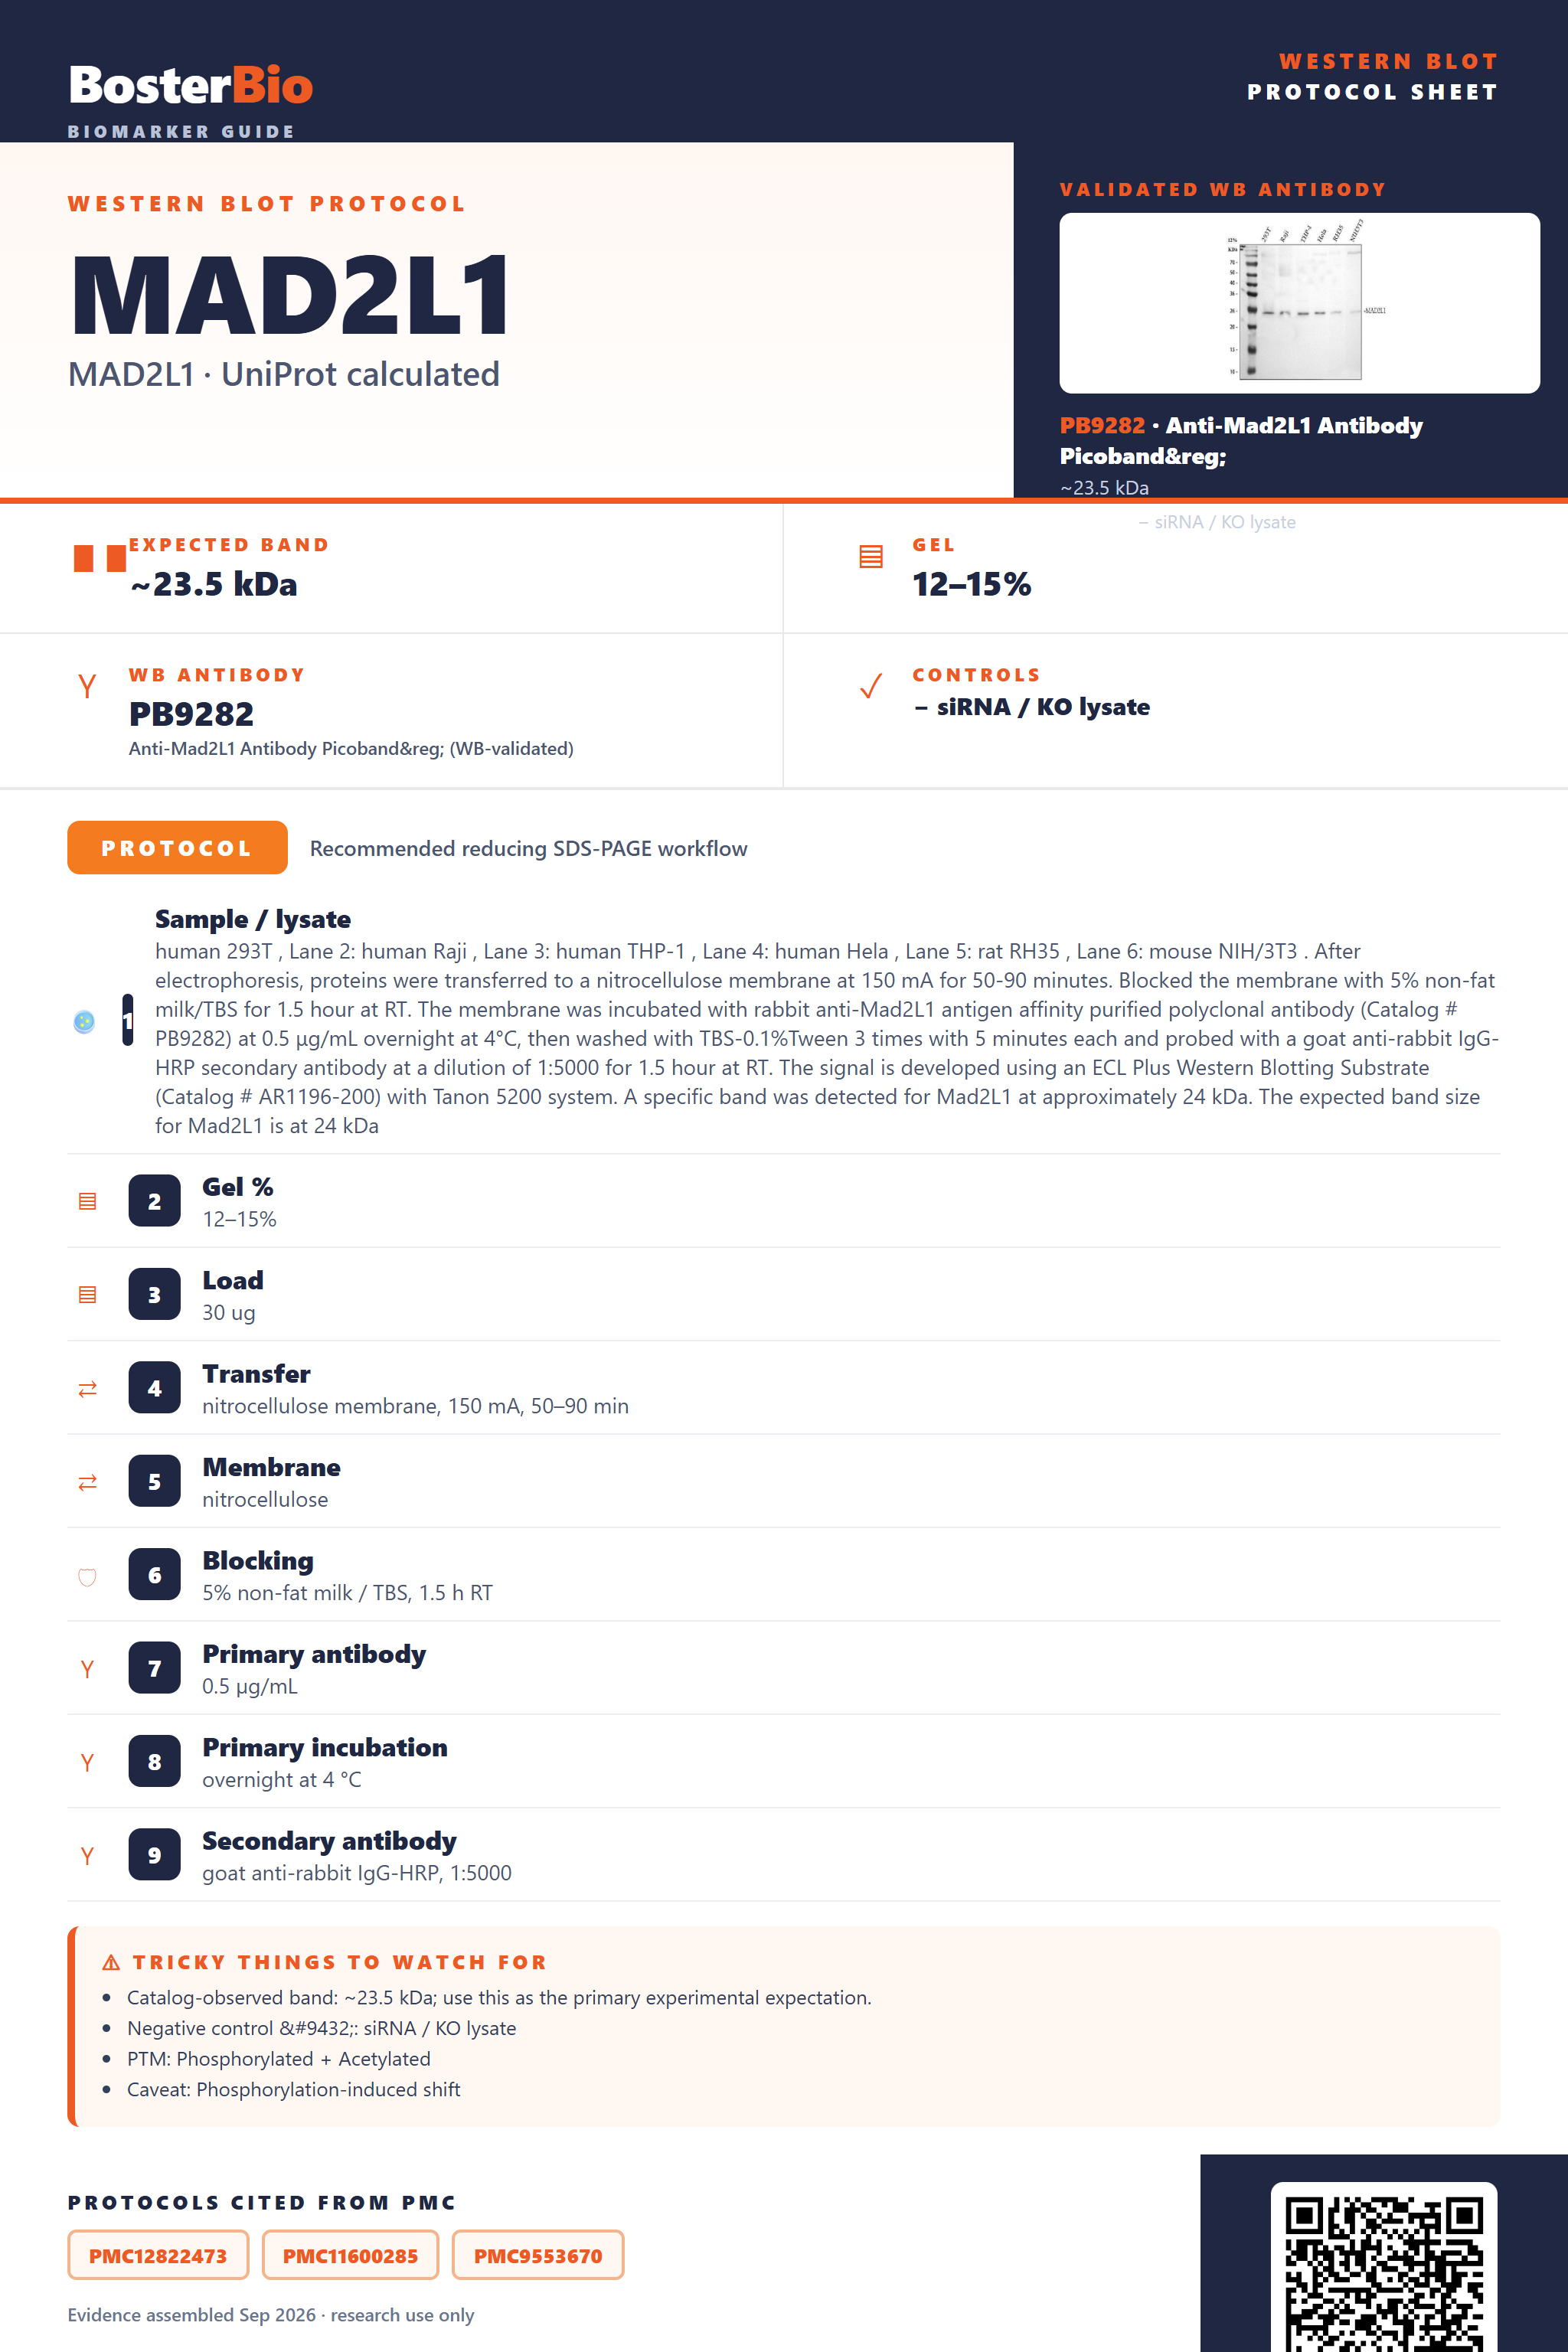
Expected bands, validated protocols, controls and antibodies — the at-a-glance facts below, then the full design guide.
| Expected band | ~23.5 kDa | |
| Observed band | ~24 kDa | |
| Gel | 12–15% | |
| Negative control | siRNA / KO lysate |
| PTM | Phosphorylated + Acetylated | |
| Caveat | Phosphorylation-induced shift | |
| Regulation | MYC up | |
| Isoform | 2 isoform(s) |
Literature-validated Western blot parameters for MAD2L1 — gel percentage, transfer, blocking, antibody incubation and detection, extracted from published methods.
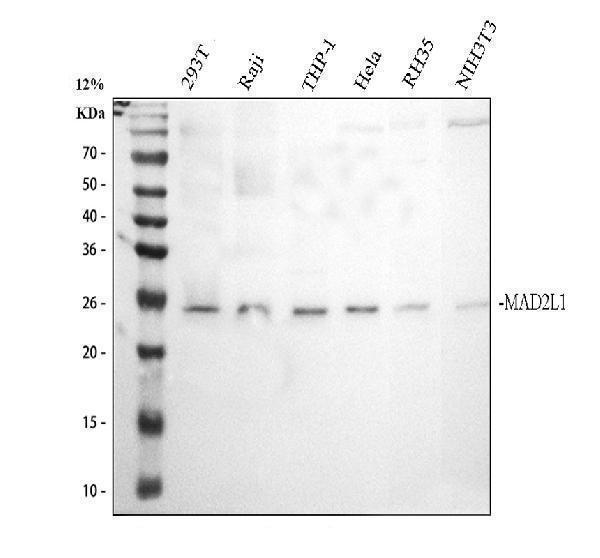
| Sample / lysate | human 293T , Lane 2: human Raji , Lane 3: human THP-1 , Lane 4: human Hela , Lane 5: rat RH35 , Lane 6: mouse NIH/3T3 . After electrophoresis, proteins were transferred to a nitrocellulose membrane at 150 mA for 50-90 minutes. Blocked the membrane with 5% non-fat milk/TBS for 1.5 hour at RT. The membrane was incubated with rabbit anti-Mad2L1 antigen affinity purified polyclonal antibody (Catalog # PB9282) at 0.5 μg/mL overnight at 4°C, then washed with TBS-0.1%Tween 3 times with 5 minutes each and probed with a goat anti-rabbit IgG-HRP secondary antibody at a dilution of 1:5000 for 1.5 hour at RT. The signal is developed using an ECL Plus Western Blotting Substrate (Catalog # AR1196-200) with Tanon 5200 system. A specific band was detected for Mad2L1 at approximately 24 kDa. The expected band size for Mad2L1 is at 24 kDa |
| Gel % | 12–15% |
| Load | 30 ug |
| Transfer | nitrocellulose membrane, 150 mA, 50–90 min |
| Membrane | nitrocellulose |
| Blocking | 5% non-fat milk / TBS, 1.5 h RT |
| Primary antibody | 0.5 µg/mL |
| Primary incubation | overnight at 4 °C |
| Secondary antibody | goat anti-rabbit IgG-HRP, 1:5000 |
| Wash | TBS-0.1% Tween, 3 × 5 min |
| Detection | ECL |
| Exposure / imaging | Tanon 5200 |
| Observed band | 24 kDa |
MAD2L1 has a 23.5 kDa unmodified backbone and runs at ~24 kDa on Western blot, consistent with predicted mass since it lacks glycosylation or cleavage to inflate it.
| Single band around 24 kDa | Matches the unmodified 23.5 kDa predicted mass, since MAD2L1 has no glycosylation, signal peptide, or propeptide to shift it |
| Faint second band at a slightly different size | May reflect the second annotated splice isoform rather than nonspecific binding |
| Band appears as a tight doublet or slightly diffuse near 24 kDa | Consistent with the 6 annotated phosphoserine residues driving minor mobility heterogeneity, especially in mitotic-enriched lysates |
| Solid band present in standard whole-cell lysates | MAD2L1 is nuclear/kinetochore/cytoplasmic, not secreted, so it is retained and detectable in routine whole-cell lysate preps |
| No higher-molecular-weight band despite MAD2L1's dimer biology | The monomer/homodimer equilibrium is non-covalent with no annotated disulfide bonds, so reducing SDS-PAGE collapses it to the single monomer band |
| Predicted mass from UniProt | 205 aa, 23.5 kDa unmodified backbone sets the baseline migration near the observed ~24 kDa band |
| Splice isoforms (named 1 and 2) | A second annotated isoform can add a distinct, less intense band at a different apparent mass alongside the canonical one |
| Phosphorylation (6 annotated phosphoserines) | Extensive, cell-cycle-linked phosphorylation can cause a slight upward mobility shift or tight doublet, especially in mitotic-enriched samples |
| Homodimer formation (oligomeric state) | MAD2L1 self-associates as monomer/homodimer, but with no disulfide bonds annotated this is disrupted by SDS and reducing buffer, so it does not add mass on standard denaturing blots |
| Situation | Likely cause | Next action |
|---|---|---|
| No band in lysate | MAD2L1 is a cell-cycle/mitotic checkpoint protein with cyclical expression, so quiescent or non-dividing cell populations may express little of it | Use actively dividing or mitotically arrested/synchronized cell lines and confirm with a proliferation or mitotic marker |
| Multiple bands | Two annotated splice isoforms can both be detected if the antibody epitope is shared between them | Check the antibody epitope location against the isoform sequences to determine if both bands are expected |
| Band higher than expected | Cell-cycle-regulated phosphorylation at multiple annotated serine residues can slow migration during mitosis | Compare asynchronous versus mitotic-arrested lysates, or treat with phosphatase to confirm the shift resolves |
| Weak or no signal | MAD2L1 is a comparatively low-abundance checkpoint protein concentrated at the nucleus and kinetochore during mitosis | Enrich for mitotic cells, increase total protein loading, or use a nuclear/chromatin-focused extraction protocol |
| Broad smear instead of sharp band | Incomplete solubilization of the chromatin- and kinetochore-associated pool, not intrinsic modification, since no glycosylation is annotated | Use a stronger lysis buffer with nuclease treatment and fresh reducing agent to fully solubilize nuclear-associated protein before loading |
Comprehensive Human Protein Atlas IHC scoring per tissue. Rows are taken directly from the HPA tissue chart — click any row's HPA link to view the source.
| Tissue | Cell type | Level | Evidence | Source |
|---|
| Tissue | Cell type | Level | Evidence | Source |
|---|
Deeper troubleshooting and optimisation questions for MAD2L1, answered from its protein features.
BosterBio's MAD2L1 antibodies are among the best-performing WB antibodies on the market — well cited, thoroughly validated, and orthogonally cross-validated against negative tissues and complementary methods.
The featured anti-MAD2L1 antibody below represents Boster's best-performing option for Western blot, selected for its strong citation record, rigorous validation, and orthogonal confirmation through complementary methods and negative tissue controls, ensuring specific, reproducible detection of MAD2L1 across experimental systems.
Which to pick: Only one MAD2L1 antibody is catalogued here, PB9282, so it's the clear choice: it includes an actual Western blot validation image on 12% SDS-PAGE, confirming specific detection and giving you a direct visual reference for expected band pattern.