This website uses cookies to ensure you get the best experience on our website.


- Table of Contents
Plan paraffin-section MCM5 IHC around nuclear staining (HPA tissue IHC) and the catalog antibody's IHC validation (datasheet M03642-2). Compare hematopoietic cells with adipocytes, where staining was not detected (HPA tissue IHC), while considering changes in chromatin association during replication (UniProt).

Expected localisation, validated protocols, controls and antibodies — the at-a-glance facts below, then the full design guide.
| Expected localisation | Nuclear staining in tissue (HPA tissue IHC) | |
| Staining pattern | Nuclear staining mainly in hematopoietic and immune cells (HPA tissue IHC) | |
| Antigen retrieval | EDTA pH 8.0 HIER, heat-mediated (datasheet M03642-2) | |
| Positive control | Appendix+4 more · see all | |
| Negative control | Adipose tissue+4 more · see all |
| Fixation | Keep fixation consistent across sections (standard IHC practice; not target-specific). Selected-image fixative and duration unreported (datasheet M03642-2); verify before use. | |
| Caveat | Chromatin association changes as replication progresses (UniProt) | |
| Regulation | Expression regulation is unreported (UniProt) | |
| Isoform / epitope | No isoforms annotated; mature chain spans residues 2–734 (UniProt) |
The catalog antibody’s IHC-P protocol uses EDTA pH 8.0 retrieval (datasheet: M03642-2). The four published IHC protocols below provide tissue-specific examples (cited PMC methods).
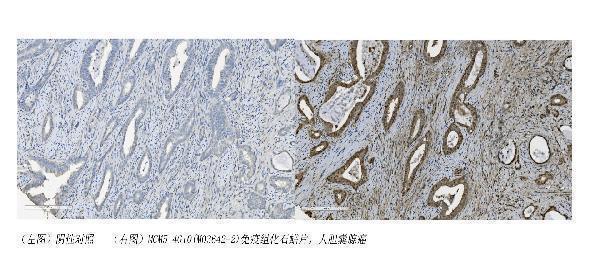
| Sample | Paraffin-embedded human gallbladder adenocarcinoma tissue; fixative not specified (datasheet M03642-2) |
| Fixation | Image fixative and duration unreported (datasheet M03642-2); verify before use. |
| Sectioning | 4–5 µm sections on charged slides (standard) |
| Deparaffinisation | Xylene, graded ethanol series to water (standard) |
| Antigen retrieval | Heat retrieval: EDTA pH 8.0 (datasheet M03642-2); 20 min, 95–100 °C (standard) |
| Peroxidase block | 3% H2O2, 10 min, room temperature (standard) |
| Blocking | 10% goat serum (datasheet M03642-2) |
| Primary antibody | Mouse monoclonal (clone 4G10) anti-MCM5, 2μg/ml (datasheet M03642-2) |
| Primary incubation | Overnight at 4 °C (datasheet M03642-2) |
| Detection | Streptavidin-biotin complex (SABC), DAB chromogen (datasheet M03642-2) |
| Counterstain | Hematoxylin, blue, dehydrate and mount (standard) |
| Expected result | MCM5-positive staining in germinal center cells of appendix (HPA tissue IHC: High). HPA tissue profile: Nuclear expression mainly in hematopoietic cells, immune cells, cytotrophoblastic cells in placenta and cells in testis. Also expressed in other cell types. No signal in the no-primary control. |
MCM5 should produce predominantly nuclear chromogenic staining in paraffin sections (UniProt P33992: nucleus and chromosome; HPA: tissue IHC). Expect prominent staining in bone marrow hematopoietic cells, lymph node germinal center cells, placental trophoblastic cells, and skin basal layer cells (HPA: High in each). HPA rates its tissue pattern Enhanced, citing consistency between staining and RNA expression (HPA: reliability). MCM5 has no transmembrane segment (UniProt P33992: topology).
| Distinct nuclear staining in hematopoietic or germinal center cells, with little surrounding haze. | This fits the expected compartment and two High tissue patterns (UniProt P33992: nucleus; HPA: High in bone marrow hematopoietic and lymph node germinal center cells). Compare nuclei within each cell population; intensity may differ across populations because HPA reports staining by cell type (HPA: tissue IHC). |
| Predominantly cytoplasmic, membranous, or extracellular chromogen, without convincing nuclear staining. | Treat this as a compartment mismatch and check for artefact before calling it MCM5: UniProt places MCM5 in the nucleus and on chromosomes, while HPA reports nuclear tissue expression (UniProt P33992: subcellular location; HPA: tissue IHC). Diffuse nonnuclear signal alone does not establish target detection (general IHC interpretation). |
| Strong staining in adipocytes or cardiomyocytes, especially with weak expected nuclear staining. | HPA reports MCM5 not detected in those sampled cell populations (HPA: adipose tissue; heart muscle). Assess nonspecific antibody binding or endogenous detection activity using appropriate controls (general chromogenic IHC practice). HPA's result describes those populations; it does not make every cell in either tissue a negative control (HPA: cell-specific tissue IHC). |
| Uniform brown haze across nuclei, cytoplasm, and tissue spaces. | The pattern obscures whether MCM5 is nuclear, so score the slide as uninterpretable until background is reduced (UniProt P33992: nucleus; general IHC interpretation). Compare a no-primary control for detection background and inspect washes and blocking as general IHC checks; HPA does not identify the cause of haze on this slide (general chromogenic IHC practice). |
| No convincing nuclear signal in bone marrow hematopoietic cells or lymph node germinal center cells. | These are High populations in HPA, making absent staining a reason to check the assay before interpreting test specimens (HPA: bone marrow; lymph node). Confirm tissue preservation, antibody use, retrieval conditions, and detection controls as general IHC checks. HPA staining levels do not establish MCM5-specific fixation or retrieval sensitivity (HPA: tissue IHC scope). |
| Cell population chosen for comparison | HPA rates germinal center cells in appendix and lymph node, placental trophoblastic cells, and skin basal layer cells High; it rates lung macrophages Low and cardiomyocytes not detected (HPA: tissue IHC). Identify the cell population before comparing intensity across sections (general IHC interpretation). |
| IHC antibody evidence | HPA lists HPA000845 and CAB000101 as IHC Enhanced; its tissue profile also has Enhanced reliability through staining and RNA consistency (HPA: antibodies; reliability). Those ratings support the reported patterns, but they do not specify a dilution, retrieval condition, or performance for an unlisted antibody (HPA: supplied antibody and tissue records). |
| Chromatin association during replication | MCM5 associates with chromatin before nuclei form and detaches as DNA replication progresses (UniProt P33992: subcellular note). This supports nuclear interpretation while allowing biological variation in chromatin association; it does not define a diagnostic chromogen intensity or license a cytoplasmic-positive call (UniProt P33992: subcellular location; general IHC interpretation). |
| Retrieval and molecular features | The supplied record gives no epitope position or MCM5-specific retrieval response (UniProt P33992: supplied record). It reports no transmembrane segment, no signal peptide, 0 glycosylation sites, and a chain spanning residues 2–734 (UniProt P33992: topology and processing). Do not infer fixation sensitivity or a retrieval setting from those features (general IHC interpretation). |
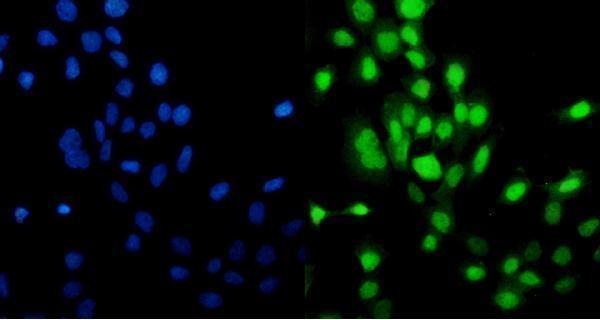
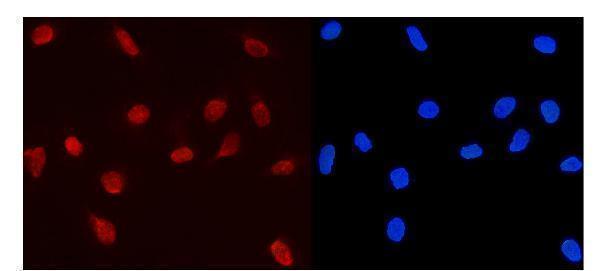
| IF/ICC Q&A: where should signal appear? | HPA reports the nucleoplasm as the enhanced main location in ICC-IF images; UniProt also assigns MCM5 to the nucleus and chromosomes (HPA: subcellular; UniProt P33992: location). This answers the localization question only; IF/ICC staining conditions belong in its separate guide (HPA: supplied subcellular record). |
| Situation | Likely cause | Next action |
|---|---|---|
| Positive tissue has no nuclear chromogen. | An assay failure is possible when bone marrow hematopoietic or lymph node germinal center cells lack their expected High signal (HPA: tissue IHC). The supplied sources do not identify a target-specific technical cause (HPA: supplied records). | Check the primary antibody, detection reagents, and run controls; review the retrieval step against the antibody's own IHC instructions (general chromogenic IHC practice). Do not label retrieval failure as an established MCM5 fixation effect (HPA: tissue IHC scope). |
| Brown signal is mainly cytoplasmic. | That distribution conflicts with nuclear tissue expression and UniProt localization; nonspecific staining or detection artefact is possible (HPA: tissue IHC; UniProt P33992: location; general IHC interpretation). | Compare nuclear counterstain alignment and a no-primary control, then assess blocking and washes before scoring the slide (general chromogenic IHC practice). Require a discrete nuclear pattern in an HPA-positive population (HPA: tissue IHC). |
| Adipocytes or cardiomyocytes stain strongly. | HPA lists those specific populations as not detected; unexpected color could reflect cross-reactivity or endogenous detection activity (HPA: adipose tissue; heart muscle; general chromogenic IHC practice). | Compare a no-primary control and an HPA High cell population on the same run, then review the detection and blocking steps (general IHC practice; HPA: tissue IHC). Interpret other cells in the tissue separately (HPA: cell-specific profile). |
| All compartments show diffuse background. | Broad haze prevents reliable nuclear scoring and may arise from nonspecific binding or detection background (UniProt P33992: nucleus; general chromogenic IHC practice). HPA provides no slide-specific cause (HPA: supplied tissue record). | Inspect no-primary controls, blocking, washes, and detection exposure; repeat scoring only when nuclei can be distinguished from background (general chromogenic IHC practice). |
| Different tissues give different positive-cell fractions. | HPA assigns levels to cell populations: bone marrow hematopoietic cells are High, whereas lung macrophages are Low (HPA: tissue IHC). A whole-section fraction can change with its cellular composition (general IHC interpretation). | Record compartment, intensity, and fraction within each identified cell population; compare like populations and use HPA levels as qualitative references (general IHC scoring; HPA: tissue IHC). |
| An IF/ICC image seems inconsistent with the chromogenic section. | HPA's ICC-IF summary identifies nucleoplasm, while its tissue IHC profile reports nuclear expression across specified cell populations; the records describe different specimen formats (HPA: subcellular; tissue IHC). | Compare nuclear localization, then assess each result against its own HPA record and assay controls (HPA: subcellular and tissue IHC; general assay interpretation). Use the separate IF/ICC guide for that assay's conditions. |

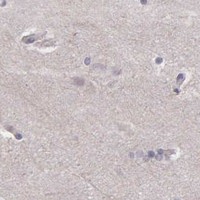
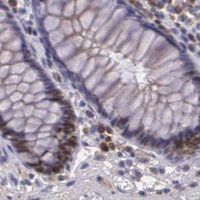


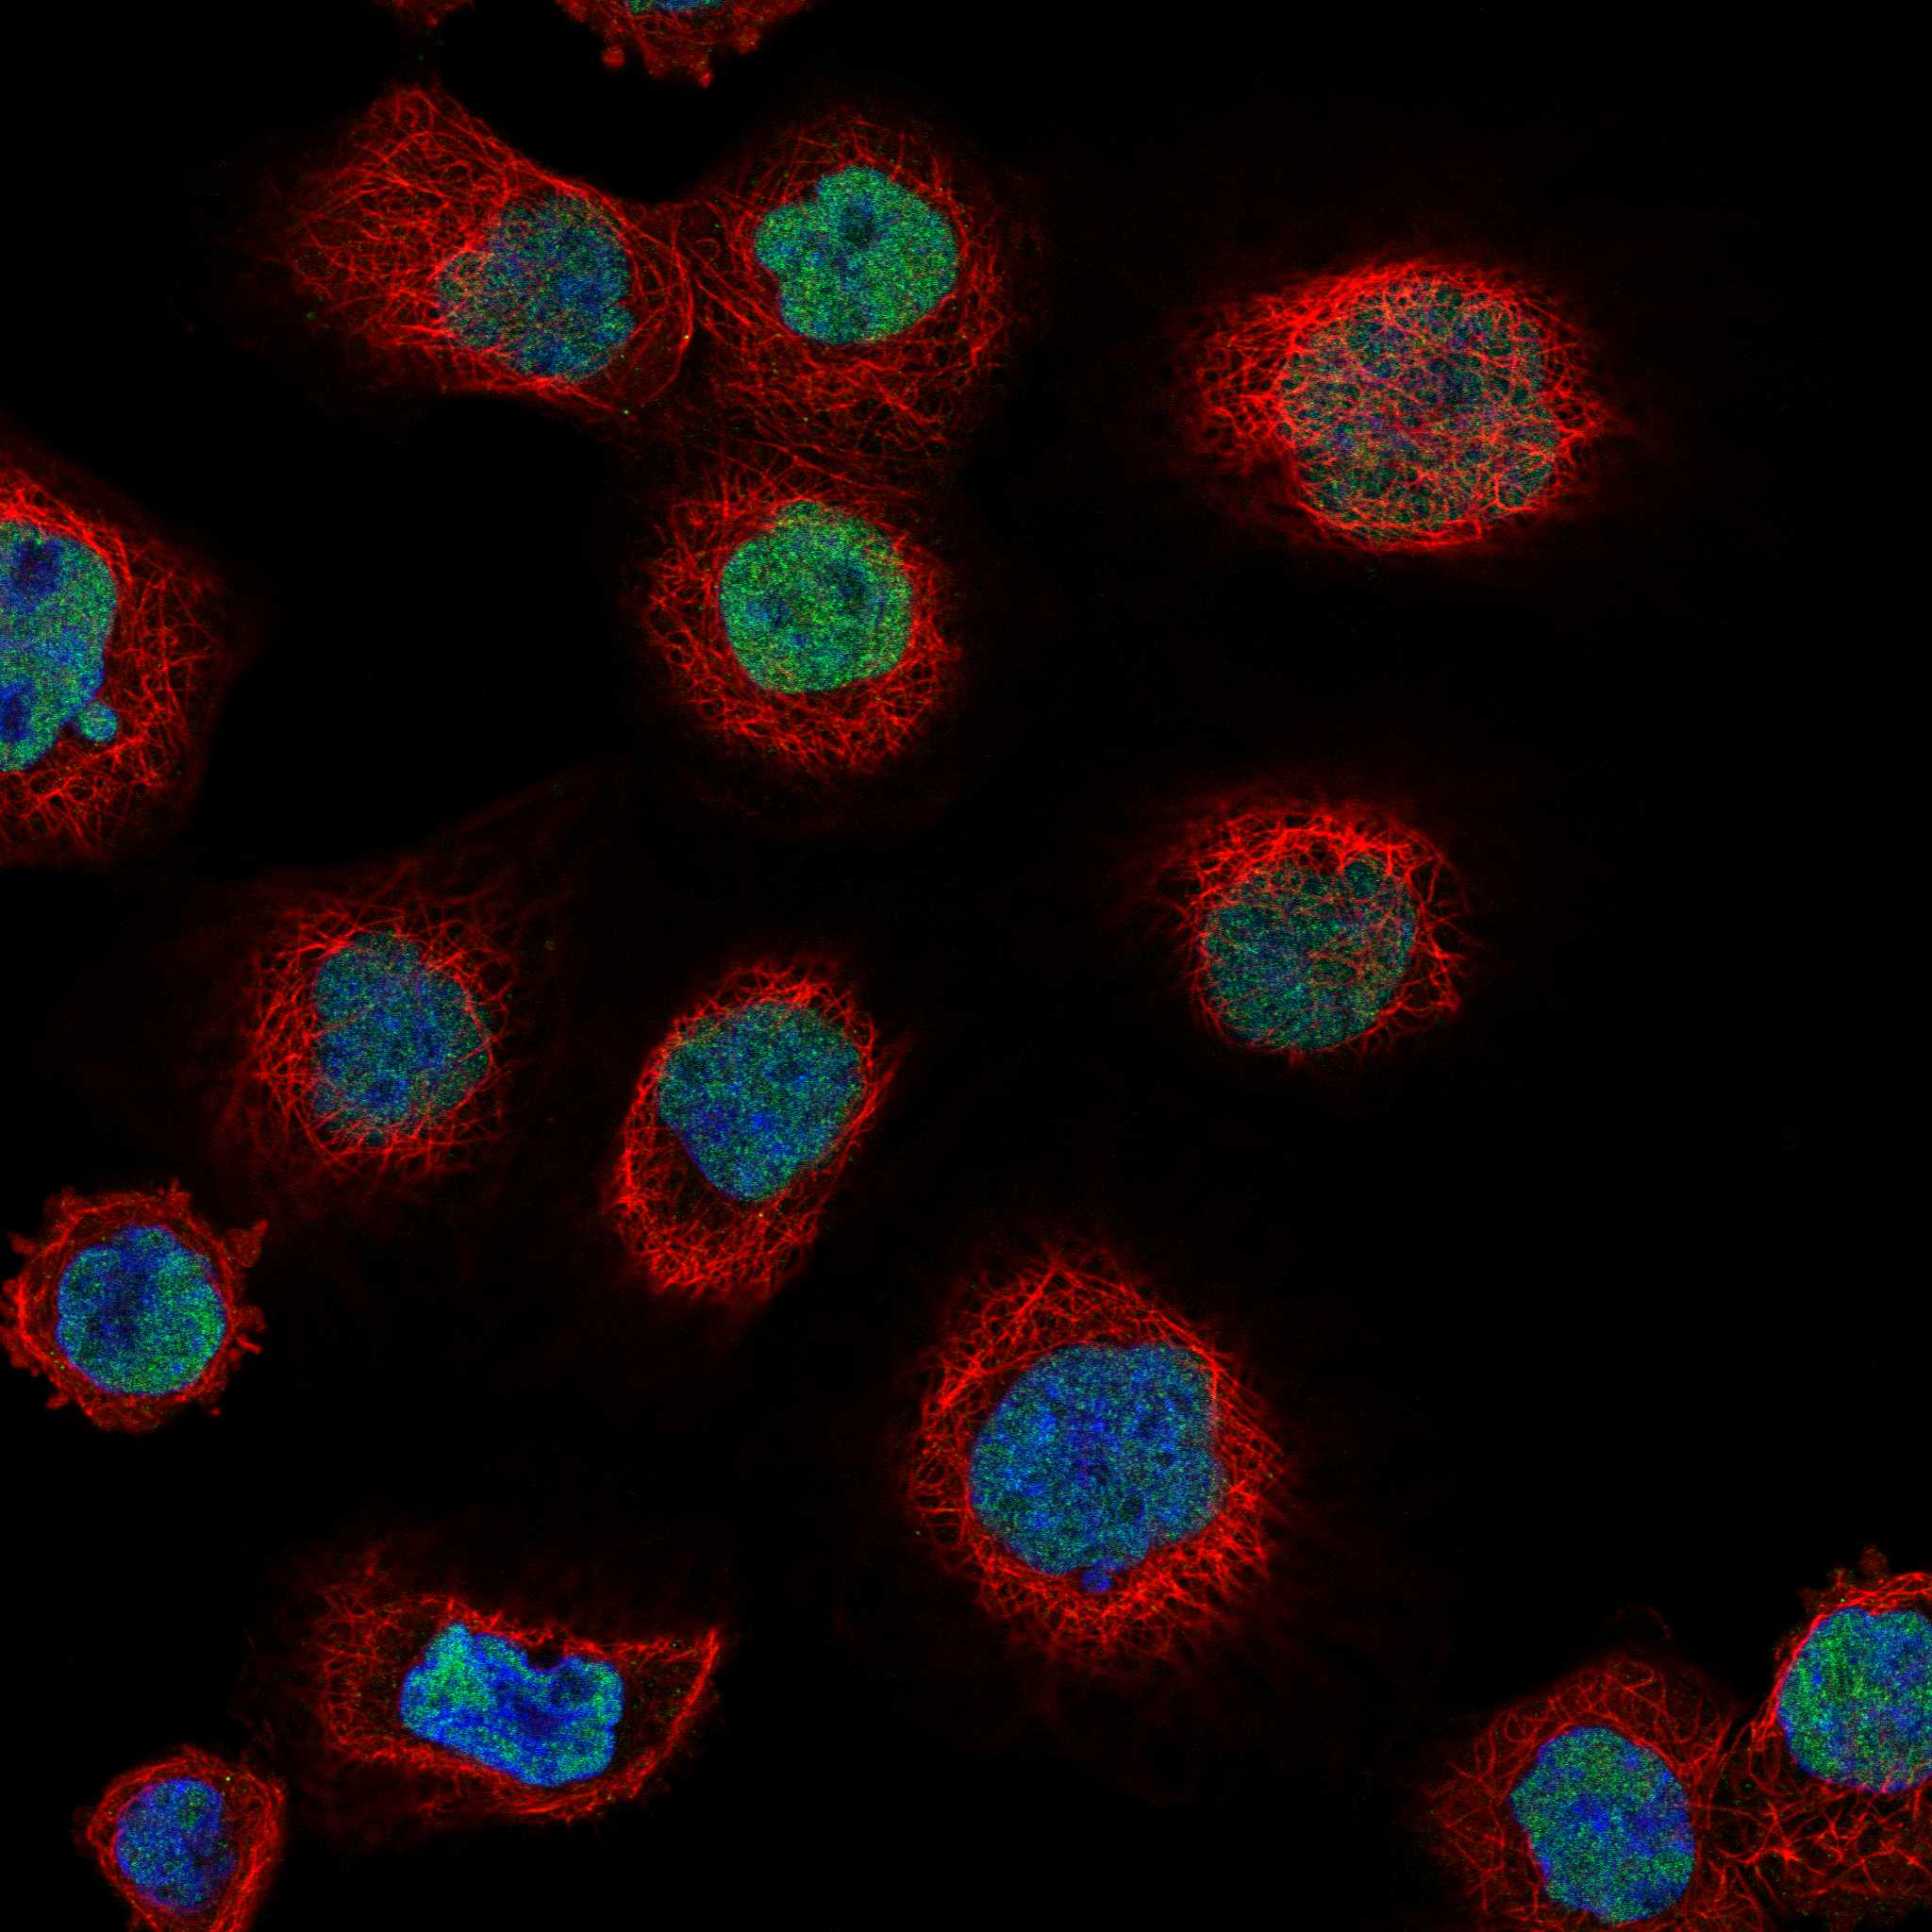
Comprehensive Human Protein Atlas IHC scoring per tissue (reliability: Enhanced — High consistency between antibody staining and RNA expression data.). Rows are taken directly from the HPA tissue chart — click any row's HPA link to view the source.
| Tissue | Cell type | Level | Evidence | Source |
|---|---|---|---|---|
| Appendix | Germinal center cells | High | Protein (IHC) | HPA → |
| Bone marrow | Hematopoietic cells | High | Protein (IHC) | HPA → |
| Duodenum | Paneth cells | High | Protein (IHC) | HPA → |
| Endometrium | Glandular cells | High | Protein (IHC) | HPA → |
| Lymph node | Germinal center cells | High | Protein (IHC) | HPA → |
| Tissue | Cell type | Level | Evidence | Source |
|---|---|---|---|---|
| Adipose tissue | Adipocytes | Not detected | Protein (IHC) | HPA → |
| Caudate | Glial cells | Not detected | Protein (IHC) | HPA → |
| Cerebellum | Cells in granular layer | Not detected | Protein (IHC) | HPA → |
| Fallopian tube | Glandular cells | Not detected | Protein (IHC) | HPA → |
| Heart muscle | Cardiomyocytes | Not detected | Protein (IHC) | HPA → |
Troubleshoot MCM5 staining in paraffin sections by checking retrieval, nuclear localisation, detection controls and cell-specific scoring.
Anti-MCM5 antibodies have IHC images from human paraffin sections (catalog IHC captions) and IF/ICC images from A431 and U20S cells (catalog IF captions). Both list human, mouse and rat reactivity (catalog applications).
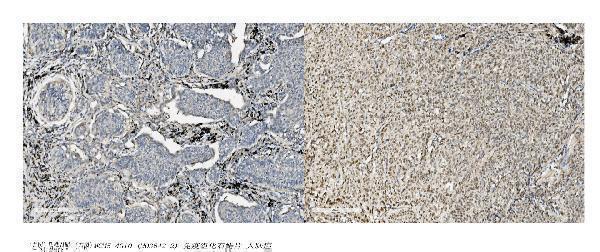
M03642-2 has IHC images from human gallbladder adenocarcinoma, lung cancer and pancreatic cancer paraffin sections, plus an A431 IF/ICC image (M03642-2 image captions). PA1653 has a human intestinal cancer IHC image and a U20S IF/ICC image (PA1653 image captions).
Which to pick: For tissue IHC, M03642-2 offers a mouse monoclonal clone 4G10 with documented EDTA pH 8.0 retrieval and 2 μg/ml incubation in a paraffin section; the fixative is unreported (catalog clone field; M03642-2 IHC caption). For IF/ICC, PA1653 offers a rabbit host and a documented 2 μg/ml U20S cell image (catalog host field; PA1653 IF caption). For cross-species planning, both list human, mouse and rat reactivity, while their supplied IHC images show human samples (catalog reactivity fields; M03642-2 and PA1653 IHC captions).