This website uses cookies to ensure you get the best experience on our website.


- Table of Contents
Plan NAA10 chromogenic IHC in FFPE sections around cytoplasmic staining that is most abundant in glandular epithelia (HPA tissue IHC). Use colon glandular cells as a positive reference and adipocytes as an undetected comparator (HPA tissue IHC), and check antibody coverage of the 2 annotated isoforms (UniProt).

Expected localisation, validated protocols, controls and antibodies — the at-a-glance facts below, then the full design guide.
| Expected localisation | Cytoplasmic tissue staining (HPA tissue IHC); nuclear location annotated (UniProt) | |
| Staining pattern | Cytoplasmic staining, most abundant in glandular epithelia (HPA tissue IHC) | |
| Antigen retrieval | Tris-EDTA pH 9.0 HIER, 95–98 °C, 20 min (rule: nuclear antigen) | |
| Positive control | Bone marrow+4 more · see all | |
| Negative control | Adipose tissue+3 more · see all |
| Fixation | Matched tissue-IHC evidence does not establish the fixation claim. Validate the specimen-specific method before use. (selected-SKU IHC image A02890) | |
| Caveat | Medium RNA–IHC agreement limits intensity prediction (HPA tissue IHC) | |
| Regulation | No target-specific inducer specified in the record (UniProt) | |
| Isoform / epitope | 2 isoforms; no extracellular domain; epitope coverage unknown (UniProt) |
Compare the catalog antibody’s IHC-P protocol with the published NAA10 IHC protocol (PMC11641810).
| Sample | Paraffin-embedded rat lung tissue; fixative not specified (datasheet A02890) |
| Fixation | Image fixative and duration unreported (datasheet A02890); verify before use. |
| Sectioning | 4–5 µm sections on charged slides (standard) |
| Deparaffinisation | Xylene, graded ethanol series to water (standard) |
| Antigen retrieval | Heat-induced epitope retrieval in Tris-EDTA buffer, pH 9.0, 20 min at 95–98 °C (standard rule: nuclear antigen) |
| Peroxidase block | 3% H2O2, 10 min, room temperature (standard) |
| Blocking | 10% normal serum of the secondary host, 30 min, room temperature (standard) |
| Primary antibody | Rabbit anti-NAA10, 1:50-1:200 (datasheet A02890) |
| Primary incubation | Overnight at 4 °C (standard) |
| Detection | HRP-polymer secondary, DAB chromogen 5–10 min (standard) |
| Counterstain | Hematoxylin, blue, dehydrate and mount (standard) |
| Expected result | NAA10-positive staining in hematopoietic cells of bone marrow (HPA tissue IHC: High). HPA tissue profile: Cytoplasmic expression in several tissue types, most abundant in glandular epithelia. No signal in the no-primary control. |
NAA10 staining should be predominantly cytoplasmic in several tissue types, especially glandular epithelia (HPA tissue IHC: Supported; medium staining–RNA consistency). UniProt also places NAA10 in the nucleus and reports no transmembrane segment (UniProt P41227). Assess staining in the identified cell population: colon and duodenal glandular cells are reported High, while adipocytes are Not detected (HPA tissue IHC).
| Clear cytoplasmic chromogen in glandular cells of colon or duodenum, with readable tissue structure. | This fits the reported High glandular-cell staining and predominantly cytoplasmic tissue profile (HPA tissue IHC). Score the glandular cells separately from nearby cells; a positive field alone does not show that every cell type expresses NAA10 (HPA tissue IHC: cell-specific levels). |
| Signal appears mainly at cell borders or as a uniform extracellular deposit. | A dominant border or extracellular pattern is discordant with the reported cytoplasmic distribution (HPA tissue IHC) and lack of a transmembrane segment (UniProt P41227). Review section morphology and detection controls before assigning it to NAA10; those locations alone do not establish target expression. |
| Adipocytes stain as strongly as adjacent expected-positive cells. | Adipocytes are reported Not detected (HPA tissue IHC). Strong staining there raises concern for cross-reactivity or detection background, including endogenous activity if an enzyme-based system is used (standard IHC practice). Treat the discrepancy as a control finding, not proof that the tissue lacks all NAA10. |
| Pale, widespread color obscures the difference between cells and surrounding tissue. | Diffuse background cannot be scored reliably as cytoplasmic NAA10. Compare the pattern with cell-specific High and Not detected findings (HPA tissue IHC), then examine blocking, washes, and detection controls for nonspecific color (standard IHC practice). |
| No interpretable signal appears in a correctly identified positive cell population. | Absence in colon glandular cells or cerebellar Purkinje cells conflicts with their reported High staining (HPA tissue IHC), but does not alone show biological loss. First check the section, antibody, retrieval, and detection run using appropriate controls (standard IHC practice). |
| Cell population and tissue | NAA10 is described as ubiquitous at the tissue level (UniProt P41227), yet HPA reports cell-specific contrasts: glandular cells in colon and duodenum are High, while adipocytes and cardiomyocytes are Not detected (HPA tissue IHC). Select and score controls by cell type, not by tissue name alone. |
| Compartment and topology | Cytoplasm and nucleus are listed locations, including free cytosolic and cytoskeleton-bound polysomes (UniProt P41227). Tissue IHC emphasizes cytoplasmic expression (HPA tissue IHC). Some nuclear signal therefore needs context; a dominant membrane pattern has no support from the reported lack of a transmembrane segment (UniProt P41227). |
| Isoforms and protein processing | Two isoforms are listed, with no signal peptide or propeptide and a chain spanning residues 1–235 (UniProt P41227). The supplied sources give no antibody epitope or isoform-specific tissue pattern. Do not attribute differing IHC intensity to one isoform or to cleavage on this evidence. |
| Strength of pattern evidence | The tissue profile is Supported, with medium consistency between antibody staining and RNA expression (HPA tissue IHC). Both listed antibodies, HPA030711 and CAB006269, carry IHC Supported status (HPA antibodies). These labels support the reported pattern but do not validate every unexpected compartment or cell type. |
| Situation | Likely cause | Next action |
|---|---|---|
| Colon glandular cells show no chromogen. | They are reported High (HPA tissue IHC); a failed run, unsuitable retrieval, or detection problem is possible (standard IHC practice). Target-specific fixation sensitivity is unreported in the supplied UniProt and HPA records. | Verify the glandular cells and a positive control, then review the IHC-P antibody instructions, retrieval conditions, and detection reagents (standard IHC practice). |
| The entire section has diffuse brown color. | Uniform color can reflect nonspecific reagent binding or endogenous detection activity in an enzyme-based assay (standard IHC practice). It does not match the cell-resolved cytoplasmic profile (HPA tissue IHC). | Inspect the no-primary control and review blocking, washes, and chromogen development before scoring individual cells (standard IHC practice). |
| Staining is confined to nuclei, with little cytoplasmic signal. | Nuclear location is listed (UniProt P41227), but predominantly cytoplasmic tissue staining is reported (HPA tissue IHC); the dominant pattern is therefore discordant, not automatically false. | Confirm nuclear boundaries with the counterstain and compare a known-positive section and detection control before interpreting a nuclear-only result (standard IHC practice). |
| Adipocytes show strong staining. | Adipocytes are reported Not detected (HPA tissue IHC). Cross-reactivity or background is plausible, especially when unrelated areas stain similarly (standard IHC practice). | Check cell identity, compare adjacent expected-positive cells, and examine a no-primary control before calling the adipocyte signal specific (standard IHC practice). |
| Positive and reported-negative cell populations stain equally. | Equal staining obscures the reported High versus Not detected contrasts (HPA tissue IHC) and may indicate excessive background or detection activity (standard IHC practice). | Score identified populations separately; review control sections and detection conditions, then repeat the IHC run if the contrast remains unreadable (standard IHC practice). |
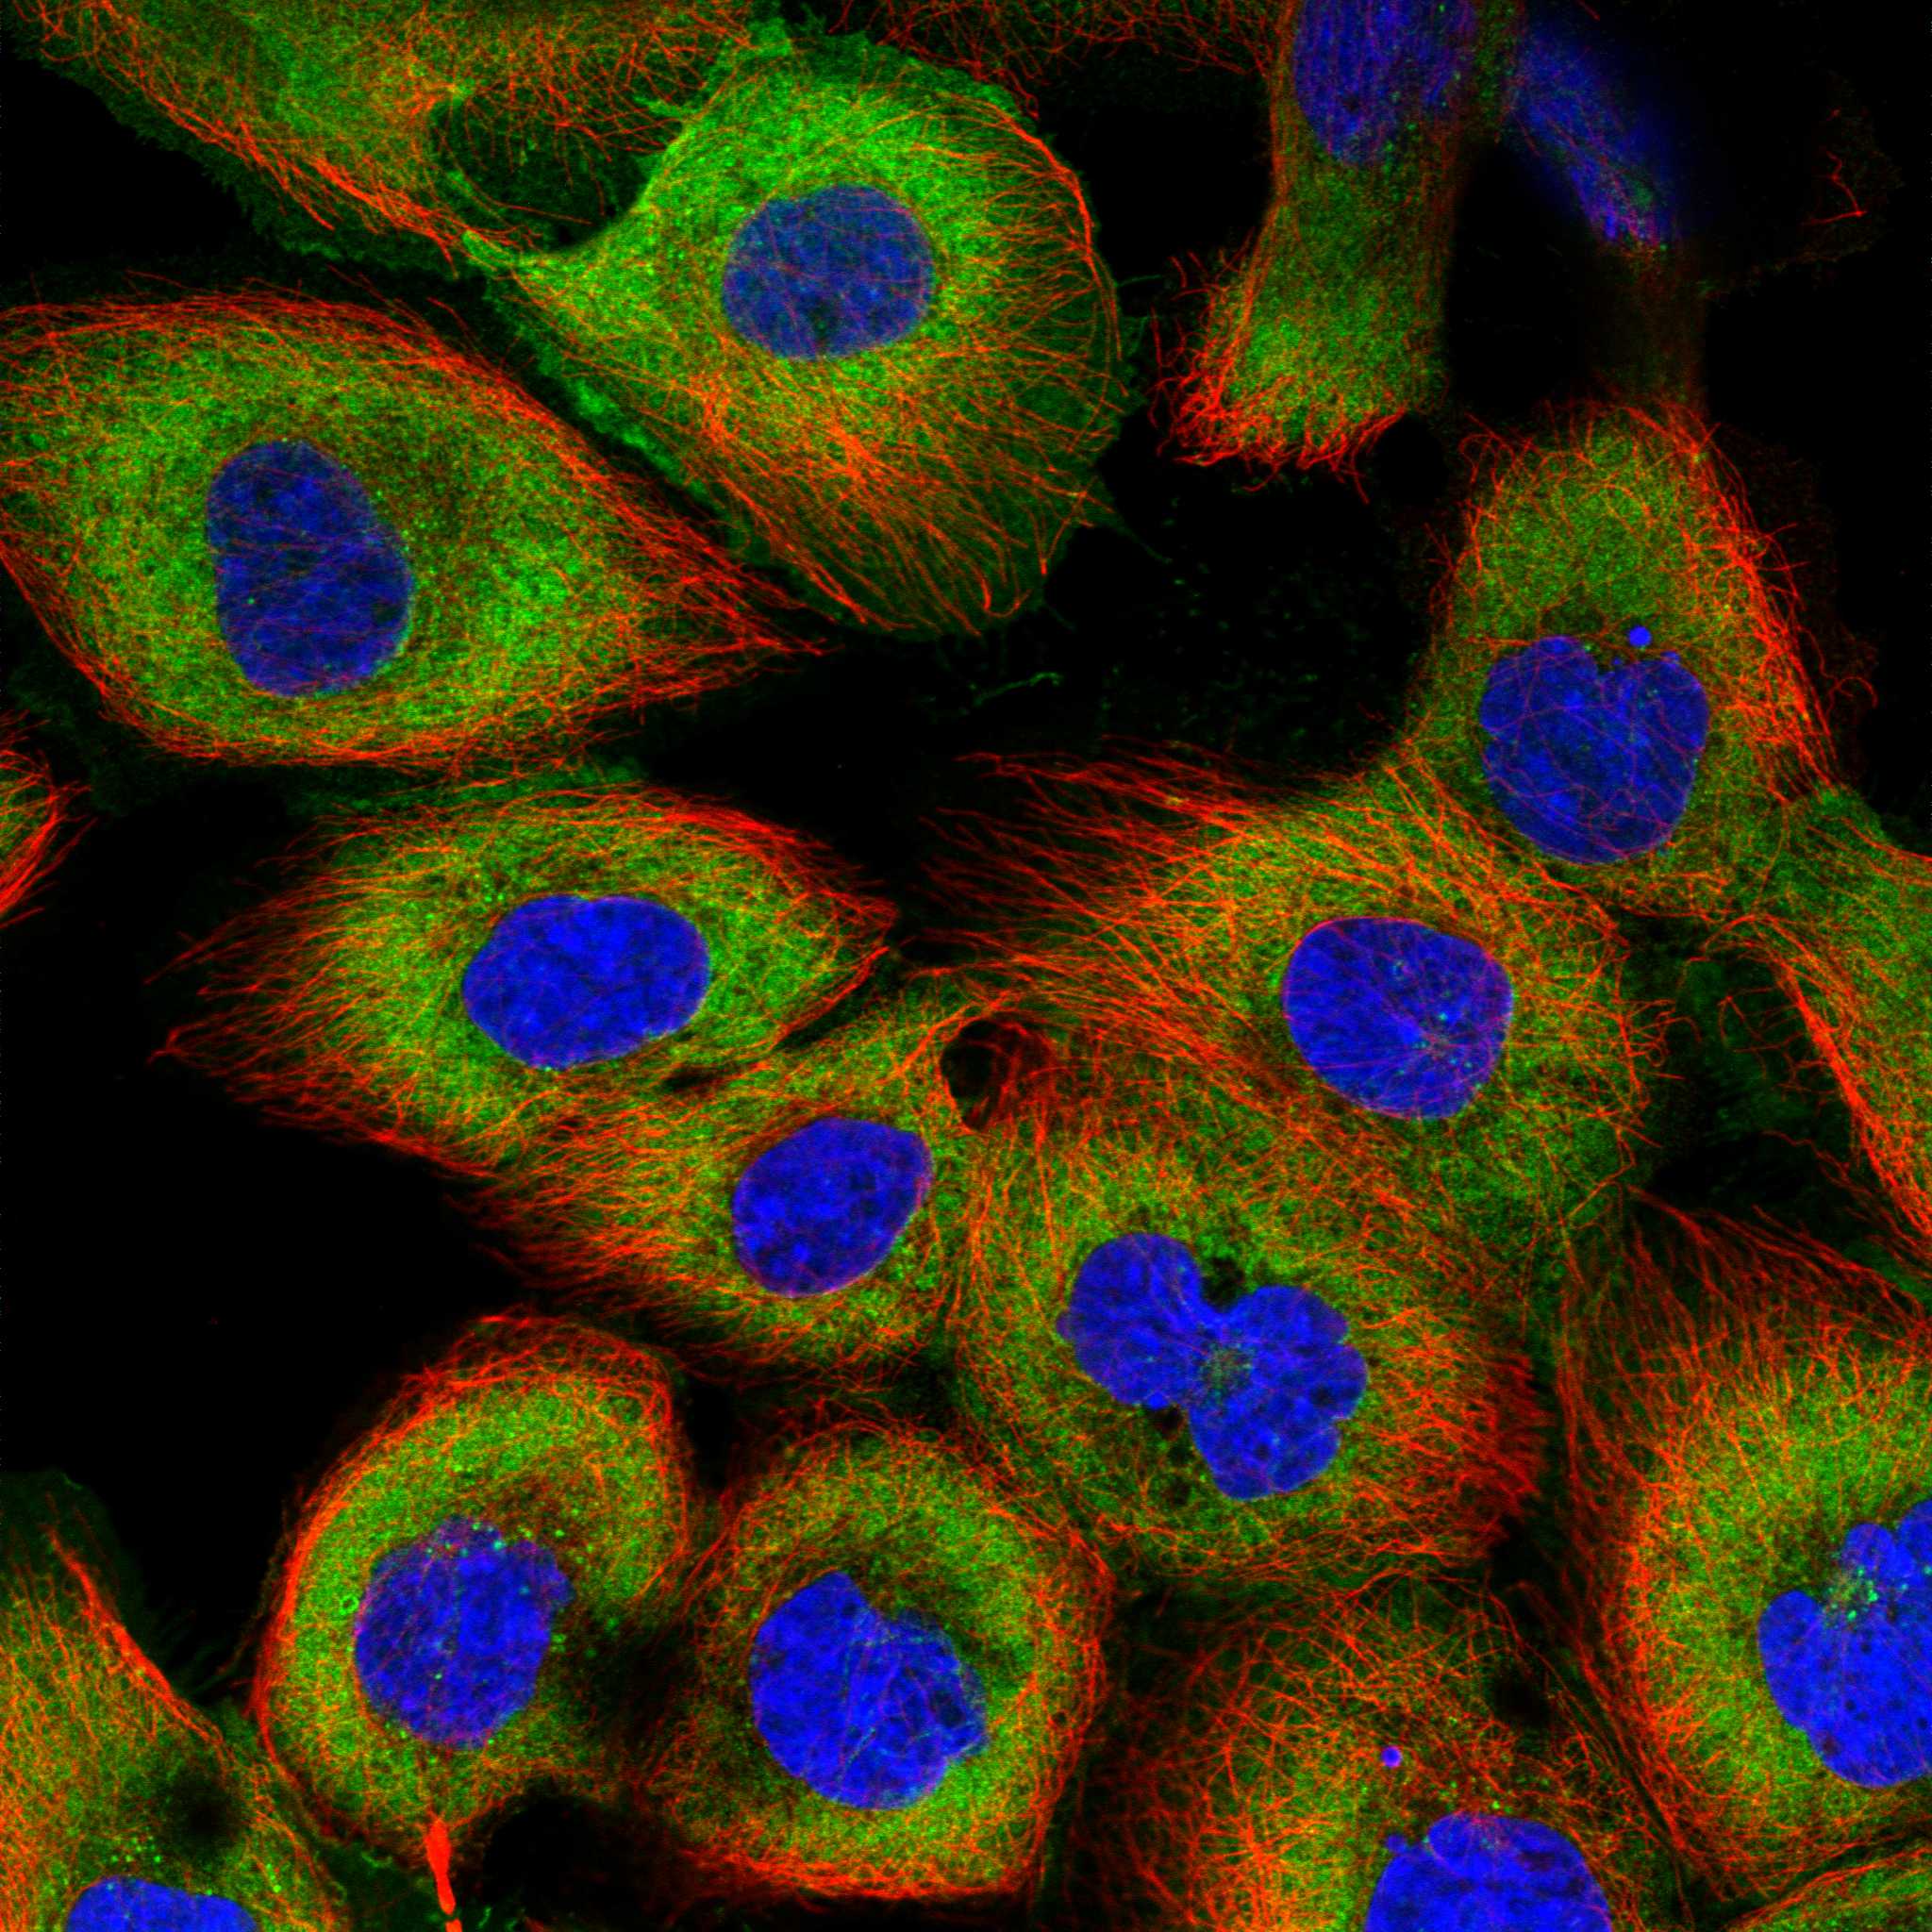
| IF/ICC question: Is a nucleolar signal compatible with NAA10? | Yes. Cytosol is the supported main ICC-IF location, and nucleoli are an approved additional location (HPA subcellular). | Interpret nucleolar signal alongside the cytosolic pattern and appropriate IF controls (HPA subcellular; standard IF practice). Use the separate IF/ICC guide for assay setup. |


Comprehensive Human Protein Atlas IHC scoring per tissue (reliability: Supported — Medium consistency between antibody staining and RNA expression data.). Rows are taken directly from the HPA tissue chart — click any row's HPA link to view the source.
| Tissue | Cell type | Level | Evidence | Source |
|---|---|---|---|---|
| Bone marrow | Hematopoietic cells | High | Protein (IHC) | HPA → |
| Cerebellum | Purkinje cells | High | Protein (IHC) | HPA → |
| Colon | Glandular cells | High | Protein (IHC) | HPA → |
| Duodenum | Glandular cells | High | Protein (IHC) | HPA → |
| Endometrium | Glandular cells | High | Protein (IHC) | HPA → |
| Tissue | Cell type | Level | Evidence | Source |
|---|---|---|---|---|
| Adipose tissue | Adipocytes | Not detected | Protein (IHC) | HPA → |
| Heart muscle | Cardiomyocytes | Not detected | Protein (IHC) | HPA → |
| Liver | Cholangiocytes | Not detected | Protein (IHC) | HPA → |
| Skeletal muscle | Myocytes | Not detected | Protein (IHC) | HPA → |
Troubleshoot NAA10 staining in paraffin sections by checking retrieval, compartment, cell type, and controls before interpreting chromogenic signal.
The catalog shows NAA10 IHC images from paraffin-embedded human and rat tissues, plus an IF image from human U-2 OS cells (catalog: A02890 IHC image captions; M02890 IF image caption).
A02890 lists IHC and ICC/IF, with IHC images from paraffin-embedded rat lung, human breast cancer and human stomach (catalog: A02890 applications and IHC image captions). M02890 lists IF and shows staining in paraformaldehyde-fixed U-2 OS cells (catalog: M02890 applications and IF image caption).
Which to pick: Choose A02890 for tissue IHC: its paraffin-section images use 1:100 and microwave retrieval in 10 mM PBS, pH 7.2; the tissue fixative is unreported (catalog: A02890 IHC image captions). For human-cell IF, M02890 has an image from 4% paraformaldehyde-fixed, 0.1% Triton X-100-permeabilized U-2 OS cells; its application list includes IF (catalog: M02890 IF image caption and applications). For ICC or cross-species work, A02890 is the listed choice: this polyclonal antibody includes ICC/IF and Human, Mouse and Rat reactivity, while polyclonal M02890 lists IF and Human reactivity (catalog: A02890 and M02890 applications, reactivity and dilution_raw).