This website uses cookies to ensure you get the best experience on our website.


- Table of Contents
Real validated OLIG1 Western blot protocols, expected-band and isoform facts, troubleshooting for weak or shifted signal, and recommended anti-OLIG1 WB antibodies. Everything you need to plan the experiment before you commit precious samples.
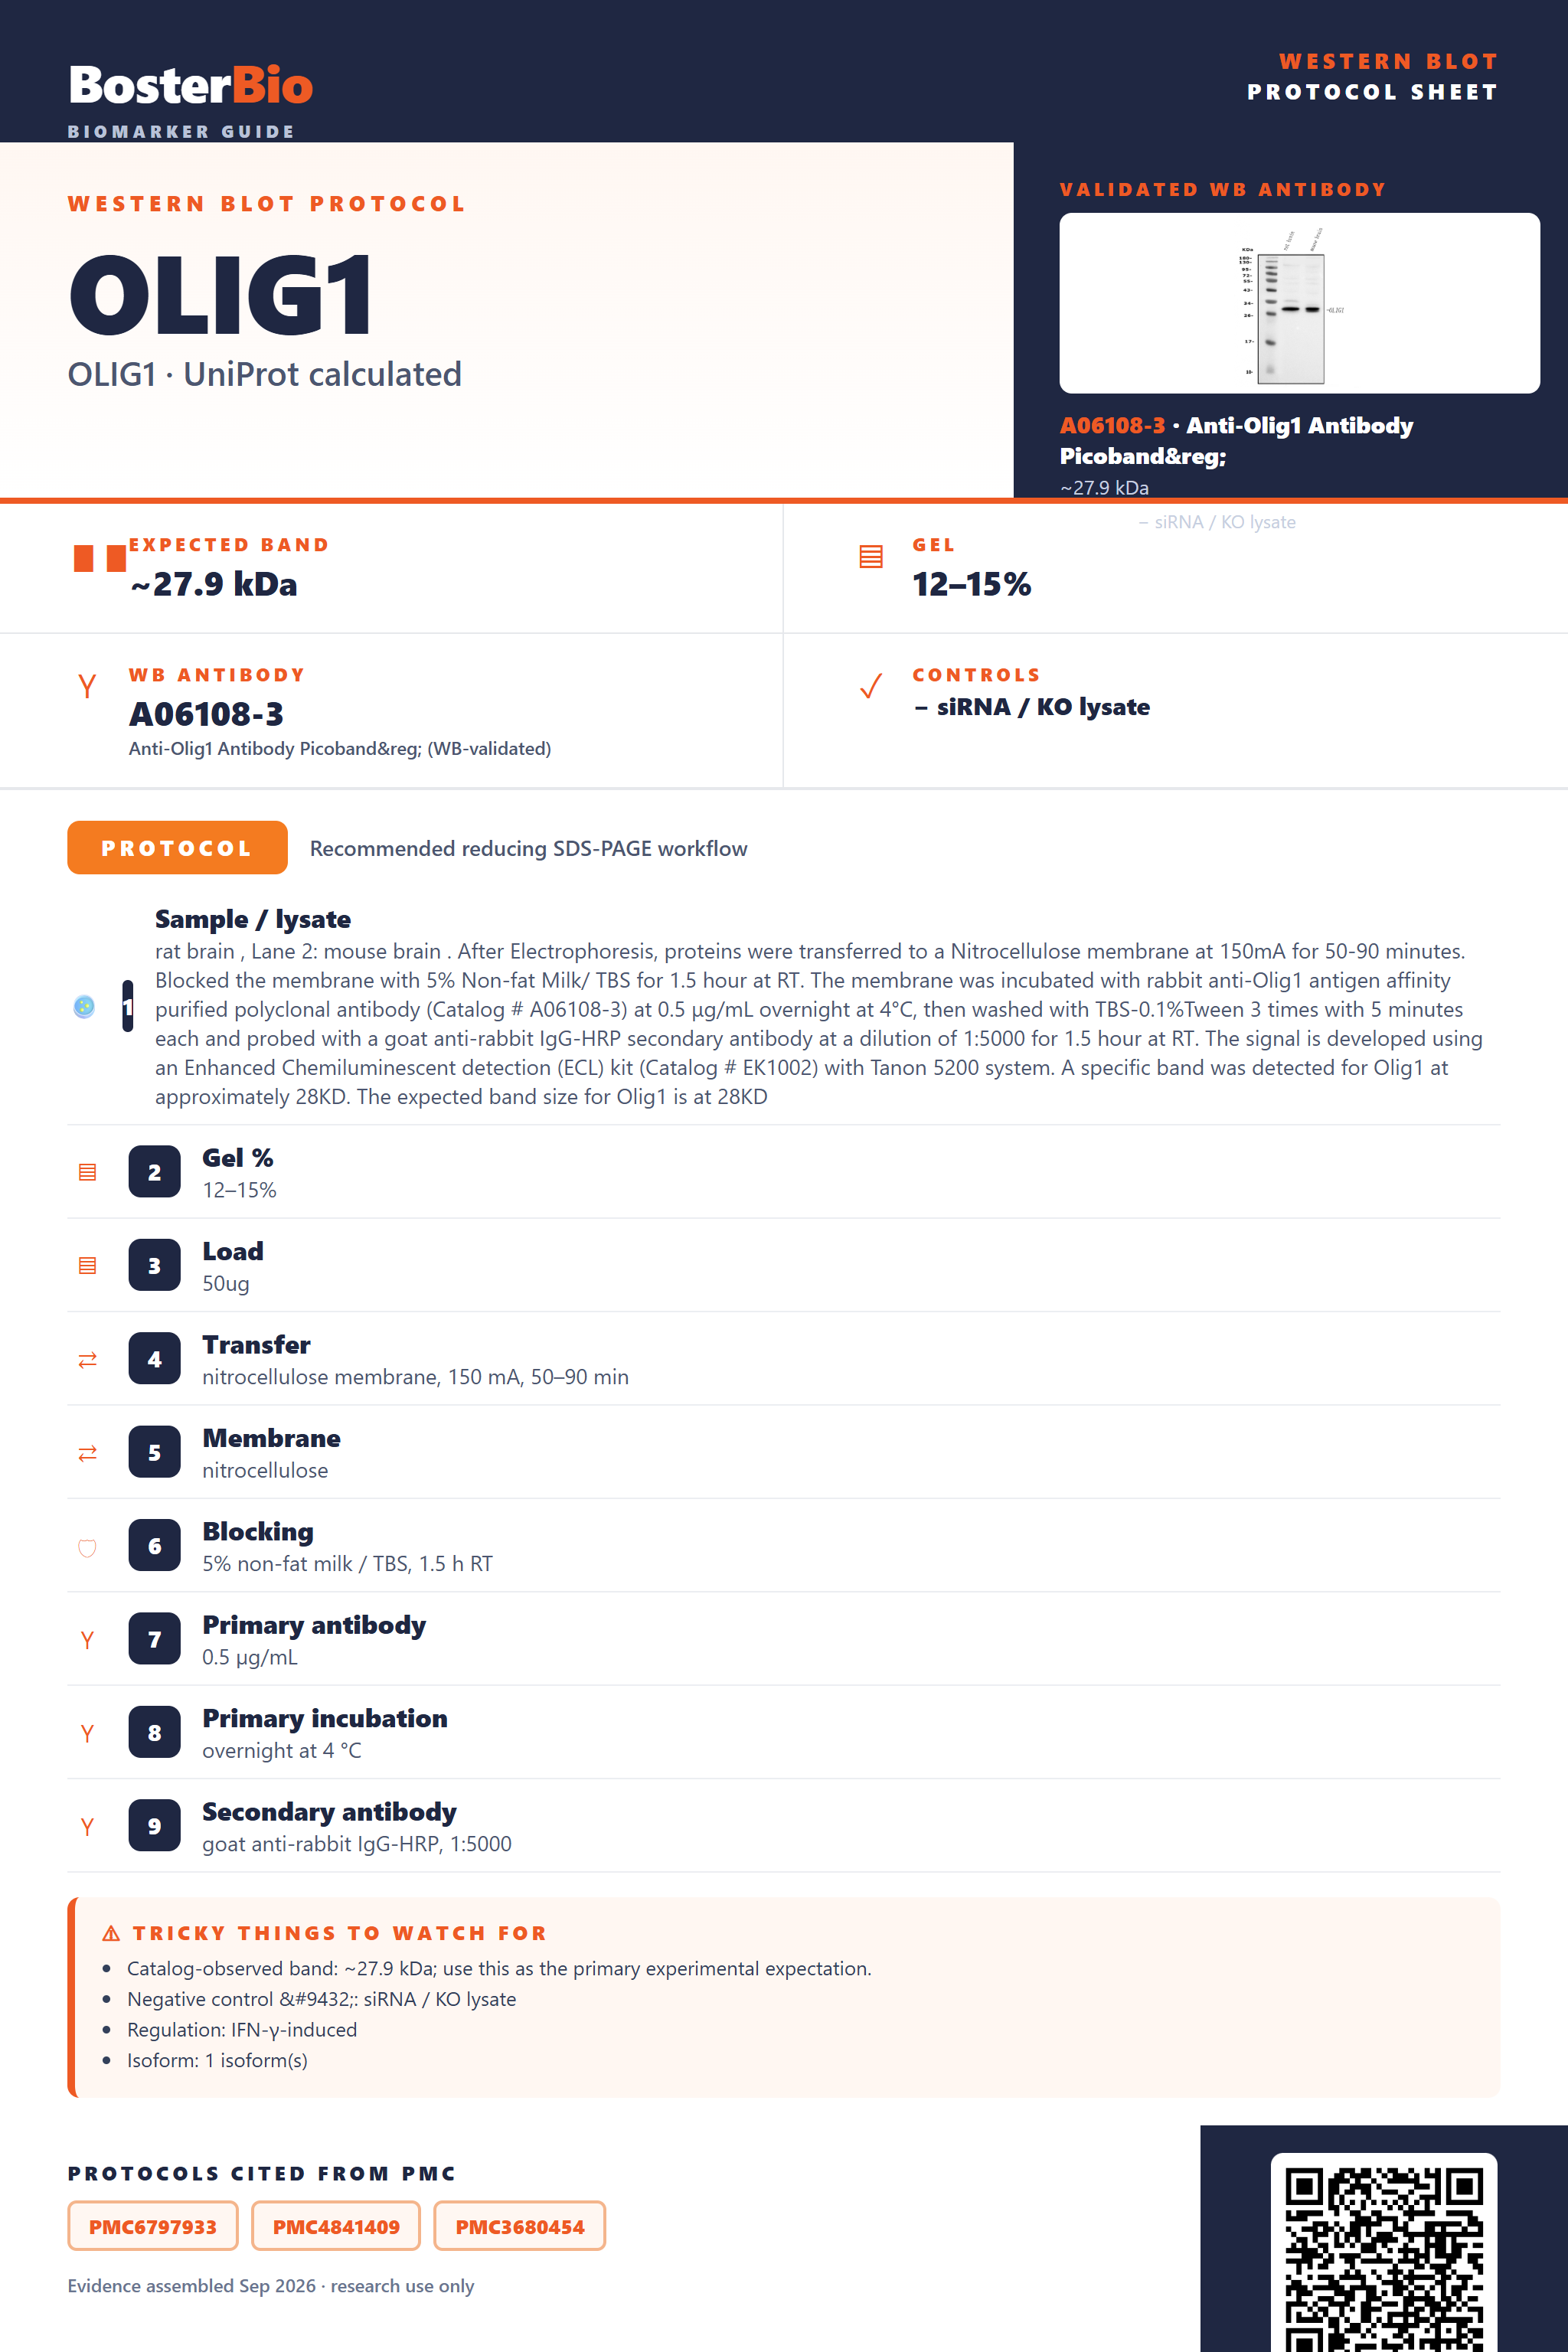
Expected bands, validated protocols, controls and antibodies — the at-a-glance facts below, then the full design guide.
| Expected band | ~27.9 kDa | |
| Observed band | ~28 kDa | |
| Gel | 12–15% | |
| Negative control | siRNA / KO lysate |
| PTM | — | |
| Caveat | — | |
| Regulation | IFN-γ-induced | |
| Isoform | 1 isoform(s) |
Literature-validated Western blot parameters for OLIG1 — gel percentage, transfer, blocking, antibody incubation and detection, extracted from published methods.
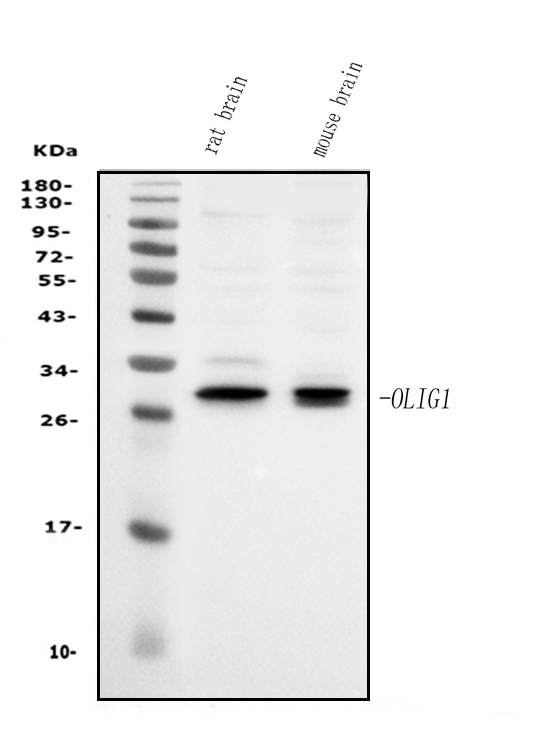
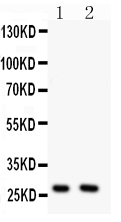
| Sample / lysate | rat brain , Lane 2: mouse brain . After Electrophoresis, proteins were transferred to a Nitrocellulose membrane at 150mA for 50-90 minutes. Blocked the membrane with 5% Non-fat Milk/ TBS for 1.5 hour at RT. The membrane was incubated with rabbit anti-Olig1 antigen affinity purified polyclonal antibody (Catalog # A06108-3) at 0.5 μg/mL overnight at 4°C, then washed with TBS-0.1%Tween 3 times with 5 minutes each and probed with a goat anti-rabbit IgG-HRP secondary antibody at a dilution of 1:5000 for 1.5 hour at RT. The signal is developed using an Enhanced Chemiluminescent detection (ECL) kit (Catalog # EK1002) with Tanon 5200 system. A specific band was detected for Olig1 at approximately 28KD. The expected band size for Olig1 is at 28KD |
| Gel % | 12–15% |
| Load | 50ug |
| Transfer | nitrocellulose membrane, 150 mA, 50–90 min |
| Membrane | nitrocellulose |
| Blocking | 5% non-fat milk / TBS, 1.5 h RT |
| Primary antibody | 0.5 µg/mL |
| Primary incubation | overnight at 4 °C |
| Secondary antibody | goat anti-rabbit IgG-HRP, 1:5000 |
| Wash | TBS-0.1% Tween, 3 × 5 min |
| Detection | ECL |
| Exposure / imaging | Tanon 5200 |
| Observed band | 28 kDa |
OLIG1 has a 27.9 kDa predicted mass and runs at the same ~28 kDa on blots, since it lacks glycosylation, disulfide dimerization, or cleavage that would shift its size.
| single sharp band at ~28 kDa | matches OLIG1's predicted 27.9 kDa mass, with no glycosylation, cleavage, or dimerization to shift it |
| band present in nuclear-enriched fraction, weak or absent in cytoplasmic-only prep | OLIG1 is a nuclear DNA-binding transcription factor, so it concentrates in the nuclear compartment |
| band position unchanged between reducing and non-reducing conditions | OLIG1 has no annotated disulfide bonds, so it does not form a covalent inter-chain dimer |
| no diffuse high-molecular-weight smear above the main band | OLIG1 has no annotated glycosylation sites, so there is no glycoform heterogeneity to broaden the band |
| single band only, no doublet or ladder of bands | UniProt lists only one OLIG1 isoform and no signal peptide or propeptide, so no splice variants or cleaved fragments are expected |
| predicted mass (27.9 kDa / 271 aa) | sets the baseline expected band at ~28 kDa, consistent with the empirically observed band |
| absence of glycosylation sites | no glycoform smearing or upward mass shift; band stays sharp near the predicted size |
| absence of disulfide bonds or homodimer formation | no covalent dimer forms, so no higher-molecular-weight doublet appears even under non-reducing conditions |
| single annotated isoform, no signal peptide or propeptide | no alternative splice bands or precursor/mature cleavage products; only one full-length species is expected |
| Situation | Likely cause | Next action |
|---|---|---|
| No band in lysate | OLIG1 is a nuclear transcription factor restricted to oligodendrocyte-lineage cells, and standard whole-cell lysis can under-recover nuclear proteins | use lysate from an OLIG1-expressing source (e.g. brain or oligodendrocyte precursor tissue) or a nuclear extraction protocol, and increase protein loading |
| Band higher than expected | incomplete denaturation or nonspecific cross-reactivity, since OLIG1 has no disulfide bonds so a true higher-mass dimer is not expected | confirm complete reduction and denaturation with fresh reducing agent and adequate boiling, and check specificity against a knockout or knockdown control |
| Band lower than expected | proteolytic degradation during lysate preparation, since OLIG1 has no propeptide so a smaller band is not a normal processing product | add fresh protease inhibitors, keep samples cold throughout, and minimize freeze-thaw cycles |
| Multiple bands | nonspecific antibody binding, since UniProt annotates only one OLIG1 isoform so extra bands are not expected splice variants | validate the specific band using a positive control lysate alongside a blocking peptide or knockout/knockdown lysate |
| Weak or no signal | OLIG1 is a low-abundance nuclear transcription factor that can be under-represented in standard whole-cell extracts | use a nuclear extraction method, load more total protein, and extend primary antibody incubation time |
Comprehensive Human Protein Atlas IHC scoring per tissue. Rows are taken directly from the HPA tissue chart — click any row's HPA link to view the source.
| Tissue | Cell type | Level | Evidence | Source |
|---|
| Tissue | Cell type | Level | Evidence | Source |
|---|
Deeper troubleshooting and optimisation questions for OLIG1, answered from its protein features.
BosterBio's OLIG1 antibodies are among the best-performing WB antibodies on the market — well cited, thoroughly validated, and orthogonally cross-validated against negative tissues and complementary methods.
Both anti-OLIG1 antibodies below are top-performing, frequently cited choices with thorough validation: each ships with its own western blot image confirming specificity, cross-checked against predicted molecular weight and characterized cell lysates for reliable, reproducible OLIG1 detection.
Which to pick: Both A06108-3 and PA2213 include real western blot validation images. PA2213 shows confirmed reactivity in human U87 and HeLa lysates at the predicted 28kD size, making it ideal for human samples; A06108-3 offers direct Olig1-specific western blot evidence for general use.