This website uses cookies to ensure you get the best experience on our website.


- Table of Contents
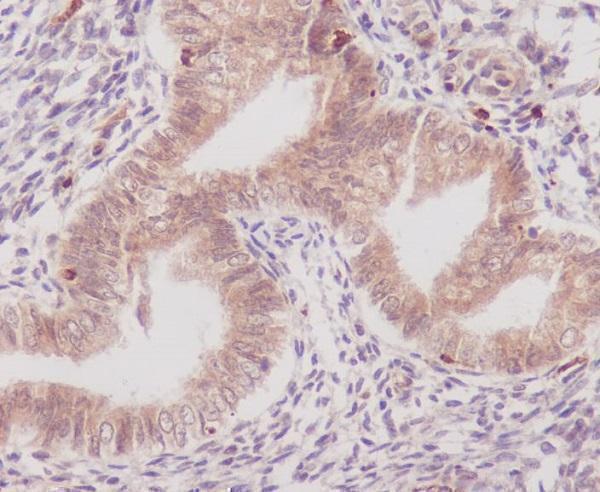
Plan PTGS1 chromogenic IHC in paraffin sections with the catalog antibody’s documented 2 µg/mL starting concentration (datasheet PB9002). Use the reported tissue staining to select control cell populations and assess cytoplasmic staining (HPA tissue IHC).

Expected localisation, validated protocols, controls and antibodies — the at-a-glance facts below, then the full design guide.
| Expected localisation | Cytoplasmic tissue staining (HPA tissue IHC) | |
| Staining pattern | Variable cytoplasmic staining; high in squamous epithelia (HPA tissue IHC) | |
| Antigen retrieval | EDTA pH 8.0 HIER, heat-mediated (datasheet PB9002) | |
| Positive control | Appendix+4 more · see all | |
| Negative control | Adipose tissue+4 more · see all |
| Fixation | Keep fixation consistent across paraffin sections. (standard IHC practice; not target-specific) | |
| Caveat | Stromal cell staining may complicate epithelial scoring (HPA tissue IHC) | |
| Regulation | Expression regulation is not annotated (UniProt) | |
| Isoform / epitope | 6 isoforms; effects on antibody epitopes are unspecified (UniProt) |
Compare the catalog antibody’s IHC-P protocol (datasheet PB9002) with three published PTGS1 IHC protocols (PMC13338899; PMC12234924; PMC3896710).
| Sample | Paraffin-embedded human breast cancer tissue; fixative not specified (datasheet PB9002) |
| Fixation | Image fixative and duration unreported (datasheet PB9002); verify before use. |
| Sectioning | 4–5 µm sections on charged slides (standard) |
| Deparaffinisation | Xylene, graded ethanol series to water (standard) |
| Antigen retrieval | Heat retrieval: EDTA pH 8.0 (datasheet PB9002); 20 min, 95–100 °C (standard) |
| Peroxidase block | 3% H2O2, 10 min, room temperature (standard) |
| Blocking | 10% goat serum (datasheet PB9002) |
| Primary antibody | Rabbit anti-PTGS1, 2-5μg/ml (datasheet PB9002) |
| Primary incubation | Overnight at 4 °C (datasheet PB9002) |
| Detection | HRP-conjugated secondary, DAB chromogen (datasheet PB9002) |
| Counterstain | Hematoxylin, blue, dehydrate and mount (standard) |
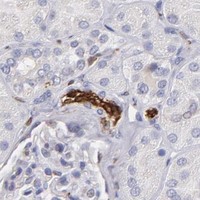
| Expected result | PTGS1-positive staining in endocrine cells of appendix (HPA tissue IHC: High). HPA tissue profile: Cytoplasmic expression at variable levels in several tissues, high expression in squamous epithelia, megakaryocytes, fallopian tube, brain and subsets of cells in tissue stroma. No signal in the no-primary control. |
PTGS1 is associated with endoplasmic reticulum and microsome membranes, despite having no transmembrane segment (UniProt P23219 localization and topology). In paraffin-section IHC, expect cytoplasmic staining in selected cell populations, including fallopian tube glandular cells, skin granular-layer cells and intestinal endocrine cells (HPA: tissue IHC). HPA rates the tissue profile Enhanced, with medium consistency between antibody staining and RNA expression and support from paired antibodies (HPA: tissue IHC reliability).
| Cytoplasmic staining in fallopian tube glandular cells or skin granular-layer cells. | This matches cell populations scored High by HPA (HPA: fallopian tube and skin tissue IHC). Score the named cells separately from adjacent cells; HPA's High designation applies to those populations, not every cell in the section (HPA: tissue IHC). |
| Strong nuclear-only staining, without a convincing cytoplasmic component. | This conflicts with the cytoplasmic tissue profile (HPA: tissue IHC) and the endoplasmic reticulum and microsome membrane localization (UniProt P23219 localization). Treat it as suspect until a known-positive cell population shows the expected pattern and controls exclude detection artefact (general IHC practice). |
| Strong staining in adipocytes or bronchial respiratory epithelial cells. | HPA reports PTGS1 as Not detected in those specific cell populations (HPA: adipose tissue and bronchus tissue IHC). Check whether staining persists without primary antibody; persistent signal suggests endogenous detection activity, while primary-dependent signal warrants an antibody-specificity review (general IHC practice). |
| Uniform color across cells, stroma and empty areas. | A field-wide deposit does not reproduce HPA's variable, cell-selective cytoplasmic profile (HPA: tissue IHC). Consider nonspecific background or detection-reagent activity; compare no-primary controls and inspect whether the deposit respects cell boundaries (general IHC practice). |
| No staining in a section containing fallopian tube glandular cells. | Those cells are scored High by HPA (HPA: fallopian tube tissue IHC), so their absence of signal makes the run inconclusive for a negative result elsewhere. Check tissue preservation, antibody and detection performance using the assay's validated controls (general IHC practice). |
| Cell population selected for comparison | HPA scores endocrine cells in appendix, colon, duodenum and rectum as High, but stomach glandular cells as Low (HPA: tissue IHC). Compare like cell types when judging intensity; a weak stomach result cannot be treated as failure solely because an intestinal endocrine population stains strongly. |
| Compartment and optical resolution | UniProt places PTGS1 at endoplasmic reticulum and microsome membranes without a transmembrane segment (UniProt P23219 localization and topology). HPA describes tissue staining as cytoplasmic (HPA: tissue IHC); chromogenic sections may establish a cytoplasmic pattern without resolving the specific membrane system (general IHC practice). |
| Antibody validation in IHC | HPA lists Enhanced IHC validation for HPA002834 and CAB020315 (HPA: antibody validation). Its tissue profile also has medium consistency with RNA and support from paired antibodies (HPA: tissue IHC reliability). These findings support interpretation of the reported pattern, while each assay still needs appropriate controls (general IHC practice). |
| IF/ICC expected localization? | HPA reports Golgi apparatus and vesicles as uncertain ICC-IF locations, and lists HPA002834 ICC validation as Uncertain (HPA: subcellular and antibody validation). Treat puncta in IF/ICC as provisional; do not require that appearance to call a chromogenic tissue IHC result positive (HPA: tissue IHC; general assay interpretation). |
| Processing and sequence diversity | UniProt lists a signal peptide at residues 1–23, a mature chain at 24–599, six isoforms and glycosylation sites at residues 67, 103 and 143 (UniProt P23219 processing, isoforms and glycosylation). Without an antibody epitope map, these facts do not establish which forms the assay detects or predict a retrieval response. |
| Situation | Likely cause | Next action |
|---|---|---|
| Known-positive glandular cells have no visible signal. | A failed run or unsuitable assay conditions are possible; fallopian tube glandular cells are High in HPA tissue IHC (HPA: fallopian tube). | Review the positive control, antibody and detection steps together before scoring other populations negative (general IHC practice). Do not infer PTGS1-specific fixation sensitivity from this result. |
| Adipocytes appear as strongly positive as the intended cells. | HPA scores adipocytes Not detected (HPA: adipose tissue IHC); primary-independent signal or cross-reactivity may explain the discrepancy (general IHC practice). | Compare a no-primary control, then assess whether signal tracks the antibody; verify cell identity and repeat with an independently validated antibody if needed (general IHC practice; HPA: paired-antibody support). |
| Nuclei dominate while cytoplasm remains unstained. | Nuclear-only signal conflicts with HPA's cytoplasmic tissue profile (HPA: tissue IHC) and UniProt's membrane-associated localization (UniProt P23219 localization). | Inspect counterstain and no-primary controls, then reassess the known-positive cytoplasmic population before accepting a nuclear result (general IHC practice). |
| Every compartment carries diffuse chromogen. | The distribution does not match HPA's variable, cell-selective tissue staining (HPA: tissue IHC); nonspecific binding or endogenous detection activity is possible (general IHC practice). | Check no-primary controls and the blocking and detection workflow; score only staining that remains cell-localized above background (general IHC practice). |
| Stomach glandular cells look faint beside intestinal endocrine cells. | HPA scores stomach glandular cells Low and intestinal endocrine cells High (HPA: tissue IHC). | Judge each population against its own reported level and a run control; do not increase exposure or chromogen development solely to equalize these cell types (HPA: tissue IHC; general IHC practice). |
| IF/ICC puncta seem inconsistent with the IHC slide. | Golgi and vesicle ICC-IF assignments are uncertain (HPA: subcellular), whereas tissue IHC reports cytoplasmic staining (HPA: tissue IHC). | Interpret the assays separately; use the cell-selective cytoplasmic IHC pattern for this paraffin-section readout and treat the IF/ICC localization as provisional (HPA: tissue IHC and subcellular). |




![HPA ICC-IF BJ [Human fibroblast] — PTGS1 (HPA002834)](https://images.proteinatlas.org/2834/1446_E11_1_blue_red_green.jpg)
![HPA ICC-IF BJ [Human fibroblast] — PTGS1 (HPA002834)](https://images.proteinatlas.org/2834/1446_E11_4_blue_red_green.jpg)
Comprehensive Human Protein Atlas IHC scoring per tissue (reliability: Enhanced — Medium consistency between antibody staining and RNA expression data. Paired antibodies with high similarity support the protein profile.). Rows are taken directly from the HPA tissue chart — click any row's HPA link to view the source.
| Tissue | Cell type | Level | Evidence | Source |
|---|---|---|---|---|
| Appendix | Endocrine cells | High | Protein (IHC) | HPA → |
| Colon | Endocrine cells | High | Protein (IHC) | HPA → |
| Duodenum | Endocrine cells | High | Protein (IHC) | HPA → |
| Endometrium | Glandular cells | High | Protein (IHC) | HPA → |
| Fallopian tube | Glandular cells | High | Protein (IHC) | HPA → |
| Tissue | Cell type | Level | Evidence | Source |
|---|---|---|---|---|
| Adipose tissue | Adipocytes | Not detected | Protein (IHC) | HPA → |
| Adrenal gland | Glandular cells | Not detected | Protein (IHC) | HPA → |
| Bronchus | Respiratory epithelial cells | Not detected | Protein (IHC) | HPA → |
| Heart muscle | Cardiomyocytes | Not detected | Protein (IHC) | HPA → |
| Nasopharynx | Respiratory epithelial cells | Not detected | Protein (IHC) | HPA → |
Troubleshoot PTGS1 staining in paraffin sections by checking retrieval, cell identity and intracellular pattern before comparing signal intensity across samples.
Both antibodies have human paraffin-section IHC images; PB9002 also has a mouse colon IHC image, while M00811 lists IF/ICC for human, mouse, and rat (catalog image captions; applications/reactivity).
PB9002 has IHC images from paraffin-embedded human breast cancer, colonic adenoma, and lung cancer tissue, plus mouse colon (PB9002 IHC captions). M00811 has a paraffin-embedded human uterus IHC image and lists human, mouse, and rat reactivity and IF/ICC use; no IF image is supplied (M00811 IHC caption; catalog applications/reactivity).
Which to pick: For tissue IHC, choose PB9002 when its documented paraffin-section conditions are useful: EDTA retrieval at pH 8.0 and 2 μg/ml primary antibody overnight at 4°C (PB9002 IHC captions). For IF/ICC, choose the rabbit monoclonal M00811 because IF/ICC is listed at 1:50; its supplied figure documents only paraffin-section IHC (M00811 catalog applications/dilution; IHC caption). Both list human, mouse, and rat reactivity, but PB9002 also has a mouse tissue IHC image; neither IHC caption reports the fixative (catalog reactivity; PB9002 and M00811 IHC captions).