RANBP1 / Ran-specific GTPase-activating protein · IHC design guide

Design Immunohistochemistry for RANBP1

Plan RANBP1 chromogenic IHC around the cytoplasmic staining reported in intestinal endocrine cells (HPA tissue IHC). Use the catalog antibody’s paraffin-section dilution of 0.5–1 μg/ml and assess staining by cell type (datasheet A04000-2; HPA tissue IHC).

Evidence assembled Oct 2026 · For research use; verify linked source records and product datasheet before use
Immunohistochemistry protocol sheet for RANBP1 (IHC for RANBP1): expected localisation Cytoplasmic staining in selected tissues (HPA tissue IHC), antibody A04000-2, validated IHC image, and IHC protocol steps
Printable RANBP1 IHC protocol sheet — expected localisation Cytoplasmic staining in selected tissues (HPA tissue IHC), antibody A04000-2, controls and protocol steps. Open the full RANBP1 IHC guide →

RANBP1 Immunohistochemistry Experimental Design Guide

Expected localisation, validated protocols, controls and antibodies — the at-a-glance facts below, then the full design guide.

Must know before staining
Expected localisation Cytoplasmic staining in selected tissues (HPA tissue IHC)
Staining pattern Cytoplasmic staining in intestinal endocrine cells (HPA tissue IHC)
Antigen retrieval Citrate pH 6 HIER, heat-mediated (datasheet A04000-2)
Positive control ⓘ Appendix+4 more · see all
Negative control ⓘ Adipose tissue+4 more · see all
Important caveats
Reasons your staining may differ from the expected pattern.
Fixation Keep fixation consistent across paraffin sections (standard IHC practice; not target-specific)
Caveat Score intestinal endocrine cells separately from other cells (HPA tissue IHC)
Regulation Expression regulation not annotated (UniProt)
Isoform / epitope 2 isoforms; epitope differences unspecified (UniProt)
Section 1

Recommended RANBP1 IHC & IF Protocols

Start with the catalog antibody’s IHC-P protocol, then compare the published RANBP1 methods for oral cancer, triple-negative breast cancer, and serous epithelial ovarian cancer.

Recommended immunohistochemistry (IHC-P) protocol parameters
SampleParaffin-embedded mouse intestine tissues; fixative not specified (datasheet A04000-2)
FixationImage fixative and duration unreported (datasheet A04000-2); verify before use.
Sectioning4–5 µm sections on charged slides (standard)
DeparaffinisationXylene, graded ethanol series to water (standard)
Antigen retrievalHeat retrieval: Citrate pH 6, 20 min (datasheet A04000-2)
Peroxidase block3% H2O2, 10 min, room temperature (standard)
Blocking10% goat serum (datasheet A04000-2)
Primary antibodyRabbit anti-RANBP1, 0.5-1μg/ml (datasheet A04000-2)
Primary incubationOvernight at 4 °C (datasheet A04000-2)
DetectionStreptavidin-biotin complex (SABC), DAB chromogen (datasheet A04000-2)
CounterstainHematoxylin, blue, dehydrate and mount (standard)
Expected resultRANBP1-positive staining in enterocytes of appendix (HPA tissue IHC: High). HPA tissue profile: Cytoplasmic expression in testis, intestinal tract, lymphoid and hematopoietic tissue, and squamous epithelia. No signal in the no-primary control.
💡Decision noteTry the catalog antibody’s citrate pH 6 heat retrieval first (datasheet A04000-2); the ovarian cancer study used citrate-EDTA pH 8 with a different antibody (PMC3953127).
Section 2

What Is the Expected RANBP1 Staining Pattern?

RANBP1 should appear predominantly in the cytoplasm in paraffin sections, with staining varying by cell type (HPA tissue IHC: Supported; medium consistency between antibody staining and RNA). High staining is reported in appendix enterocytes and several intestinal endocrine cell populations (HPA tissue IHC: High). Cytosolic localisation in ICC-IF supports this compartmental expectation (HPA subcellular: Cytosol, enhanced). RANBP1 has no transmembrane segment (UniProt P43487 topology).

What am I looking at on my slide?
Clear cytoplasmic staining in appendix enterocytes, with nuclei distinguishable by counterstain.This matches an HPA High cell population and the reported cytoplasmic tissue pattern (HPA tissue IHC: High in appendix enterocytes; cytoplasmic profile). Judge the named cells and compartment together; a positive tissue does not imply that every cell in its section must stain equally.
Strong nuclear-only staining, with little cytoplasmic signal, in the expected positive cells.This conflicts with the reported cytoplasmic tissue pattern and cytosolic ICC-IF localisation (HPA tissue IHC: cytoplasmic profile; HPA subcellular: Cytosol, enhanced). Treat it as a possible artefact; check antibody specificity and detection controls before interpreting it as a new RANBP1 location.
The strongest staining is in cells expected to be unstained, while the named positive cells are faint.Consider cross-reactivity or endogenous detection activity before assigning that pattern to RANBP1. For example, adipocytes are Not detected in the HPA adipose tissue entry (HPA tissue IHC: adipocytes). That observation is a comparator, not proof that every adipocyte in every preparation lacks the protein.
Color is spread across tissue, including spaces or cell types without a clear cytoplasmic boundary.A diffuse deposit cannot be scored confidently as the reported cell-specific cytoplasmic pattern (HPA tissue IHC: cytoplasmic profile). General IHC practice: inspect a no-primary control and the detection reagents for background, then assess staining at the level of individual cells.
No visible signal appears in an appendix section whose enterocytes are identifiable.That disagrees with the HPA High entry for appendix enterocytes (HPA tissue IHC: appendix enterocytes). Check tissue preservation, antibody and detection performance, and whether the relevant cells are present. HPA reports medium consistency between staining and RNA, so one negative section alone does not establish target absence (HPA tissue IHC: Supported).
💡Expected RANBP1 appearanceCall a result positive when identifiable appendix enterocytes show clear, predominantly cytoplasmic staining consistent with the HPA High entry; nuclear-only color or diffuse color without cell boundaries is suspect (HPA tissue IHC: appendix enterocytes, High; cytoplasmic profile).
How each factor affects the staining
Cell population and tissue contextHPA lists High staining in breast and endometrial glandular cells, ovarian follicle cells, and intestinal endocrine cells, alongside Not detected entries for specified other cell populations (HPA tissue IHC). Select and score a named cell population, rather than treating a whole tissue as uniformly positive.
Evidence strength for paraffin-section interpretationThe tissue IHC profile is Supported, with medium consistency between antibody staining and RNA (HPA tissue IHC: reliability). Of the listed antibodies, HPA065931 has IHC Supported status; HPA065868 has no IHC status listed (HPA antibodies). These categories guide confidence but do not replace controls in the actual run.
Topology and protein formsThe record lists no transmembrane segment or signal peptide, a chain spanning residues 2–201, and 2 isoforms (UniProt P43487 topology, processing, isoforms). These facts do not identify the catalog antibody's epitope or predict a retrieval condition; use the antibody's documented IHC information for those choices.
IF/ICC Q&A: What localisation should an IF image show?Predominantly cytosolic signal is the HPA ICC-IF expectation (HPA subcellular: Cytosol, enhanced). HPA lists ICC Enhanced for both HPA065868 and HPA065931 (HPA antibodies). This is an interpretation cross-check for IF/ICC; assess the paraffin-section result against the tissue IHC profile.
Why is my staining missing, weak or wrong?
SituationLikely causeNext action
Expected positive enterocytes stain weakly or not at all.The result differs from the appendix enterocyte High observation (HPA tissue IHC). A failed staining run or absence of intact target cells is possible; the payload does not establish a RANBP1-specific fixation sensitivity.General IHC practice: confirm the cells and section quality, run an established positive control, and verify the documented IHC antibody and detection workflow before changing conditions.
Nuclei dominate while cytoplasm is faint.A nuclear-only pattern conflicts with cytoplasmic tissue staining and cytosolic ICC-IF localisation (HPA tissue IHC: profile; HPA subcellular: Cytosol, enhanced). The pattern may reflect artefact.General IHC practice: compare with a no-primary control, inspect counterstain and chromogen separation, and repeat with an independently validated antibody if available.
A broad stain appears in a cell population listed as Not detected.Cross-reactivity or endogenous detection activity is possible. HPA's negative entries apply to named cells, such as adipocytes, rather than every cell in that tissue (HPA tissue IHC: adipocytes, Not detected).General IHC practice: identify the stained cells morphologically, compare a no-primary control, and check the blocking and detection controls appropriate to the detection system.
The whole section has diffuse color.Background obscures the reported cytoplasmic, cell-specific pattern (HPA tissue IHC: cytoplasmic profile). General IHC practice: nonspecific reagent binding or residual detection activity can produce diffuse staining.General IHC practice: inspect a no-primary control, review blocking and wash steps, and shorten or adjust detection according to the established workflow.
Different positive tissues show different fractions of stained cells.HPA reports staining by named cell populations and assigns the tissue IHC profile Supported reliability with medium staining–RNA consistency (HPA tissue IHC). Tissue-wide uniformity is therefore an unsuitable scoring assumption.Score comparable cell populations separately. Document compartment, intensity, and the fraction of identifiable target cells; compare each with its own HPA entry (HPA tissue IHC).
An IF/ICC image appears cytosolic, but the IHC section looks discordant.The cytosolic IF observation supports localisation, while HPA's IHC and ICC validation statuses are application-specific (HPA subcellular: Cytosol, enhanced; HPA antibodies).Use the IF image as a localisation cross-check. For the paraffin section, reassess the named tissue cell population, the IHC antibody's validation status, and the staining controls (HPA tissue IHC; HPA antibodies).

Sample controls for RANBP1 IHC & IF

🧪Run appendix first: enterocytes should stain strongly (HPA: High in appendix enterocytes). Use adipose tissue as the negative comparator, scoring adipocytes rather than the whole section (HPA: Not detected in adipocytes); on the appendix slide, cells without specific staining should show only background chromogen, but the supplied HPA row does not identify a negative cell type there.
Positive control tissue: Appendix (Enterocytes, HPA High)
Negative control tissue: Adipose tissue (HPA Not detected)
ICC-IF cell lines (HPA subcellular resource): HPA ICC-IF images show RANBP1 in HEK293, Rh30, U2OS, RPTEC/TERT1, hTERT-RPE1 (serum starved), with annotated localisation: Cytosol (enhanced) (HPA subcellular).
Technical controls: Include a no-primary, secondary-only control and a rabbit IgG isotype control matched to the primary antibody’s clonality when known (caption: rabbit primary and goat anti-rabbit secondary). Confirm specificity with RANBP1 knockout material or an immunizing-peptide block when available; check endogenous peroxidase and biotin before interpreting appendix staining (caption: SABC/DAB detection).
⚠️Feasibility: A target-specific fixation window and fixation effect are unreported, and the exact A04000-2 tissue-IHC caption does not state a fixative. That caption reports heat retrieval in citrate buffer at pH 6 for 20 minutes, but one staining example does not establish that retrieval is required (A04000-2 tissue-IHC caption). The supplied evidence does not establish whether frozen sections or IF are easier; for IF/ICC, cytosolic staining is the reference pattern (HPA: enhanced cytosol), while appendix DAB interpretation requires attention to endogenous peroxidase and biotin (caption: SABC/DAB detection).

HPA tissue IHC evidence for RANBP1

Comprehensive Human Protein Atlas IHC scoring per tissue (reliability: Supported — Medium consistency between antibody staining and RNA expression data.). Rows are taken directly from the HPA tissue chart — click any row's HPA link to view the source.

Positive expression · recommended positive controls

TissueCell typeLevelEvidenceSource
Appendix Enterocytes High Protein (IHC) HPA →
Breast Glandular cells High Protein (IHC) HPA →
Colon Endocrine cells High Protein (IHC) HPA →
Duodenum Endocrine cells High Protein (IHC) HPA →
Endometrium Glandular cells High Protein (IHC) HPA →

Undetected expression · recommended negative controls

TissueCell typeLevelEvidenceSource
Adipose tissue Adipocytes Not detected Protein (IHC) HPA →
Caudate Glial cells Not detected Protein (IHC) HPA →
Cerebellum Cells in granular layer Not detected Protein (IHC) HPA →
Cerebral cortex Endothelial cells Not detected Protein (IHC) HPA →
Gallbladder Glandular cells Not detected Protein (IHC) HPA →
Section 3

Advanced RANBP1 IHC Tips

Use the catalog antibody’s paraffin-section conditions and the reported cytosolic staining pattern to troubleshoot RANBP1 IHC (datasheet A04000-2; HPA).

How should I adjust retrieval when RANBP1 staining is weak?
Start with heat-mediated antigen retrieval in citrate buffer at pH 6 for 20 minutes (datasheet A04000-2). Keep section thickness, heating, and cooling consistent across the comparison slides so a change in signal can be attributed to the retrieval adjustment (standard IHC practice). If staining remains weak, compare a modest change in heating time on adjacent sections before testing another buffer as a fallback (standard IHC practice). Use the same antibody concentration and detection conditions during that comparison: the selected paraffin-section example used 1 μg/ml overnight at 4°C (datasheet A04000-2).
Could fixation explain weak or uneven RANBP1 staining?
Target-specific fixation sensitivity is unknown: the selected paraffin-section caption does not identify its fixative (datasheet A04000-2). Record the fixative and fixation duration for each specimen, then compare sections processed together before changing antibody concentration (standard IHC practice). If fixation histories differ, test retrieval and staining on adjacent sections from each block while keeping detection and development conditions constant (standard IHC practice). Document whether weak staining follows a processing batch or a particular cell population, and assess section integrity before assigning the difference to RANBP1 abundance (standard IHC practice).
Where should convincing RANBP1 signal appear in a paraffin section?
Expect predominantly cytoplasmic staining when assessing tissue sections, consistent with the reported tissue profile and enhanced cytosolic location in cell imaging (HPA: tissue IHC profile; HPA: subcellular). Compare signal within morphologically identified cells; appendix enterocytes and small-intestinal endocrine cells are reported as high, while adipocytes are reported as not detected (HPA: tissue IHC). Score those populations separately so abundant negative cells do not dilute a positive population’s result (standard IHC practice). Predominantly nuclear or extracellular DAB should prompt checks of morphology, background, and controls before being called RANBP1 staining (HPA: subcellular; standard IHC practice).
Could epitope choice explain discordant RANBP1 IHC results?
RANBP1 has 2 recorded isoforms and a Ran-binding domain spanning residues 26–164 (UniProt P43487). Its record also lists modified residues, including phosphorylation at positions 13, 18, 21, and 60 (UniProt P43487). Because the selected caption does not specify the recognized epitope, its isoform coverage and sensitivity to those modifications cannot be inferred from that image (datasheet A04000-2). If antibodies disagree, compare their documented immunogens or epitopes, then evaluate matched serial sections with the same citrate pH 6 retrieval and cell-level scoring (datasheet A04000-2; standard IHC practice).
How can IF help investigate an ambiguous chromogenic RANBP1 pattern?
Use IF on a separate matched specimen to examine cytosolic distribution; the listed cell images place RANBP1 in the cytosol (HPA: subcellular). Pair the RANBP1 channel with a validated marker for the expected cell type, such as enterocytes when examining appendix, and inspect both channels before interpreting overlap (HPA: appendix enterocytes; standard IF practice). Choose a far-red fluorophore if the specimen shows strong shorter-wavelength autofluorescence, and include single-channel controls for bleed-through (standard IF practice). Because RANBP1 has no transmembrane segment, use a mild cytosol-accessing permeabilisation condition, such as 0.1% Triton X-100 in PBS, and optimise it for the fixation used (UniProt P43487 topology; standard IF practice).
What should I check when DAB obscures cytoplasmic RANBP1?
The selected paraffin-section example used 10% goat serum blocking, 1 μg/ml primary antibody overnight at 4°C, a biotinylated secondary, and DAB development (datasheet A04000-2). If diffuse color obscures cells, compare a no-primary control and shorten chromogen development while keeping sections from the same run together (standard IHC practice). Check peroxidase blocking and possible endogenous biotin signal because the illustrated detection used a biotin-based complex with DAB (datasheet A04000-2; standard IHC practice). Reassess washes, secondary-antibody specificity, and the primary concentration before interpreting residual diffuse color as cytoplasmic RANBP1 (standard IHC practice).
How should I score heterogeneous RANBP1 staining across tissue? ⚠ ANSWER MARKED FOR VERIFICATION
Define the cell population and viable tissue area before scoring, because reported high staining is cell-specific, including appendix enterocytes and small-intestinal endocrine cells (HPA: tissue IHC). For a consistent chromogenic assay, record the percentage of positive cells and staining intensity, or calculate an H-score from intensity-weighted percentages on a 0–300 scale (standard IHC practice). Normalise cell counts to the number of eligible cells, or express positive-cell density per mm² of viable tissue (standard IHC practice). Apply the same positivity threshold, counterstain, and DAB development conditions across slides, and report each cell population separately (standard IHC practice).
How do I distinguish true RANBP1 staining from artefact?
Give greatest weight to reproducible cytoplasmic signal in morphologically intact cells, since tissue IHC reports cytoplasmic expression and cell imaging places RANBP1 in the cytosol (HPA: tissue IHC; HPA: subcellular). Compare expected high populations, such as appendix enterocytes, with reported undetected populations such as adipocytes, while recognizing that HPA rates tissue staining as supported with medium RNA agreement (HPA: tissue IHC). Treat staining concentrated at section edges or in necrotic areas as suspect and inspect matched controls (standard IHC practice). Predominantly nuclear staining, or DAB persisting in a no-primary control, warrants checks for nonspecific binding and endogenous enzyme activity before assigning a RANBP1 result (HPA: subcellular; standard IHC practice).
Boster reagents

Best RANBP1 / Ran-specific GTPase-activating protein IHC Antibodies

Validated RANBP1 antibodies have IHC data from human, mouse and rat paraffin sections and IF data from human cells (catalog figure captions).

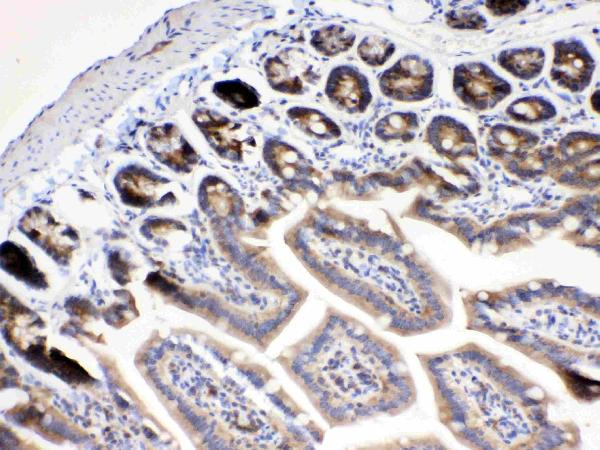
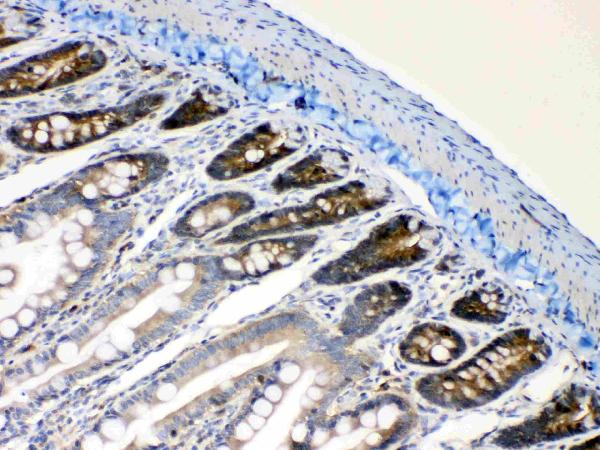
Real IHC data IHC analysis of RanBP1 using anti-RanBP1 antibody (A04000-2). RanBP1 was detected in paraffin-embedded section of mouse intestine tissues. Heat mediated antigen retrieval was performed in citrate buffer (pH6, epitope retrieval solution) for 20 mins. The tissue section was blocked with 10% goat serum. The tissue section was then incubated with 1μg/ml rabbit anti-RanBP1 Antibody (A04000-2) overnight at 4°C. Biotinylated goat anti-rabbit IgG was used as secondary antibody and incubated for 30 minutes at 37°C. The tissue section was developed using Strepavidin-Biotin-Complex (SABC)(Catalog # SA1022) with DAB as the chromogen.
Anti-RanBP1 Antibody ®
Cat # A04000-2
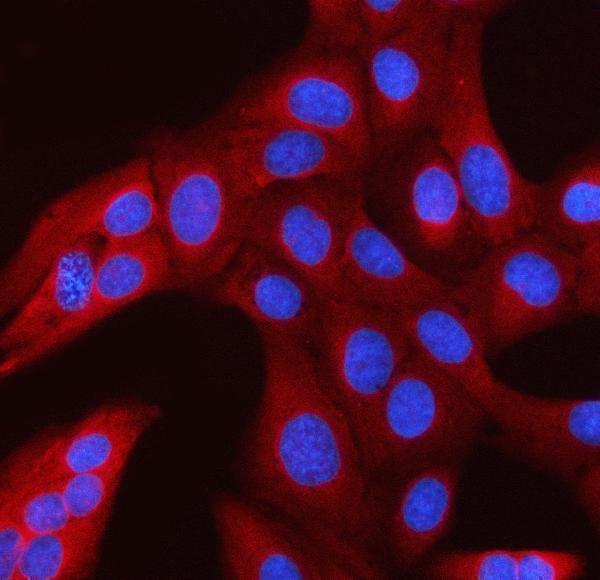
Real IF data IF analysis of RANBP1 using anti-RANBP1 antibody (A04000-3). RANBP1 was detected in an immunocytochemical section of U2OS cells. Enzyme antigen retrieval was performed using IHC enzyme antigen retrieval reagent (AR0022) for 15 mins. The cells were blocked with 10% goat serum. And then incubated with 5 μg/mL rabbit anti-RANBP1 Antibody (A04000-3) overnight at 4°C. Cy3 Conjugated Goat Anti-Rabbit IgG (BA1032) was used as secondary antibody at 1:500 dilution and incubated for 30 minutes at 37°C. The section was counterstained with DAPI. Visualize using a fluorescence microscope and filter sets appropriate for the label used.
Anti-RANBP1 Antibody ®
Cat # A04000-3

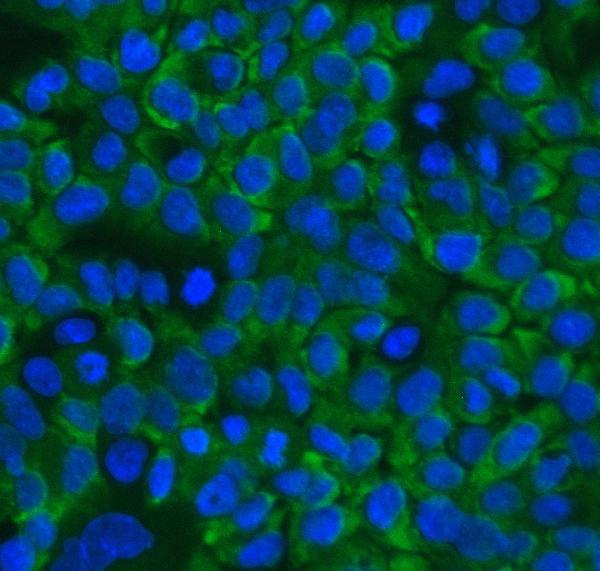
A04000-2 will render with mouse intestine IHC data; its catalog also shows rat intestine, human intestinal cancer and human lung cancer IHC, plus A431 cell IF (A04000-2 figure captions). A04000-3 will render with U2OS cell IF data and has no listed IHC application or IHC figure (A04000-3 applications and figure captions).

Which to pick: Choose A04000-2 for paraffin-section IHC: its caption documents citrate retrieval at pH 6 for 20 minutes and primary antibody at 1 μg/ml; the fixative is unreported (A04000-2 IHC figure caption). For human-cell IF/ICC, either SKU has a cell IF figure; A04000-2 is listed at 2 μg/ml and A04000-3 at 5 μg/ml (catalog IF dilutions; IF figure captions). Choose A04000-2 for human, mouse or rat work because all three species are listed for it, whereas A04000-3 lists human only; A04000-3 is identified as polyclonal, while clonality is unreported for A04000-2 (catalog reactivity and antibody details).

Each figure is that product's own IHC / IF validation image from its datasheet.

References

  1. UniProt Consortium. UniProt entry P43487 (RANG_HUMAN, Ran-specific GTPase-activating protein).
  2. Human Protein Atlas. RANBP1 tissue IHC expression (reliability: Supported).
  3. Human Protein Atlas. RANBP1 subcellular location (ICC-IF): Localized to the cytosol..
  4. Human Protein Atlas. RANBP1 antibody validation summary (2 antibodies).
  5. Increased cathepsin D protein expression is a biomarker for osteosarcomas, pulmonary metastases and other bone malignancies. Oncotarget 2015 — PMC4599286.
  6. RANBP1 promotes oral cancer progression through activating YAP1 and NDUFB3 derived from the database of single-cell sequencing. Cancer cell international 2026 — PMC13480108.
  7. RANBP1 promotes immune evasion in triple-negative breast cancer by suppressing T cell infiltration via the miR-769-5p/PRUNE2 axis. Discover oncology 2025 — PMC12586255.
  8. RAN nucleo-cytoplasmic transport and mitotic spindle assembly partners XPO7 and TPX2 are new prognostic biomarkers in serous epithelial ovarian cancer. PloS one 2014 — PMC3953127.
  9. PubMed PMID:7882974 — UniProt-cited evidence.
  10. PubMed PMID:7616957 — UniProt-cited evidence.
  11. PubMed PMID:15461802 — UniProt-cited evidence.