This website uses cookies to ensure you get the best experience on our website.


- Table of Contents
Plan RHOT1 chromogenic IHC around granular cytoplasmic tissue staining (HPA tissue IHC) and its outer mitochondrial membrane location (UniProt). The catalog antibody has a human paraffin-section starting range of 2–5 μg/mL (datasheet: A05928-1).

Expected localisation, validated protocols, controls and antibodies — the at-a-glance facts below, then the full design guide.
| Expected localisation | Observed granular cytoplasm (HPA tissue IHC); outer mitochondrial membrane (UniProt) | |
| Staining pattern | Granular cytoplasmic staining across diverse cell types (HPA tissue IHC) | |
| Antigen retrieval | EDTA pH 8.0 HIER, heat-mediated (datasheet A05928-1) | |
| Positive control | Adrenal gland+4 more · see all | |
| Negative control | None in HPA (detected in all 45 tissues); use no-primary + isotype controls |
| Fixation | Keep fixation consistent across sections (standard IHC practice; not target-specific) | |
| Caveat | Broad expression can complicate cell-specific scoring (HPA tissue IHC) | |
| Regulation | No stimulus-linked regulator specified (UniProt) | |
| Isoform / epitope | 7 isoforms; epitope differences unspecified (UniProt) |
Compare the catalog antibody’s IHC-P protocol (datasheet A05928-1) with published RHOT1 tissue IHC methods (PMC8973856; PMC3409151).
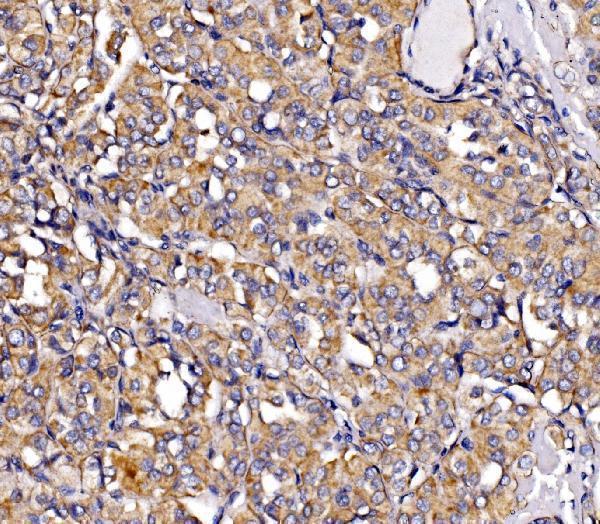
| Sample | Paraffin-embedded human thyroid papillary carcinoma tissue; fixative not specified (datasheet A05928-1) |
| Fixation | Image fixative and duration unreported (datasheet A05928-1); verify before use. |
| Sectioning | 4–5 µm sections on charged slides (standard) |
| Deparaffinisation | Xylene, graded ethanol series to water (standard) |
| Antigen retrieval | Heat retrieval: EDTA pH 8.0 (datasheet A05928-1); 20 min, 95–100 °C (standard) |
| Peroxidase block | 3% H2O2, 10 min, room temperature (standard) |
| Blocking | 10% goat serum (datasheet A05928-1) |
| Primary antibody | Rabbit anti-RHOT1, 2-5 μg/ml (datasheet A05928-1) |
| Primary incubation | Overnight at 4 °C (datasheet A05928-1) |
| Detection | Streptavidin-biotin complex (SABC), DAB chromogen (datasheet A05928-1) |
| Counterstain | Hematoxylin, blue, dehydrate and mount (standard) |
| Expected result | RHOT1-positive staining in glandular cells of adrenal gland (HPA tissue IHC: High). HPA tissue profile: General cytoplasmic expression with a granular pattern. No signal in the no-primary control. |
RHOT1 is an outer mitochondrial membrane protein with a cytoplasmic domain spanning residues 1–592 (UniProt Q8IXI2 topology). In paraffin sections, expect granular cytoplasmic staining, including in the glandular and epithelial cells reported as highly stained by HPA (HPA: tissue IHC). HPA rates the tissue pattern Supported, based on consistency between antibody staining and RNA expression (HPA: reliability).
| Granular cytoplasmic signal in adrenal glandular cells or bronchial respiratory epithelial cells. | This matches the reported RHOT1 tissue pattern and High staining in these cells (HPA: tissue IHC). Its cytoplasmic appearance is consistent with an outer mitochondrial membrane protein (UniProt Q8IXI2: subcellular location and topology). Assess the cell type and pattern together; color alone does not establish specificity (general IHC practice). |
| Predominantly nuclear staining, with little granular cytoplasmic signal. | A nuclear dominant pattern conflicts with HPA’s general granular cytoplasmic profile and UniProt’s outer mitochondrial membrane assignment (HPA: tissue IHC; UniProt Q8IXI2: subcellular location). Treat it as a possible artifact and check controls and the detection workflow before interpreting it as RHOT1 (general IHC practice). |
| Strong staining in a cell population outside the expected pattern for that section. | Check the cell identity against the relevant HPA tissue image before calling the signal specific (HPA: tissue IHC). Unexpected staining can reflect cross-reactivity or endogenous detection activity (general IHC practice), but RHOT1 is broadly expressed (UniProt Q8IXI2: tissue specificity); staining in an additional cell type alone does not prove an artifact. |
| Uniform haze across tissue structures or a broadly colored slide background. | HPA describes a granular cytoplasmic pattern, so uniform haze is a poor match (HPA: tissue IHC). It can arise from nonspecific antibody binding, insufficient washing, or detection background (general IHC practice). Compare the haze with a negative reagent control before scoring faint cytoplasmic color as RHOT1 (general IHC practice). |
| No visible staining in adrenal glandular cells or bronchial respiratory epithelial cells. | Both are reported as High staining populations, making absence of signal a reason to investigate the run (HPA: tissue IHC). Check tissue preservation, retrieval, antibody application, and detection controls using the chosen assay’s instructions (general IHC practice). HPA’s tissue data do not identify which step caused the failure. |
| Which tissue and cells anchor interpretation? | Use an HPA High population, such as breast glandular cells, caudate neuronal cells, or cervix squamous epithelial cells, as a pattern reference (HPA: tissue IHC). HPA lists no negative or low examples in the supplied record, so it does not support designating a particular tissue as RHOT1 negative. |
| Topology and antibody epitope | RHOT1 has one transmembrane segment at 593–615, a cytoplasmic region at 1–592, and a short intermembrane region at 616–618 (UniProt Q8IXI2: topology). Epitope position could matter when assessing staining, but no epitope for the antibody used here is supplied; do not infer its accessibility or a retrieval requirement. |
| Isoforms and antibody validation | UniProt lists 7 RHOT1 isoforms (UniProt Q8IXI2: isoforms). Their recognition by a particular antibody is unspecified. HPA lists IHC as Supported for HPA010687, CAB068223, and CAB068224 (HPA: antibodies); that status does not establish identical isoform coverage or staining behavior for every antibody. |
| Endogenous detection activity | In chromogenic IHC, endogenous enzyme activity or tissue pigment may resemble weak signal, depending on the detection system (general IHC practice). Interpret questionable color against the appropriate detection controls and cellular pattern (general IHC practice). The supplied HPA and UniProt records do not identify a RHOT1 specific endogenous detection effect. |
| IF/ICC: what pattern is established? | HPA’s subcellular summary says “Membrane,” but gives no main location or ICC/IF image bearing cell lines; the listed antibodies have no ICC status in this payload (HPA: subcellular; HPA: antibodies). UniProt assigns RHOT1 to the outer mitochondrial membrane (UniProt Q8IXI2: subcellular location). These records do not establish an antibody validated IF/ICC staining pattern. |
| Situation | Likely cause | Next action |
|---|---|---|
| The known High cell population is blank. | The run may have failed at staining or detection; HPA does not identify a target specific failure mechanism (HPA: tissue IHC). | Verify section identity and positive control, then review retrieval, primary antibody application, and detection according to the assay instructions (general IHC practice). |
| Color is chiefly nuclear. | This conflicts with the reported granular cytoplasmic pattern and mitochondrial location (HPA: tissue IHC; UniProt Q8IXI2: subcellular location). | Check a negative reagent control, counterstain, and detection background before scoring the color as RHOT1 (general IHC practice). |
| Signal is diffuse rather than granular. | Diffuse color does not match HPA’s general granular cytoplasmic profile (HPA: tissue IHC); nonspecific binding or excess background is possible (general IHC practice). | Compare the negative reagent control and review blocking, antibody concentration, washing, and chromogen development (general IHC practice). |
| Unexpected cells stain strongly. | Cross-reactivity or endogenous detection activity is possible (general IHC practice), although RHOT1 is broadly expressed (UniProt Q8IXI2: tissue specificity). | Identify the cell population, compare its HPA tissue pattern, and check detection controls before assigning specificity (HPA: tissue IHC; general IHC practice). |
| Two antibodies give different patterns. | The listed antibodies are IHC Supported, but their epitopes and isoform coverage are unspecified here (HPA: antibodies; UniProt Q8IXI2: isoforms). | Compare staining in the same HPA reported cell population and review each antibody’s documented assay conditions; do not assume matching epitopes (HPA: tissue IHC; general IHC practice). |
| IF/ICC fluorescence differs from the IHC pattern. | HPA supplies a membrane summary but no ICC/IF images or ICC validation status for the listed antibodies (HPA: subcellular; HPA: antibodies). | Treat the fluorescence pattern as unestablished by these sources; assess it with appropriate imaging controls and the separate IF/ICC guide (general IF practice). |


Comprehensive Human Protein Atlas IHC scoring per tissue (reliability: Supported — High consistency between antibody staining and RNA expression data.). Rows are taken directly from the HPA tissue chart — click any row's HPA link to view the source.
| Tissue | Cell type | Level | Evidence | Source |
|---|---|---|---|---|
| Adrenal gland | Glandular cells | High | Protein (IHC) | HPA → |
| Appendix | Glandular cells | High | Protein (IHC) | HPA → |
| Breast | Glandular cells | High | Protein (IHC) | HPA → |
| Bronchus | Respiratory epithelial cells | High | Protein (IHC) | HPA → |
| Caudate | Neuronal cells | High | Protein (IHC) | HPA → |
| Tissue | Cell type | Level | Evidence | Source |
|---|---|---|---|---|
| None in HPA: RHOT1 is detected in all 45 scored tissues. Use a no-primary (secondary-only) and an isotype control instead. | ||||
Troubleshoot RHOT1 staining by checking retrieval, compartment, controls, and scoring against the evidence available for paraffin section IHC.
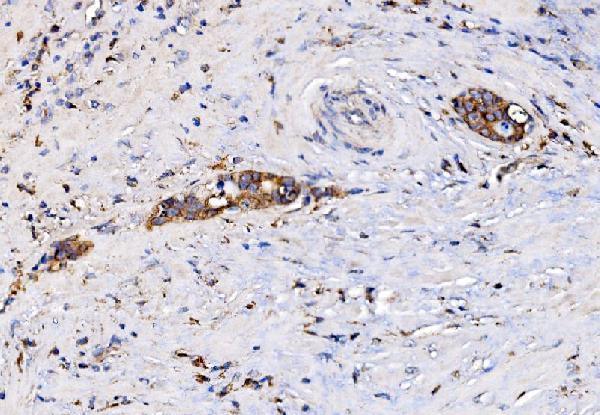
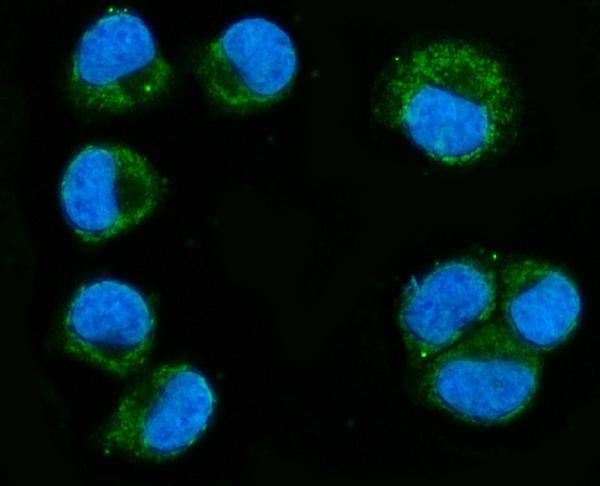
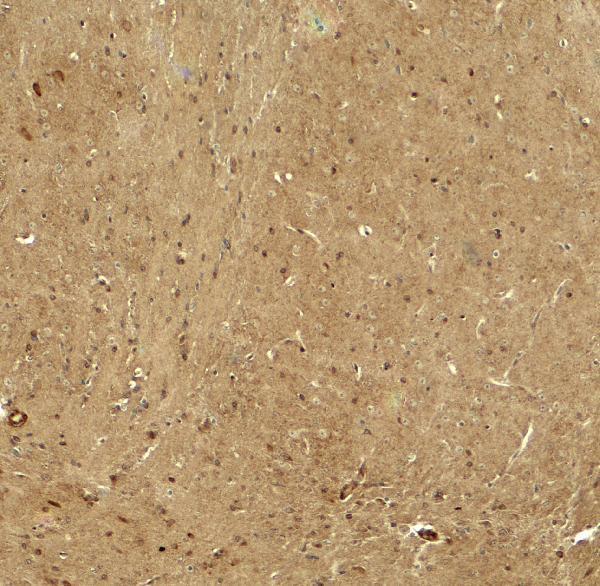
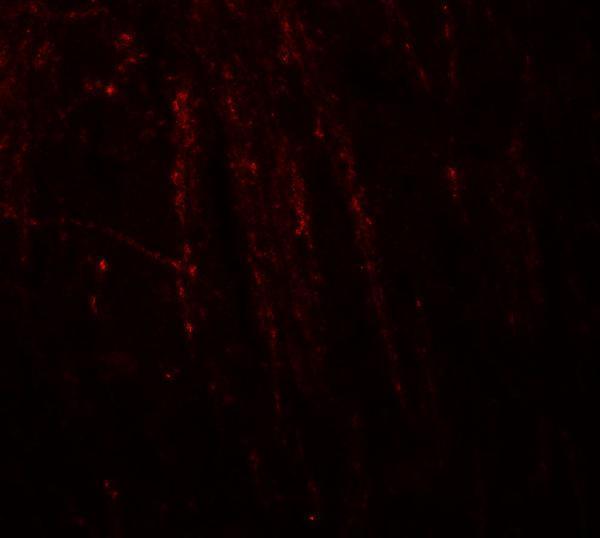
Two anti-RHOT1 antibodies have real IHC images from human paraffin sections and mouse brain, plus IF images from T47D cells and mouse brain (catalog image captions).
A05928-1 has IHC images from human paraffin sections and an IF/ICC image from T47D cells (A05928-1 image captions). A05928 has IHC and IF images from mouse brain (A05928 image captions).
Which to pick: For human paraffin-section IHC, choose A05928-1; its thyroid papillary carcinoma image used EDTA retrieval at pH 8.0 and 2 μg/ml antibody, with the fixative unreported (A05928-1 IHC caption). For IF/ICC, A05928-1 has a T47D-cell image at 5 μg/mL; A05928 has a mouse-brain IF image at 20 μg/mL (respective IF captions). For mouse tissue IHC, A05928 has a mouse-brain image at 5 μg/mL, with processing and fixative unreported; both antibodies list Human, Mouse, and Rat reactivity, but their images document only the stated samples, and neither has a specified clone (A05928 IHC caption; catalog reactivity and clone fields).