This website uses cookies to ensure you get the best experience on our website.


- Table of Contents
Plan paraffin-section SELENBP1 IHC with the catalog antibody at 2–5 μg/mL (datasheet A04444-3). Score cytoplasmic staining and note occasional nuclear signal; liver hepatocytes are a high-staining reference, while adrenal glandular cells are not detected (HPA tissue IHC).

Expected localisation, validated protocols, controls and antibodies — the at-a-glance facts below, then the full design guide.
| Expected localisation | Predominantly cytoplasmic; nuclear in some cases (HPA tissue IHC) | |
| Staining pattern | Cytoplasmic in glandular cells and hepatocytes; sometimes nuclear (HPA tissue IHC) | |
| Antigen retrieval | EDTA pH 8.0 HIER, heat-mediated (datasheet A04444-3) | |
| Positive control | Colon+4 more · see all | |
| Negative control | Adrenal gland+4 more · see all |
| Fixation | Keep fixation consistent across paraffin sections. (standard IHC practice; not target-specific) | |
| Caveat | Lung, colorectal and ovarian tumors may stain less (UniProt) | |
| Regulation | Down in lung/colorectal/ovarian cancer (UniProt) | |
| Isoform / epitope | 4 isoforms; epitope impact is undetermined (UniProt) |
The catalog antibody specifies EDTA pH 8.0 retrieval (datasheet: A04444-3). Published IHC protocols below cover human and mouse tissues, head and neck cancer, and colorectal cancer (PMC5828193; PMC5008557; PMC9438969).
| Sample | Paraffin-embedded human spleen tissue; fixative not specified (datasheet A04444-3) |
| Fixation | Image fixative and duration unreported (datasheet A04444-3); verify before use. |
| Sectioning | 4–5 µm sections on charged slides (standard) |
| Deparaffinisation | Xylene, graded ethanol series to water (standard) |
| Antigen retrieval | Heat retrieval: EDTA pH 8.0 (datasheet A04444-3); 20 min, 95–100 °C (standard) |
| Peroxidase block | 3% H2O2, 10 min, room temperature (standard) |
| Blocking | 10% goat serum (datasheet A04444-3) |
| Primary antibody | Rabbit anti-SELENBP1, 2-5 μg/ml (datasheet A04444-3) |
| Primary incubation | Overnight at 4 °C (datasheet A04444-3) |
| Detection | HRP-conjugated secondary, DAB chromogen (datasheet A04444-3) |
| Counterstain | Hematoxylin, blue, dehydrate and mount (standard) |
| Expected result | SELENBP1-positive staining in endocrine cells of colon (HPA tissue IHC: High). HPA tissue profile: Cytoplasmic expression with high levels in most glandular epithelia and in hepatocytes. Nuclear expression in several cases. No signal in the no-primary control. |
In paraffin-section IHC, expect predominantly cytoplasmic SELENBP1 staining in glandular epithelia and hepatocytes, with nuclear staining in some cases (HPA: tissue IHC, Enhanced reliability). High staining is documented in liver hepatocytes, intestinal Paneth cells and lung alveolar type II cells (HPA: High). UniProt also places SELENBP1 in the cytosol and nucleus and reports no transmembrane segment (UniProt Q13228: subcellular location and topology).
| Strong cytoplasmic staining in hepatocytes, intestinal Paneth cells or lung alveolar type II cells. | This matches documented high staining in those cells (HPA: High). Compare the signal with nearby structures on the same section: a cell-specific cytoplasmic pattern is more persuasive than a uniformly colored field (general IHC practice). |
| Signal appears only as a sharp membrane rim, or only in a compartment inconsistent with the tissue pattern. | Recheck interpretation and staining specificity. UniProt reports cytosolic and nuclear localization with no transmembrane segment (UniProt Q13228: location and topology); HPA tissue IHC chiefly shows cytoplasm, with nuclear staining in several cases (HPA: tissue IHC). A nuclear signal alone is therefore not automatically an artefact. |
| The strongest color is in an unexpected cell population rather than the documented positive cells. | Consider cross-reactivity or detection background before calling it SELENBP1 (general IHC practice). Check cell identity against the section morphology and HPA's cell-level observations; HPA reports high staining in hepatocytes and intestinal Paneth cells, while some other cell populations are not detected (HPA: tissue IHC). |
| Pale, diffuse color covers positive cells, negative cells and surrounding tissue. | A field-wide haze cannot establish cell-level SELENBP1 expression (general IHC practice). The HPA pattern is predominantly cytoplasmic and varies among cell populations (HPA: tissue IHC); assess background with the detection control and compare areas expected to stain differently. |
| No staining appears in an included liver hepatocyte or intestinal Paneth-cell control. | Treat the run as uninformative until the positive control works: both populations have high documented staining (HPA: High). Review control identity, antibody and detection setup, and section quality before interpreting a study specimen as negative (general IHC practice). |
| Tissue and cell selection | HPA records high staining in liver hepatocytes, duodenal and small-intestinal Paneth cells, and lung alveolar type II cells (HPA: High). It also records not-detected glandular cells in adrenal gland and cervix (HPA: Not detected). Choose controls by cell population, not tissue name alone. |
| Compartment used for scoring | Predominantly cytoplasmic staining, with nuclear expression in several cases, is the tissue-IHC reference (HPA: tissue IHC). Cytosolic and nuclear localization agrees with UniProt, which lists no transmembrane segment (UniProt Q13228: location and topology). Record compartments separately when scoring. |
| Antibody validation | HPA lists IHC validation as Enhanced for HPA005741, HPA011731 and CAB008366 (HPA: antibodies). That supports the reference tissue pattern; it does not establish that every antibody will give the same staining under every assay condition. |
| Isoform recognition | UniProt lists four SELENBP1 isoforms (UniProt Q13228: isoforms 1–4). The supplied record does not map antibody epitopes to isoforms, so a different pattern cannot be assigned to one isoform from these data alone. |
| IHC versus ICC-IF readout | HPA tissue IHC describes chiefly cytoplasmic staining with nuclear expression in some cases (HPA: tissue IHC), whereas HPA ICC-IF reports supported nucleolar localization (HPA: subcellular). Keep these assay-specific observations distinct when interpreting an image. |
| Situation | Likely cause | Next action |
|---|---|---|
| The study section is negative, and the positive control is also blank. | The assay may not have demonstrated detectable staining; high staining is expected in liver hepatocytes or intestinal Paneth cells (HPA: High). | Confirm the control contains the named cells, then check antibody application, detection reagents and counterstain balance before judging the study section (general IHC practice). |
| A purported negative control shows strong cell-specific staining. | The control may contain another expressing cell type, or the signal may be nonspecific. HPA's not-detected calls apply to named cells, such as adrenal glandular cells, rather than every cell in the tissue (HPA: Not detected). | Identify the stained cells morphologically; compare the exact cell population with HPA's annotation and review detection controls before rejecting the control (general IHC practice). |
| Color appears throughout the section without a clear cellular pattern. | Diffuse background can obscure the predominantly cytoplasmic reference pattern (HPA: tissue IHC); its cause cannot be assigned from the appearance alone. | Inspect the no-primary control, wash and blocking steps, and chromogen development as general IHC checks. Reassess the cells only after background is controlled. |
| Signal follows tissue edges, debris or many unrelated cells. | This distribution is less consistent with the cell-level HPA observations (HPA: tissue IHC) and may reflect nonspecific staining or detection activity (general IHC practice). | Review section morphology and the no-primary control. If using an enzyme-based chromogen, verify the relevant endogenous activity control before assigning SELENBP1 staining (general IHC practice). |
| The slide shows nuclear staining as well as cytoplasm. | Nuclear expression occurs in several tissue-IHC cases (HPA: tissue IHC), and UniProt lists nuclear localization (UniProt Q13228: subcellular location). | Score nuclear and cytoplasmic signal separately and compare their cell distribution with the positive control; do not discard a nuclear component solely because the dominant tissue pattern is cytoplasmic. |
| Does nucleolar staining in an IF or ICC image contradict the paraffin-section IHC result? | HPA reports supported nucleolar localization in ICC-IF (HPA: subcellular), while its tissue-IHC profile is chiefly cytoplasmic with nuclear staining in several cases (HPA: tissue IHC). | Interpret each image against its own assay reference and cell identity. Use the separate IF/ICC guide for that assay; the tissue-IHC observations alone cannot resolve an IF localization discrepancy. |
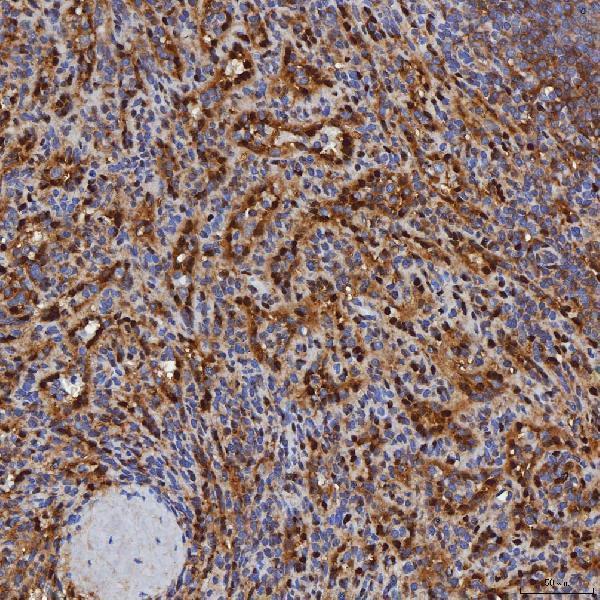
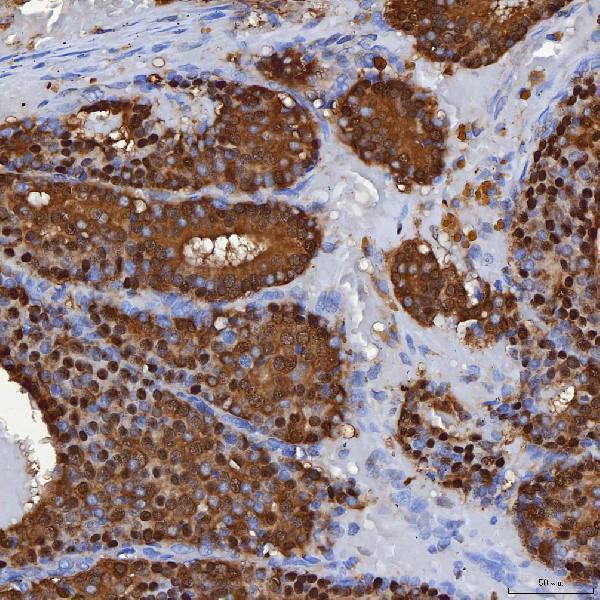
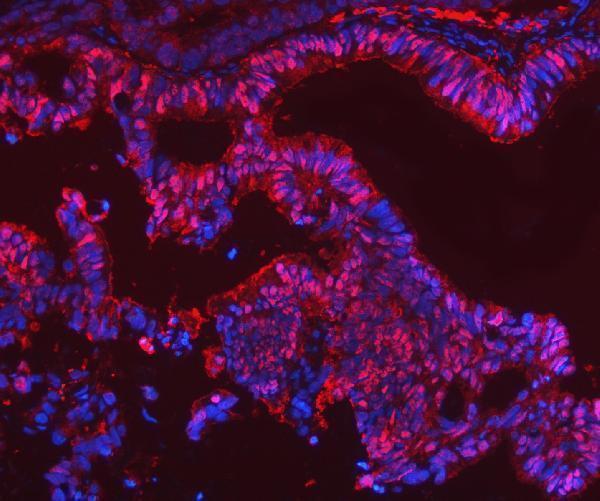
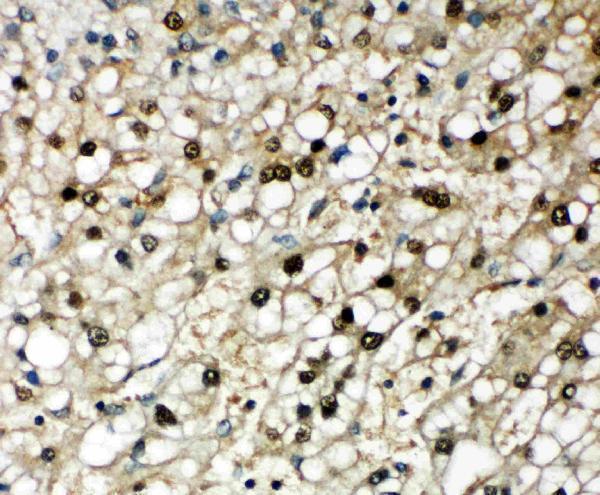

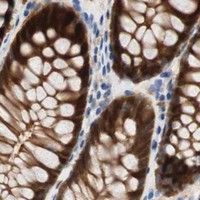
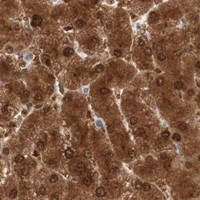


Comprehensive Human Protein Atlas IHC scoring per tissue (reliability: Enhanced — High consistency between antibody staining and RNA expression data.). Rows are taken directly from the HPA tissue chart — click any row's HPA link to view the source.
| Tissue | Cell type | Level | Evidence | Source |
|---|---|---|---|---|
| Colon | Endocrine cells | High | Protein (IHC) | HPA → |
| Duodenum | Paneth cells | High | Protein (IHC) | HPA → |
| Fallopian tube | Ciliated cells (cell body) | High | Protein (IHC) | HPA → |
| Liver | Hepatocytes | High | Protein (IHC) | HPA → |
| Lung | Alveolar cells type II | High | Protein (IHC) | HPA → |
| Tissue | Cell type | Level | Evidence | Source |
|---|---|---|---|---|
| Adrenal gland | Glandular cells | Not detected | Protein (IHC) | HPA → |
| Caudate | Glial cells | Not detected | Protein (IHC) | HPA → |
| Cerebellum | Cells in granular layer | Not detected | Protein (IHC) | HPA → |
| Cerebral cortex | Endothelial cells | Not detected | Protein (IHC) | HPA → |
| Cervix | Glandular cells | Not detected | Protein (IHC) | HPA → |
Troubleshoot SELENBP1 staining in paraffin section chromogenic IHC using the catalog antibody’s tissue example and reported expression patterns.
IHC-validated SELENBP1 antibodies have human tissue images; one also has human rectal cancer IF images and listed human, mouse and rat reactivity (catalog IHC/IF captions; catalog reactivity).
A04444-3 has IHC images from paraffin sections of human spleen, breast cancer, colon adenocarcinoma and prostate adenocarcinoma, plus an IF image from paraffin-section human rectal cancer (A04444-3 image captions). PA2216 has a human liver cancer IHC(P) image and lists human reactivity (PA2216 IHC caption; catalog reactivity).
Which to pick: For paraffin-section IHC, choose A04444-3 for its documented EDTA pH 8.0 retrieval and 2 μg/ml staining conditions, or PA2216 for its human liver cancer IHC image and listed 0.5–1 μg/ml range (A04444-3 IHC captions; PA2216 IHC caption and catalog dilution). For IF, choose A04444-3 at its listed 5 μg/ml; ICC validation is unreported (A04444-3 IF caption; catalog applications). For cross-species studies, A04444-3 lists human, mouse and rat reactivity, while its IHC-P dilution specifies human and rat; both antibodies have unreported clone type and section fixative (catalog reactivity, dilution and clone fields; catalog IHC captions).