This website uses cookies to ensure you get the best experience on our website.


- Table of Contents
Plan chromogenic SIGIRR IHC in paraffin sections using the catalog antibody’s IHC protocol. Compare cytoplasmic tissue staining with membrane topology, and interpret intensity cautiously because HPA reports low consistency between staining and RNA expression.

Expected localisation, validated protocols, controls and antibodies — the at-a-glance facts below, then the full design guide.
| Expected localisation | Cytoplasmic staining (HPA tissue IHC); membrane topology (UniProt) | |
| Staining pattern | Cytoplasmic staining in most tissues (HPA tissue IHC) | |
| Antigen retrieval | EDTA pH 8.0 HIER, heat-mediated (datasheet A03373-2) | |
| Positive control | Adrenal gland+4 more · see all | |
| Negative control | Caudate+4 more · see all |
| Fixation | Keep fixation consistent across sections (standard IHC practice; not target-specific). Selected-image fixative and duration unreported (datasheet A03373-2); verify before use. | |
| Caveat | Staining has low consistency with RNA expression (HPA tissue IHC) | |
| Regulation | Mainly epithelial expression; regulation unknown (UniProt) | |
| Isoform / epitope | 2 isoforms; map epitopes to extracellular or cytoplasmic regions (UniProt) |
The catalog antibody’s IHC-P protocol is paired with published chromogenic SIGIRR staining methods for prostate tissue microarrays (PMC4661098) and mouse lung sections (PMC8457575).
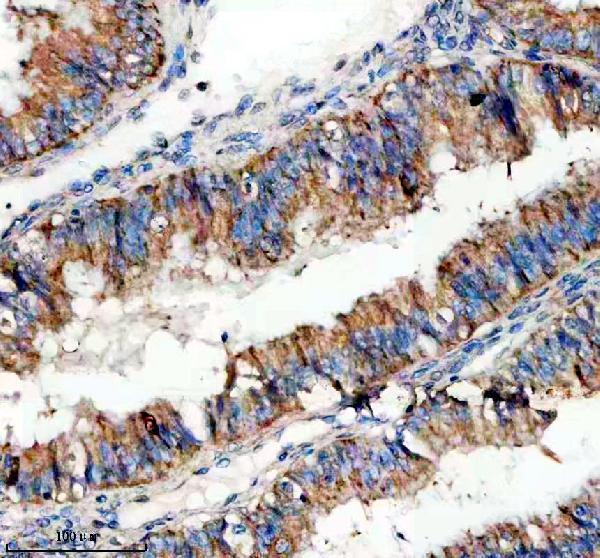
| Sample | Paraffin-embedded human endometrial cancer tissue; fixative not specified (datasheet A03373-2) |
| Fixation | Image fixative and duration unreported (datasheet A03373-2); verify before use. |
| Sectioning | 4–5 µm sections on charged slides (standard) |
| Deparaffinisation | Xylene, graded ethanol series to water (standard) |
| Antigen retrieval | Heat retrieval: EDTA pH 8.0 (datasheet A03373-2); 20 min, 95–100 °C (standard) |
| Peroxidase block | 3% H2O2, 10 min, room temperature (standard) |
| Blocking | 10% goat serum (datasheet A03373-2) |
| Primary antibody | Rabbit anti-SIGIRR, 2-5 μg/ml (datasheet A03373-2) |
| Primary incubation | Overnight at 4 °C (datasheet A03373-2) |
| Detection | HRP-conjugated secondary, DAB chromogen (datasheet A03373-2) |
| Counterstain | Hematoxylin, blue, dehydrate and mount (standard) |
| Expected result | SIGIRR-positive staining in glandular cells of adrenal gland (HPA tissue IHC: High). HPA tissue profile: Cytoplasmic expression in most tissues. No signal in the no-primary control. |
In paraffin IHC, expect mainly cytoplasmic staining in cells such as bronchial respiratory epithelium and colon glands (HPA tissue IHC). SIGIRR is a membrane protein with an extracellular region at residues 1–118, a transmembrane segment at 119–139, and a cytoplasmic region at 140–410 (UniProt Q6IA17 topology). Treat the pattern as a guide: HPA rates its tissue IHC Approved but reports low consistency between staining and RNA expression (HPA tissue IHC).
| Distinct cytoplasmic staining in bronchial respiratory epithelial cells or colon glandular cells, with little surrounding background (HPA tissue IHC). | This matches the reported IHC compartment and two High cell-specific observations (HPA tissue IHC). Record intensity by cell type; the HPA rating is Approved despite low staining–RNA consistency (HPA tissue IHC). |
| A mainly nuclear pattern replaces cytoplasmic staining in a paraffin section. | Recheck specificity and detection, because the reported tissue IHC pattern is cytoplasmic (HPA tissue IHC). Nucleoli fibrillar center staining has separate ICC-IF support and does not establish a nuclear IHC pattern (HPA subcellular ICC-IF). |
| Strong staining appears in cells expected to be undetected, such as esophageal squamous epithelium (HPA tissue IHC). | Consider cross-reactivity or endogenous detection activity before calling it SIGIRR. HPA reports Not detected specifically in esophageal squamous epithelial cells; that observation does not classify every cell in the section (HPA tissue IHC). |
| Diffuse colour covers cells, stroma, and empty spaces without a clear cellular pattern. | This is background rather than the described cytoplasmic cell pattern (HPA tissue IHC). Review blocking, washing, primary dilution, and detection controls as general IHC checks; the supplied sources do not identify a SIGIRR-specific cause. |
| No signal appears in bronchial respiratory epithelium or colon glands. | Those cell types are reported High in HPA tissue IHC. First verify that the expected cells are present and the staining run worked; HPA's low staining–RNA consistency limits how confidently one absent section can be interpreted (HPA tissue IHC). |
| Compartment and topology | HPA describes cytoplasmic staining in most tissues (HPA tissue IHC), while UniProt places SIGIRR at the membrane with residues 140–410 cytoplasmic (UniProt Q6IA17 topology). Interpret visible IHC against the observed HPA pattern; topology alone does not predict how sharply a membrane rim will stain. |
| Choice of comparison cells | Bronchial respiratory epithelium, colon glands, liver hepatocytes, and testis Leydig cells are each reported High (HPA tissue IHC). These are cell-specific reference observations, so compare the named population rather than scoring an entire organ as uniformly positive. |
| Low or undetected reference cells | Thyroid glandular cells and urinary bladder urothelial cells are reported Low; esophageal squamous epithelial cells and skeletal muscle myocytes are Not detected (HPA tissue IHC). A low reference is a weak comparator, and an undetected call applies to the listed cell type. |
| IHC evidence strength | The HPA tissue profile is Approved but notes low consistency with RNA expression; HPA023188 is IHC Approved, not listed as Enhanced (HPA tissue IHC; HPA antibodies). Use staining controls and tissue morphology when judging an unexpected result rather than treating the atlas pattern as definitive. |
| Isoforms and epitope position | UniProt lists 2 isoforms and extracellular, transmembrane, and cytoplasmic regions (UniProt Q6IA17). No epitope position or isoform coverage is supplied for the antibody, so the record cannot predict which isoform or region its IHC signal represents. |
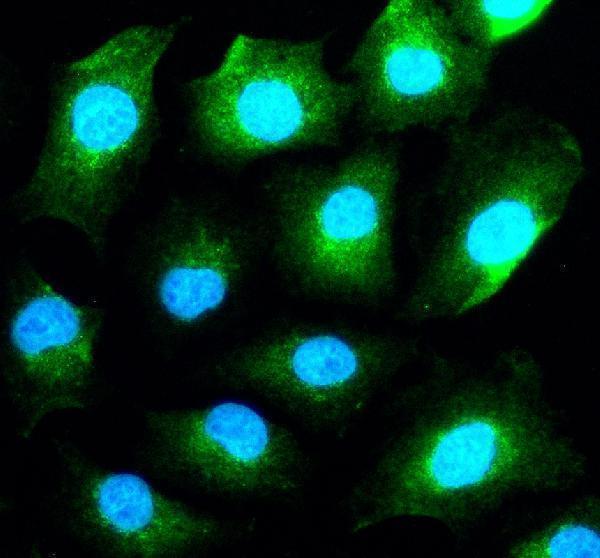
| IF/ICC: what location is reported? | HPA reports approved cytosol and nucleoli fibrillar center locations in ICC-IF, with images from A-431, U-251MG, and U2OS (HPA subcellular ICC-IF). Those observations answer the IF location question; assess paraffin IHC against the separate HPA tissue IHC pattern. |
| Situation | Likely cause | Next action |
|---|---|---|
| Known High bronchial or colon cells are blank (HPA tissue IHC). | The expected cell population may be absent from the field, or the staining run may have failed; one blank section does not identify the cause. | Confirm morphology, run a tissue positive control, and check primary antibody, detection, and counterstain steps using general IHC practice. Interpret against HPA's low staining–RNA consistency (HPA tissue IHC). |
| Signal is faint in thyroid glandular cells or bladder urothelial cells (HPA tissue IHC). | Both populations are reported Low (HPA tissue IHC), so weak signal can fit the reference observation. | Compare with a High reference cell population on a successful run (HPA tissue IHC); do not increase primary concentration solely because a Low population stains weakly. |
| Colour is widespread across tissue and noncellular spaces. | Nonspecific background or endogenous detection activity is possible under standard chromogenic IHC practice; the supplied sources do not assign a target-specific cause. | Inspect the no-primary control, blocking, washing, and detection chemistry. Adjust one general workflow variable at a time, then check whether cell-specific cytoplasmic contrast returns (HPA tissue IHC pattern). |
| Esophageal squamous epithelium stains strongly (HPA tissue IHC). | HPA lists that specific population as Not detected (HPA tissue IHC); cross-reactivity or endogenous detection activity is possible, but staining alone cannot distinguish them. | Compare a no-primary control with the primary-stained section and review cellular localisation. Report the unexpected cell-specific finding rather than assigning it to SIGIRR without support. |
| Only nuclei stain in paraffin IHC, with no convincing cytoplasmic signal. | The pattern differs from HPA's cytoplasmic tissue IHC profile (HPA tissue IHC). HPA's nucleoli fibrillar center result comes from ICC-IF (HPA subcellular ICC-IF). | Check negative controls and the expected positive cell population, then reassess compartment scoring. Keep the ICC-IF observation distinct from the paraffin IHC interpretation. |
| Two sections give different apparent positive-cell fractions. | The sampled cell populations may differ; HPA reports staining by named cell type and notes low consistency with RNA expression (HPA tissue IHC). | Score the same morphological cell population in each section, record intensity and proportion separately, and include the HPA evidence limitation when interpreting a discrepancy (HPA tissue IHC). |


Comprehensive Human Protein Atlas IHC scoring per tissue (reliability: Approved — Low consistency between antibody staining and RNA expression data.). Rows are taken directly from the HPA tissue chart — click any row's HPA link to view the source.
| Tissue | Cell type | Level | Evidence | Source |
|---|---|---|---|---|
| Adrenal gland | Glandular cells | High | Protein (IHC) | HPA → |
| Bronchus | Respiratory epithelial cells | High | Protein (IHC) | HPA → |
| Colon | Glandular cells | High | Protein (IHC) | HPA → |
| Gallbladder | Glandular cells | High | Protein (IHC) | HPA → |
| Liver | Hepatocytes | High | Protein (IHC) | HPA → |
| Tissue | Cell type | Level | Evidence | Source |
|---|---|---|---|---|
| Caudate | Glial cells | Not detected | Protein (IHC) | HPA → |
| Cerebellum | Cells in granular layer | Not detected | Protein (IHC) | HPA → |
| Esophagus | Squamous epithelial cells | Not detected | Protein (IHC) | HPA → |
| Oral mucosa | Squamous epithelial cells | Not detected | Protein (IHC) | HPA → |
| Ovary | Ovarian stroma cells | Not detected | Protein (IHC) | HPA → |
Troubleshoot SIGIRR staining in paraffin sections by checking retrieval, compartment, controls and cell-level scoring before interpreting chromogenic signal.
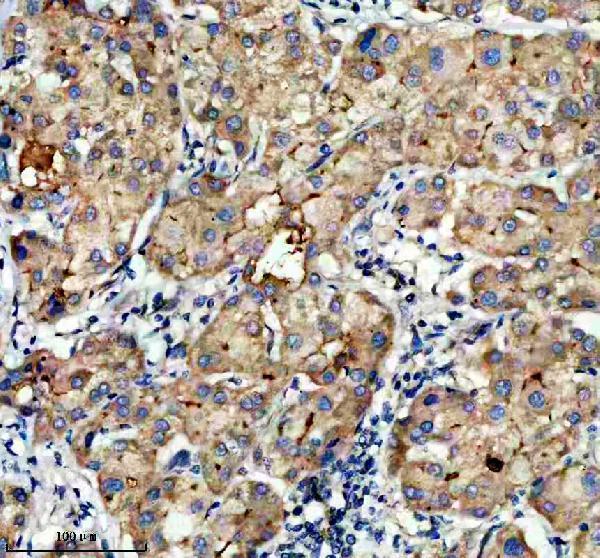
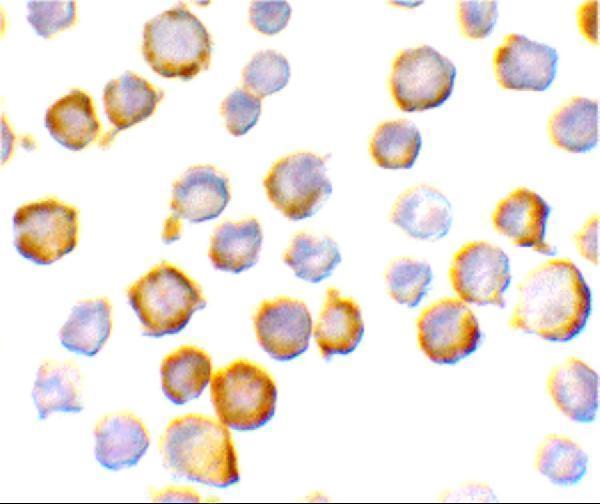
Anti-SIGIRR antibodies have IHC images from human paraffin sections and mouse kidney paraffin sections, plus IF/ICC images from human samples (catalog: A03373-2 image captions; A03373 ICC image caption).
A03373-2 is listed for IHC and IF in human, mouse and rat; its IHC images show human endometrial cancer, human liver cancer, human liver and mouse kidney paraffin sections (catalog: applications, reactivity and IHC image captions). A03373 is listed for ICC in human and mouse, with an ICC image from A549 cells (catalog: applications, reactivity and ICC image caption).
Which to pick: Choose A03373-2 for tissue IHC: its own IHC captions document paraffin sections with EDTA retrieval and 2 μg/ml primary antibody; the fixative is unreported (catalog: A03373-2 IHC image captions). For IF/ICC, A03373-2 lists both applications and has corresponding images, while A03373 lists ICC and has an A549 ICC image (catalog: application lists and image captions). For work spanning human, mouse and rat, A03373-2 lists all three as reactive, though its IHC images document human and mouse samples only (catalog: A03373-2 reactivity and IHC image captions).