SOCS1 / Suppressor of cytokine signaling 1 · IHC design guide

Design Immunohistochemistry for SOCS1

Plan chromogenic SOCS1 IHC in paraffin sections using the catalog antibody's 2–5 μg/ml range (datasheet A00448). Interpret nuclear and cytoplasmic staining in light of the reported low consistency between antibody staining and RNA expression (HPA tissue IHC).

Evidence assembled Oct 2026 · For research use; verify linked source records and product datasheet before use
Immunohistochemistry protocol sheet for SOCS1 (IHC for SOCS1): expected localisation Nuclear and cytoplasmic staining in most tissues (HPA tissue IHC), antibody A00448, validated IHC image, and IHC protocol steps
Printable SOCS1 IHC protocol sheet — expected localisation Nuclear and cytoplasmic staining in most tissues (HPA tissue IHC), antibody A00448, controls and protocol steps. Open the full SOCS1 IHC guide →

SOCS1 Immunohistochemistry Experimental Design Guide

Expected localisation, validated protocols, controls and antibodies — the at-a-glance facts below, then the full design guide.

Must know before staining
Expected localisation Nuclear and cytoplasmic staining in most tissues (HPA tissue IHC)
Staining pattern Most tissues show nuclear and cytoplasmic cellular signal (HPA tissue IHC)
Antigen retrieval EDTA pH 8.0 HIER, heat-mediated (datasheet A00448)
Positive control ⓘ Adrenal gland+4 more · see all
Negative control ⓘ Adipose tissue
Important caveats
Reasons your staining may differ from the expected pattern.
Fixation Keep fixation conditions consistent across sections. (standard IHC practice; not target-specific)
Caveat Antibody staining has low consistency with RNA expression (HPA tissue IHC)
Regulation STAT-induced expression (UniProt)
Isoform / epitope One listed chain; no isoforms reported (UniProt)
Section 1

Recommended SOCS1 IHC & IF Protocols

The catalog antibody’s IHC-P protocol is paired with 4 published SOCS1 IHC protocols (PMC13574448; PMC4694688; PMC10378037; PMC11764194).

Recommended immunohistochemistry (IHC-P) protocol parameters
SampleParaffin-embedded human liver cancer tissue; fixative not specified (datasheet A00448)
FixationImage fixative and duration unreported (datasheet A00448); verify before use.
Sectioning4–5 µm sections on charged slides (standard)
DeparaffinisationXylene, graded ethanol series to water (standard)
Antigen retrievalHeat retrieval: EDTA pH 8.0 (datasheet A00448); 20 min, 95–100 °C (standard)
Peroxidase block3% H2O2, 10 min, room temperature (standard)
Blocking10% goat serum (datasheet A00448)
Primary antibodyRabbit anti-SOCS1, 2-5 μg/ml (datasheet A00448)
Primary incubationOvernight at 4 °C (datasheet A00448)
DetectionHRP-conjugated secondary, DAB chromogen (datasheet A00448)
CounterstainHematoxylin, blue, dehydrate and mount (standard)
Expected resultSOCS1-positive staining in glandular cells of adrenal gland (HPA tissue IHC: Medium). HPA tissue profile: Nuclear and cytoplasmic expression in most tissues. No signal in the no-primary control.
💡Decision noteStart with heat-mediated EDTA retrieval at pH 8.0 (datasheet: A00448); the published excerpts do not specify retrieval conditions (PMC13574448; PMC4694688; PMC10378037; PMC11764194).
Section 2

What Is the Expected SOCS1 Staining Pattern?

SOCS1 staining is expected in nuclei and cytoplasm across many tissues (HPA tissue IHC: nuclear and cytoplasmic expression in most tissues). Medium staining is reported in bone marrow hematopoietic cells and several epithelial or glandular cell populations (HPA tissue IHC). SOCS1 has no transmembrane segment (UniProt O15524 topology). HPA rates its tissue IHC profile Approved but reports low consistency between antibody staining and RNA expression (HPA tissue IHC).

What am I looking at on my slide?
Nuclear staining with cytoplasmic staining in the expected cells.This fits the tissue IHC profile (HPA: nuclear and cytoplasmic expression in most tissues). Nucleoplasmic and vesicular localisation is also supported by ICC-IF (HPA subcellular); a chromogenic section need not resolve individual vesicles.
A sharply membrane-only rim dominates the signal.Treat this as a compartment mismatch and investigate an artefact: SOCS1 has no transmembrane segment (UniProt O15524 topology), while HPA reports nuclear and cytoplasmic tissue staining (HPA tissue IHC). Review the control slide and detection background before scoring it as positive.
Strong staining appears mainly in adipocytes.Adipocytes were not detected in the supplied tissue profile (HPA: adipose tissue, adipocytes). Cross-reactivity or endogenous detection activity is possible; assess a matched negative control and whether the signal follows the expected cellular compartments (general IHC practice).
Color spreads across cells, stroma and blank areas without clear cellular boundaries.This is diffuse background rather than a scoreable cellular pattern (general IHC practice). Check blocking, washing, chromogen development and the negative control; HPA's nuclear and cytoplasmic profile does not validate noncellular color (HPA tissue IHC).
No signal appears in a selected positive reference section.First verify that the section contains the reported cell population: HPA lists medium staining in bone marrow hematopoietic cells and duodenal glandular cells (HPA tissue IHC). Then inspect the IHC control and detection workflow (general IHC practice); a blank slide alone does not establish absent SOCS1.
💡Expected SOCS1 appearanceCall a section positive when identifiable cells show nuclear and cytoplasmic chromogen, with medium staining plausible in HPA-listed populations (HPA tissue IHC); isolated membrane rims, adipocyte-dominant color or diffuse noncellular deposits warrant control review (UniProt O15524 topology; HPA tissue IHC; general IHC practice).
How each factor affects the staining
Tissue and cell selectionHPA reports medium staining in bone marrow hematopoietic cells, bronchial respiratory epithelial cells and duodenal glandular cells, but no detected adipocyte staining (HPA tissue IHC). Select and score the named cells within each section; the tissue label alone does not identify the stained population.
Compartment and resolutionTissue IHC describes nuclear and cytoplasmic staining (HPA tissue IHC). Supported ICC-IF localisation is mainly nucleoplasmic, with additional vesicles (HPA subcellular); UniProt reports perinuclear cytoplasmic vesicles upon FGFR3 interaction (UniProt O15524 subcellular). Resolve the IHC pattern at the detail the section permits.
Evidence strengthThe tissue IHC profile is Approved but has low consistency with RNA expression (HPA tissue IHC). CAB010355 is Approved for IHC, whereas HPA074108 has Supported ICC status and no listed IHC status (HPA antibodies). Keep those application assessments distinct when interpreting a section.
Molecular architectureSOCS1 is a 211-aa chain with no signal peptide, propeptide or transmembrane segment; no isoforms or glycosylation sites are listed (UniProt O15524). These annotations support interpretation of intracellular staining, but provide no target-specific basis for predicting antigen retrieval or fixation sensitivity.
Reference intensityHPA lists medium staining in several named cell populations, low staining in selected neural and glandular populations, and no detected staining in adipocytes (HPA tissue IHC). Compare the same cell type and compartment across controls; do not apply one intensity expectation to every tissue.
Why is my staining missing, weak or wrong?
SituationLikely causeNext action
The reference section is blank.The expected cells may be absent from the viewed area, or an IHC step may have failed (general IHC practice); HPA reports medium staining only for specified cell populations in its positive examples (HPA tissue IHC).Locate a listed population, such as bone marrow hematopoietic cells (HPA tissue IHC), then check the control, retrieval and detection steps against the chosen validated IHC workflow (general IHC practice).
Signal is weak in a low-staining tissue.Low staining is reported for cerebral cortex endothelial cells and hippocampal glial cells (HPA tissue IHC); a faint result there cannot by itself diagnose a failed assay.Compare a reported medium-staining cell population on a reference section (HPA tissue IHC). Assess morphology, controls and exposure to chromogen under the same IHC workflow (general IHC practice).
Only a crisp cell-surface rim stains.The pattern conflicts with the reported nuclear and cytoplasmic IHC profile (HPA tissue IHC) and with the absence of a transmembrane segment (UniProt O15524 topology).Review the negative control, chromogen deposits and tissue edges for artefact before assigning SOCS1 positivity (general IHC practice); score only interpretable cellular staining.
Adipocytes stain more strongly than the intended cells.HPA reports adipocytes as not detected (HPA tissue IHC). Cross-reactivity or endogenous detection activity is possible (general IHC practice).Examine a matched negative control and the distribution of color, then reassess staining in a named HPA-positive cell population (HPA tissue IHC; general IHC practice).
Brown color appears throughout the section.A widespread noncellular deposit can reflect blocking, washing or detection background (general IHC practice); it cannot establish the reported nuclear and cytoplasmic pattern (HPA tissue IHC).Inspect a negative control, wash quality and chromogen development, then score only cells with clear boundaries and interpretable compartments (general IHC practice).
Does IF/ICC need the same interpretation or a protocol here?ICC-IF supports mainly nucleoplasmic localisation with additional vesicles (HPA subcellular); that evidence addresses localisation in imaged cells, not performance of a paraffin IHC protocol.Use the separate IF/ICC guide for its workflow. Here, use the ICC-IF result only as a localisation cross-check against nuclear and cytoplasmic tissue IHC (HPA subcellular; HPA tissue IHC).

Sample controls for SOCS1 IHC & IF

🧪Run bone marrow first and score SOCS1 staining in hematopoietic cells (HPA: Medium in bone marrow hematopoietic cells). Run adipose tissue as the negative comparator (HPA: Not detected in adipocytes); on the bone marrow slide, cells without detectable staining should show only background chromogen and serve as an internal background reference.
Positive control tissue: Adrenal gland (Glandular cells, HPA Medium)
Negative control tissue: Adipose tissue (HPA Not detected)
ICC-IF cell lines (HPA subcellular resource): HPA ICC-IF images show SOCS1 in Hep-G2, MCF-7, U2OS, with annotated localisation: Nucleoplasm (supported) (HPA subcellular).
Technical controls: Include a no-primary, secondary-only control and a concentration-matched rabbit IgG isotype control (selected A00448 caption: rabbit primary and goat anti-rabbit secondary). Use SOCS1 knockout material as a biological specificity control where available, and quench endogenous peroxidase before HRP/DAB detection in bone marrow (HPA: bone marrow hematopoietic cells; selected A00448 caption: HRP/DAB detection).
⚠️Feasibility: No target-specific fixation window or fixation effect is reported in the supplied evidence, and the fixative in the selected A00448 paraffin-section caption is unreported. The caption documents heat retrieval in EDTA at pH 8.0, but does not establish that retrieval is required (selected A00448 caption). IF localisation is supported in the nucleoplasm and vesicles, but the supplied evidence does not establish that IF or frozen sections are easier than paraffin IHC (HPA subcellular: supported nucleoplasm and vesicles).

HPA tissue IHC evidence for SOCS1

Comprehensive Human Protein Atlas IHC scoring per tissue (reliability: Approved — Low consistency between antibody staining and RNA expression data.). Rows are taken directly from the HPA tissue chart — click any row's HPA link to view the source.

Positive expression · recommended positive controls

TissueCell typeLevelEvidenceSource
Adrenal gland Glandular cells Medium Protein (IHC) HPA →
Appendix Glandular cells Medium Protein (IHC) HPA →
Bone marrow Hematopoietic cells Medium Protein (IHC) HPA →
Breast Glandular cells Medium Protein (IHC) HPA →
Bronchus Respiratory epithelial cells Medium Protein (IHC) HPA →

Undetected expression · recommended negative controls

TissueCell typeLevelEvidenceSource
Adipose tissue Adipocytes Not detected Protein (IHC) HPA →
Section 3

Advanced SOCS1 IHC Tips

Troubleshoot SOCS1 staining in paraffin sections by checking retrieval, controls, subcellular pattern and cell-specific scoring (datasheet A00448; HPA tissue IHC).

What retrieval should I use when SOCS1 staining is weak?
Start with heat-mediated retrieval in EDTA at pH 8.0 for paraffin sections (datasheet A00448). The selected SOCS1 image used this buffer before incubation with 2 μg/ml primary antibody overnight at 4°C, so keep those conditions consistent while troubleshooting retrieval (datasheet A00448). If staining remains weak, compare retrieval duration on adjacent sections while holding antibody concentration, detection and development constant; excessive heating can damage morphology (standard IHC practice). Include a matched section processed without primary antibody and compare nuclear and cytoplasmic staining within intact cells, since both patterns occur in tissue (HPA tissue IHC).
Could fixation explain weak or uneven SOCS1 staining?
The selected image identifies a paraffin-embedded section, but does not state its fixative; SOCS1-specific fixation sensitivity therefore remains unknown for this antibody (datasheet A00448). Record the actual fixative and fixation interval for each specimen, then compare similarly processed sections before attributing intensity differences to SOCS1 biology (standard IHC practice). Use the documented EDTA retrieval at pH 8.0 and 2 μg/ml primary antibody as starting conditions for these comparisons (datasheet A00448). If staining varies across a section, inspect preserved morphology and section adhesion alongside no-primary controls, and avoid treating damaged or detached regions as biological negatives (standard IHC practice).
Should SOCS1 stain nuclei, cytoplasm or membranes?
Assess nuclear and cytoplasmic staining separately: tissue IHC reports both in most tissues, while subcellular imaging supports nucleoplasm and vesicles (HPA tissue IHC; HPA subcellular). UniProt lists the nucleus and cytoplasmic vesicles, with perinuclear vesicles detected upon interaction with FGFR3 (UniProt O15524 subcellular location). SOCS1 has no transmembrane segment, so an exclusively crisp cell-surface outline is unexpected and warrants a detection-control review (UniProt O15524 topology; standard IHC practice). Compare the pattern in intact cells with adjacent no-primary sections, and score nuclear and cytoplasmic compartments independently if their staining differs (standard IHC practice).
How can I assess epitope-dependent SOCS1 staining differences?
The supplied record lists a 211-residue SOCS1 chain and no listed isoforms, signal peptide, propeptide, glycosylation sites or modified residues (UniProt O15524). It places the SH2 domain at residues 79–174 and the SOCS box at 161–210; the selected caption does not specify this antibody's epitope (UniProt O15524 domains; datasheet A00448). Do not assign a compartment-dependent staining difference to an isoform or blocked epitope without independent epitope information (standard IHC practice). Compare adjacent sections using the same EDTA pH 8.0 retrieval and detection conditions, and seek an independent antibody with a documented, distinct epitope if the pattern remains disputed (datasheet A00448; standard IHC practice).
How should IF findings inform a multiplex SOCS1 tissue experiment?
Treat IF/ICC as supporting localisation evidence for the IHC interpretation: subcellular imaging places SOCS1 mainly in nucleoplasm and additionally in vesicles (HPA subcellular). For a separate IF multiplex experiment, pair SOCS1 with a marker for the expected cell population, such as hematopoietic cells in bone marrow, and check overlap cell by cell (HPA tissue IHC; standard IF practice). Choose fluorophores after examining unstained tissue autofluorescence, and include single-color controls to assess bleed-through (standard IF practice). Because SOCS1 is nuclear or intracellular and has no transmembrane segment, permeabilise sufficiently for intracellular antibody access, then verify morphology and signal against matched controls (UniProt O15524 subcellular location and topology; standard IF practice).
How do I distinguish diffuse SOCS1 stain from detection background?
Use a no-primary section to identify signal from secondary detection and chromogen development, and compare it with a section stained under identical conditions (standard IHC practice). The selected procedure used 10% goat serum blocking, 2 μg/ml primary antibody overnight at 4°C, peroxidase-linked detection and DAB (datasheet A00448). Apply a peroxidase block as a general chromogenic IHC step, particularly when interpreting staining in blood-rich areas; its use is not specified in the selected caption (standard IHC practice; datasheet A00448). If diffuse staining persists, assess washing, primary concentration and DAB development one variable at a time while retaining nuclear and cytoplasmic controls (standard IHC practice; HPA tissue IHC).
What is a defensible way to quantify SOCS1 IHC? ⚠ ANSWER MARKED FOR VERIFICATION
Define the cell population and compartment before scoring, because SOCS1 tissue staining is reported in nuclei and cytoplasm and varies by cell type (HPA tissue IHC). Report the percentage of positive cells and, when intensity grading is reproducible, an H-score for nuclear and cytoplasmic staining separately (standard IHC practice). For spatial analyses, report positive-cell density per mm² of viable tissue or per mm² of the annotated compartment, alongside the counted-cell denominator (standard IHC practice). Keep retrieval at EDTA pH 8.0, detection and scoring thresholds consistent across sections, and exclude folds, necrosis and section edges from the analysis area (datasheet A00448; standard IHC practice).
Which SOCS1 staining patterns deserve additional validation?
A credible pattern follows intact cell boundaries and can include nuclear and cytoplasmic signal; supported subcellular locations include nucleoplasm and vesicles (HPA tissue IHC; HPA subcellular). Scrutinise isolated membrane outlines because SOCS1 has no transmembrane segment, and avoid calling broad staining in adipocytes positive solely from DAB deposit when HPA reports them as not detected (UniProt O15524 topology; HPA tissue IHC). Compare suspicious signal at cut edges or necrotic regions with viable interior tissue and the no-primary control, including any endogenous peroxidase staining (standard IHC practice). Interpret differences cautiously: HPA labels its tissue IHC approved but reports low consistency between antibody staining and RNA expression data (HPA tissue IHC).
Boster reagents

Best SOCS1 / Suppressor of cytokine signaling 1 IHC Antibodies

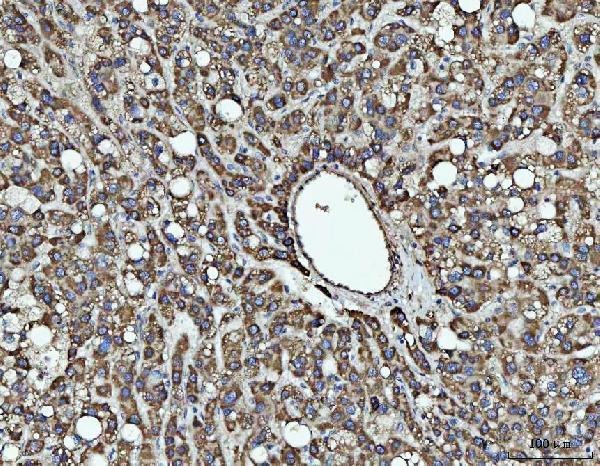
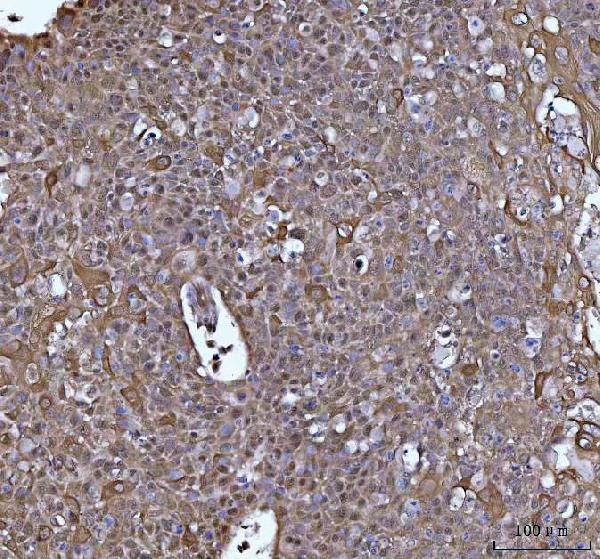
A00448 has real IHC images from paraffin-embedded human liver cancer, esophageal squamous carcinoma, lung cancer and tonsil sections (catalog IHC captions). No IF data are supplied (catalog applications and images).

Real IHC data IHC analysis of SOCS1 using anti-SOCS1 antibody (A00448). SOCS1 was detected in a paraffin-embedded section of human liver cancer tissue. Heat mediated antigen retrieval was performed in EDTA buffer (pH 8.0, epitope retrieval solution). The tissue section was blocked with 10% goat serum. The tissue section was then incubated with 2 μg/ml rabbit anti-SOCS1 Antibody (A00448) overnight at 4°C. Peroxidase Conjugated Goat Anti-rabbit IgG was used as secondary antibody and incubated for 30 minutes at 37°C. The tissue section was developed using HRP Conjugated Rabbit IgG Super Vision Assay Kit (Catalog # SV0002) with DAB as the chromogen.
Anti-SOCS1 Antibody ®
Cat # A00448

A00448 is listed for IHC and has images from human paraffin-embedded liver cancer, esophageal squamous carcinoma, lung cancer and tonsil sections (catalog applications and IHC captions). A00448 lists Human, Mouse and Rat reactivity, while its IHC images show human tissue only (catalog reactivity and IHC captions).

Which to pick: For tissue IHC, choose A00448, a rabbit polyclonal antibody with human paraffin-section images and a listed dilution of 2–5 μg/ml (catalog description, dilution and IHC captions). Its IHC captions specify EDTA retrieval at pH 8.0 and 2 μg/ml primary antibody overnight at 4°C; the fixative is unreported (A00448 IHC captions). No IF/ICC-validated SKU is supplied (catalog applications and IF images); for mouse or rat IHC, A00448 lists reactivity, but staining in those species needs validation because its IHC images show human tissue only (catalog reactivity and IHC captions).

Each figure is that product's own IHC / IF validation image from its datasheet.

References

  1. UniProt Consortium. UniProt entry O15524 (SOCS1_HUMAN, Suppressor of cytokine signaling 1).
  2. Human Protein Atlas. SOCS1 tissue IHC expression (reliability: Approved).
  3. Human Protein Atlas. SOCS1 subcellular location (ICC-IF): Mainly localized to the nucleoplasm. In addition localized to vesicles..
  4. Human Protein Atlas. SOCS1 antibody validation summary (2 antibodies).
  5. Ferroptosis-related SOCS1 as a candidate host-response biomarker in tuberculosis: An integrated transcriptomic and clinical validation study. Medicine 2026 — PMC13574448.
  6. Cigarette smoke-induced lung inflammation in COPD mediated via LTB4/BLT1/SOCS1 pathway. International journal of chronic obstructive pulmonary disease 2016 — PMC4694688.
  7. SOCS1 as a Biomarker Candidate for HPV Infection and Prognosis of Head and Neck Squamous Cell Carcinomas. Current issues in molecular biology 2023 — PMC10378037.
  8. IFN-τ Maintains Immune Tolerance by Promoting M2 Macrophage Polarization via Modulation of Bta-miR-30b-5p in Early Uterine Pregnancy in Dairy Cows. Cells 2025 — PMC11764194.
  9. PubMed PMID:9266833 — UniProt-cited evidence.
  10. PubMed PMID:9341160 — UniProt-cited evidence.
  11. PubMed PMID:9202125 — UniProt-cited evidence.