This website uses cookies to ensure you get the best experience on our website.


- Table of Contents
Plan chromogenic STIM2 IHC-P with the catalog antibody starting at 2.5 μg/mL (datasheet: A02345-2). Use marrow hematopoietic cells as a positive reference (HPA tissue IHC), and interpret general cytoplasmic staining (HPA tissue IHC) alongside annotated ER membrane localisation (UniProt).

Expected localisation, validated protocols, controls and antibodies — the at-a-glance facts below, then the full design guide.
| Expected localisation | General cytoplasmic tissue staining (HPA tissue IHC) | |
| Staining pattern | Cytoplasmic staining in adipocytes and marrow cells (HPA tissue IHC) | |
| Antigen retrieval | Citrate pH 6.0 HIER, 95–98 °C, 20 min (rule: cytoplasmic / membrane antigen) | |
| Positive control | Adipose tissue+4 more · see all | |
| Negative control | None in HPA (detected in all 45 tissues); use no-primary + isotype controls |
| Fixation | Keep fixation consistent (standard IHC practice; not target-specific); Matched tissue-IHC evidence does not establish the fixation claim. Validate the specimen-specific method before use. (selected-SKU IHC image A02345-2) | |
| Caveat | ER Ca²⁺ depletion can redistribute STIM2 to ER–PM junctions (UniProt) | |
| Regulation | No expression regulator specified (UniProt) | |
| Isoform / epitope | 3 isoforms; epitope side matters, isoform coverage unknown (UniProt) |
The catalog antibody’s IHC-P protocol is paired with a published STIM2 method for rat and mouse mandible sections (PMC4626795).
| Sample | Tissue sections; selected-image fixative not specified (standard IHC workflow) |
| Fixation | Image fixative and duration unreported (datasheet A02345-2); verify before use. |
| Sectioning | 4–5 µm sections on charged slides (standard) |
| Deparaffinisation | Xylene, graded ethanol series to water (standard) |
| Antigen retrieval | Heat-induced epitope retrieval in citrate buffer, pH 6.0, 20 min at 95–98 °C (standard rule: cytoplasmic / membrane antigen) |
| Peroxidase block | 3% H2O2, 10 min, room temperature (standard) |
| Blocking | 10% normal serum of the secondary host, 30 min, room temperature (standard) |
| Primary antibody | Rabbit anti-STIM2, 2.5 μg/mL (datasheet A02345-2) |
| Primary incubation | Overnight at 4 °C (standard) |
| Detection | HRP-polymer secondary, DAB chromogen 5–10 min (standard) |
| Counterstain | Hematoxylin, blue, dehydrate and mount (standard) |
| Expected result | STIM2-positive staining in adipocytes of adipose tissue (HPA tissue IHC: High). HPA tissue profile: General cytoplasmic expression. No signal in the no-primary control. |
STIM2 is an endoplasmic reticulum membrane protein with one transmembrane segment at residues 219–235 (UniProt Q9P246 topology). In paraffin sections, expect a cytoplasmic IHC pattern, including in adipocytes, bone marrow hematopoietic cells, and cervical glandular cells reported as High (HPA tissue IHC). HPA rates the tissue profile Supported, with medium consistency between antibody staining and RNA expression (HPA tissue IHC).
| Cytoplasmic staining in adipocytes, bone marrow hematopoietic cells, or cervical glandular cells (HPA: High). | This fits the reported tissue pattern and ER membrane location (HPA tissue IHC; UniProt Q9P246 subcellular location). Compare cells within the same section; HPA's High category does not prescribe an absolute chromogen intensity (HPA tissue IHC). |
| Predominantly nuclear staining, with little convincing cytoplasmic signal (HPA: general cytoplasmic expression). | A nuclear dominant pattern conflicts with the reported IHC profile and ER membrane location (HPA tissue IHC; UniProt Q9P246 subcellular location). Check counterstain, morphology, and staining controls before interpreting it as STIM2 (standard IHC practice). |
| Strong staining in an unexpected cell population, especially where the expected cells are unstained (HPA tissue IHC). | Consider cross-reactivity or endogenous detection activity (standard IHC practice). STIM2 is broadly expressed (UniProt Q9P246 tissue specificity), and HPA supplies no negative tissue here; an unexpected cell alone does not prove nonspecificity (HPA tissue IHC). |
| Diffuse chromogen over tissue and cell-free areas, obscuring cell boundaries (standard IHC practice). | Background can arise from detection chemistry, inadequate blocking, or washing (standard IHC practice). Such staining cannot establish the cytoplasmic cell pattern reported by HPA (HPA tissue IHC). |
| No convincing signal in adipocytes or bone marrow hematopoietic cells reported as High (HPA tissue IHC). | Review section quality, primary antibody, detection reagents, and the complete IHC workflow (standard IHC practice). A negative slide does not by itself overturn a Supported profile whose antibody and RNA data show medium consistency (HPA tissue IHC). |
| Tissue and cell selection (HPA tissue IHC). | Adipocytes, bone marrow hematopoietic cells, and cervical glandular cells are reported High; parathyroid glandular cells and type I alveolar cells are Low (HPA tissue IHC). Low is a comparison category, not a validated negative control (HPA tissue IHC). |
| Epitope position and topology (UniProt Q9P246 topology). | The single membrane segment spans residues 219–235, separating residues 15–218 from the cytoplasmic region at 236–746 (UniProt Q9P246 topology). Without the antibody epitope, these boundaries cannot predict its staining performance (UniProt Q9P246 topology). |
| Antibody evidence (HPA antibody validation). | HPA lists IHC as Supported for HPA036933, HPA057511, and CAB037196 (HPA antibody validation). That status supports use of the reported IHC pattern but does not make every staining pattern from another antibody target-specific (HPA antibody validation; standard IHC practice). |
| ER redistribution (UniProt Q9P246 subcellular location). | STIM2 can move from a uniform ER distribution to punctate ER–plasma membrane junctions as ER calcium falls (UniProt Q9P246 subcellular location). A punctate appearance in a paraffin section alone cannot establish the calcium state (standard IHC interpretation). |
| IF/ICC: what pattern can be expected? (UniProt Q9P246; HPA subcellular). | ER-associated signal is biologically plausible (UniProt Q9P246 subcellular location). HPA summarizes the subcellular result as Membrane but provides no main location or ICC-IF image cell lines; it cannot establish a specific IF appearance here (HPA subcellular). |
| Situation | Likely cause | Next action |
|---|---|---|
| Known HPA High cells show no chromogen (HPA tissue IHC). | The section, primary antibody, or detection chain may have failed (standard IHC practice). | Run a reported High tissue alongside controls and verify each staining step (HPA tissue IHC; standard IHC practice). |
| Signal is predominantly nuclear (HPA: general cytoplasmic expression). | The compartment disagrees with the HPA IHC profile and ER location (HPA tissue IHC; UniProt Q9P246 subcellular location). | Inspect morphology and counterstain, then compare with primary omitted and positive controls (standard IHC practice). |
| Unexpected cells stain strongly while expected cells do not (HPA tissue IHC). | Cross-reactivity or endogenous detection activity is possible (standard IHC practice); broad STIM2 expression limits cell-type exclusion (UniProt Q9P246 tissue specificity). | Check a primary omitted control and the reported cell distribution before assigning specificity (HPA tissue IHC; standard IHC practice). |
| Diffuse background obscures cytoplasmic detail (standard IHC practice). | Blocking, washing, or detection reagents may contribute background (standard IHC practice). | Review blocking and washes; compare with a primary omitted control (standard IHC practice). |
| A Low HPA cell population is treated as a negative control (HPA tissue IHC). | Low records some staining and is not equivalent to absent expression (HPA tissue IHC). | Interpret it comparatively against reported High cells; do not require a blank result (HPA tissue IHC). |
| Puncta are read as proof of calcium depletion (UniProt Q9P246 subcellular location). | UniProt describes dynamic redistribution, but a static IHC section does not document the calcium state (UniProt Q9P246 subcellular location; standard IHC interpretation). | Report the observed distribution without assigning a stimulus or calcium state from morphology alone (standard IHC interpretation). |


Comprehensive Human Protein Atlas IHC scoring per tissue (reliability: Supported — Medium consistency between antibody staining and RNA expression data.). Rows are taken directly from the HPA tissue chart — click any row's HPA link to view the source.
| Tissue | Cell type | Level | Evidence | Source |
|---|---|---|---|---|
| Adipose tissue | Adipocytes | High | Protein (IHC) | HPA → |
| Appendix | Enterocytes - Microvilli | High | Protein (IHC) | HPA → |
| Bone marrow | Hematopoietic cells | High | Protein (IHC) | HPA → |
| Caudate | Glial cells | High | Protein (IHC) | HPA → |
| Cerebral cortex | Endothelial cells | High | Protein (IHC) | HPA → |
| Tissue | Cell type | Level | Evidence | Source |
|---|---|---|---|---|
| None in HPA: STIM2 is detected in all 45 scored tissues. Use a no-primary (secondary-only) and an isotype control instead. | ||||
Troubleshoot STIM2 staining in paraffin sections by checking retrieval, cellular distribution, background and scoring against the stated evidence.
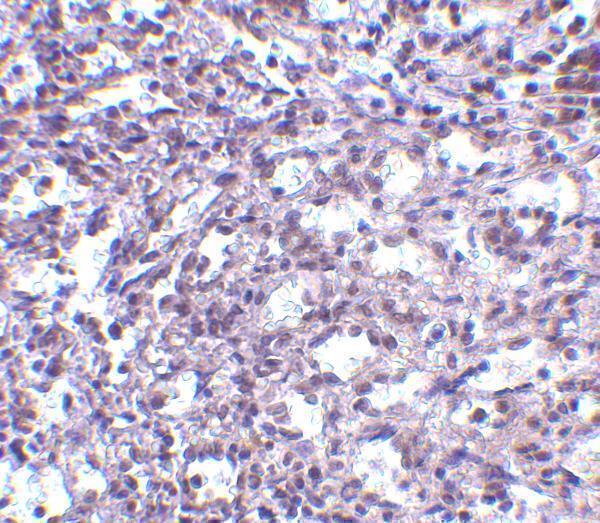
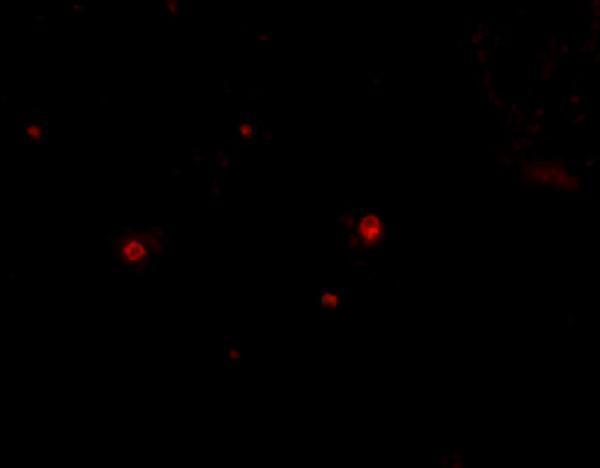
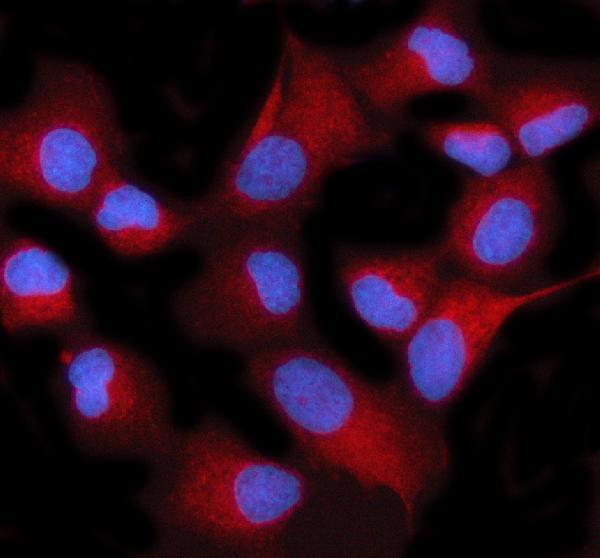
STIM2 antibodies have IHC data from human spleen tissue and IF data from human spleen cells and HELA cells (catalog image captions).
A02345-2 has IHC-P data from human spleen tissue at 2.5 μg/mL and IF data from human spleen cells at 20 μg/mL (A02345-2 image captions). A02345-4 has IF/ICC data from HELA cells at 5 μg/mL (A02345-4 image caption).
Which to pick: Choose A02345-2 for paraffin-section IHC: IHC-P is listed, and its own image shows human spleen tissue stained at 2.5 μg/mL; the fixative is unreported (A02345-2 applications and IHC image caption). For IF/ICC, A02345-4 has a HELA-cell IF example and is listed for both IF and ICC; its datasheet describes it as polyclonal (A02345-4 image caption, applications and dilution_raw). For work across species, A02345-2 lists Human, Mouse and Rat reactivity, while A02345-4 lists Human and Rat; the supplied IHC image demonstrates human tissue only (catalog reactivity and A02345-2 IHC image caption).