TFRC / Transferrin receptor protein 1 · IHC design guide

Design Immunohistochemistry for TFRC

Plan TFRC IHC in paraffin sections using placental trophoblasts or bone marrow hematopoietic cells as strong staining examples (HPA tissue IHC). Assess membranous and cytoplasmic signal, and consider the secreted serum form when interpreting it (HPA tissue IHC; UniProt).

Evidence assembled Oct 2026 · For research use; verify linked source records and product datasheet before use
Immunohistochemistry protocol sheet for TFRC (IHC for TFRC): expected localisation Cytoplasmic and membranous tissue staining (HPA tissue IHC), antibody PB9233, validated IHC image, and IHC protocol steps
Printable TFRC IHC protocol sheet — expected localisation Cytoplasmic and membranous tissue staining (HPA tissue IHC), antibody PB9233, controls and protocol steps. Open the full TFRC IHC guide →

TFRC Immunohistochemistry Experimental Design Guide

Expected localisation, validated protocols, controls and antibodies — the at-a-glance facts below, then the full design guide.

Must know before staining
Expected localisation Cytoplasmic and membranous tissue staining (HPA tissue IHC)
Staining pattern Strong membrane and cytoplasmic staining in trophoblasts and marrow cells (HPA tissue IHC)
Antigen retrieval Citrate pH 6 HIER, heat-mediated (datasheet PB9233)
Positive control ⓘ Bone marrow+4 more · see all
Negative control ⓘ Adipose tissue+4 more · see all
Important caveats
Reasons your staining may differ from the expected pattern.
Fixation Keep fixation consistent across paraffin sections. (standard IHC practice; not target-specific)
Caveat A secreted serum form may affect interpretation of tissue staining (UniProt)
Regulation Expression regulators are not specified (UniProt)
Isoform / epitope No isoforms listed; serum form 101–760 lacks the cytoplasmic tail (UniProt)
Section 1

Recommended TFRC IHC & IF Protocols

Compare the catalog antibody’s IHC-P protocol with two published TFRC staining protocols (PMC11045412; PMC11379720).

Recommended immunohistochemistry (IHC-P) protocol parameters
SampleParaffin-embedded human placenta tissue; fixative not specified (datasheet PB9233)
FixationImage fixative and duration unreported (datasheet PB9233); verify before use.
Sectioning4–5 µm sections on charged slides (standard)
DeparaffinisationXylene, graded ethanol series to water (standard)
Antigen retrievalHeat retrieval: Citrate pH 6, 20 min (datasheet PB9233)
Peroxidase block3% H2O2, 10 min, room temperature (standard)
Blocking10% goat serum (datasheet PB9233)
Primary antibodyRabbit anti-TFRC, 0.5-1μg/ml (datasheet PB9233)
Primary incubationOvernight at 4 °C (datasheet PB9233)
DetectionStreptavidin-biotin complex (SABC), DAB chromogen (datasheet PB9233)
CounterstainHematoxylin, blue, dehydrate and mount (standard)
Expected resultTFRC-positive staining in hematopoietic cells of bone marrow (HPA tissue IHC: High). HPA tissue profile: Cytoplasmic and membranous expression in most tissues, highly abundant in placental trophoblasts and bone marrow cells. No signal in the no-primary control.
💡Decision noteStart with heat-mediated citrate retrieval at pH 6 (datasheet: PB9233); the endometrial cancer protocol specifies 95 °C for 15 minutes (PMC11379720).
Section 2

What Is the Expected TFRC Staining Pattern?

TFRC staining should be mainly membranous and cytoplasmic in paraffin sections, with strong signal in placental trophoblasts, bone marrow hematopoietic cells, and lung macrophages (HPA tissue IHC: Enhanced reliability; High in these cells). Its membrane distribution fits a receptor with a cytoplasmic segment and extracellular domain (UniProt P02786 topology). HPA also reports endosomal and lysosomal localisation by ICC-IF (HPA subcellular).

What am I looking at on my slide?
Strong membrane-associated staining with cytoplasmic signal in placental trophoblasts.This matches a high-expression cell population and the broader membranous and cytoplasmic tissue pattern (HPA tissue IHC: High in trophoblasts; Enhanced reliability). Score the trophoblasts themselves rather than assigning their signal to every cell in the section (HPA tissue IHC: cell-specific result).
Strong staining in bone marrow hematopoietic cells or lung macrophages.These are additional high-expression populations for judging whether the stain reaches expected positive cells (HPA tissue IHC: High in hematopoietic cells and macrophages). Compare the relevant cells within each tissue; HPA's rating describes those cells, not uniform staining across the whole section (HPA tissue IHC: cell-specific levels).
Predominantly nuclear staining, without a convincing membrane or cytoplasmic pattern.Treat this as a localisation mismatch requiring review, rather than calling it TFRC-positive: HPA describes membranous and cytoplasmic tissue staining, and UniProt places TFRC at the cell membrane (HPA tissue IHC; UniProt P02786 subcellular location). Check morphology and staining controls before attributing it to artefact (general IHC practice).
Strong staining in adipocytes, skeletal muscle myocytes, or thyroid glandular cells.These cells are reported as not detected, so strong signal warrants investigation for cross-reactivity or endogenous detection activity (HPA tissue IHC: Not detected in these cells; general IHC practice). A discordant result alone does not identify the cause; compare cell identity, the detection-only control, and the expected positive population (general IHC practice).
Diffuse stain across cells and extracellular spaces, obscuring cell boundaries.The distribution is difficult to score against HPA's cell-specific membranous and cytoplasmic pattern (HPA tissue IHC). Diffuse background can arise from the staining workflow; evaluate a detection-only control and whether expected positive cells remain distinguishable (general IHC practice). UniProt lists a secreted serum form, but this appearance alone does not establish shedding (UniProt P02786 processing).
💡Expected TFRC appearanceA positive IHC result is strong, cell-associated membranous and cytoplasmic staining in trophoblasts, marrow hematopoietic cells, or lung macrophages (HPA tissue IHC: High); dominant nuclear staining or strong signal in HPA-negative cell types is suspect (HPA tissue IHC; UniProt P02786 location).
How each factor affects the staining
Cell-specific tissue distributionHPA rates trophoblasts, marrow hematopoietic cells, and lung macrophages High, while adipocytes and skeletal muscle myocytes are Not detected (HPA tissue IHC). Interpret intensity in the named cell population, because neighboring cells may have different expression (HPA tissue IHC: cell-specific ratings).
Membrane topology and intracellular localisationTFRC has a cytoplasmic segment at residues 1–67, a transmembrane segment at 68–88, and an extracellular region at 89–760 (UniProt P02786 topology). HPA tissue IHC reports membrane and cytoplasmic staining; ICC-IF supports endosomal and lysosomal localisation (HPA tissue IHC; HPA subcellular).
Processed serum formUniProt lists full-length TFRC at residues 1–760 and a serum form at 101–760 (UniProt P02786 processing). This supports caution when interpreting diffuse extracellular signal, but the supplied records do not establish that a particular IHC stain detects the serum form or identify its epitope (UniProt P02786 processing).
Strength and scope of validationHPA assigns Enhanced tissue-IHC reliability and lists two antibodies with Enhanced IHC status (HPA tissue IHC; HPA antibodies: HPA028598, CAB000153). The tissue profile also notes only medium consistency between staining and RNA, with secreted protein complicating their correspondence (HPA tissue IHC: reliability description).
IF/ICC localisation Q&AWhat should IF/ICC show? Mainly endosomes and lysosomes in the HPA subcellular record (HPA subcellular: supported locations). That result comes from ICC-IF and does not replace the membranous and cytoplasmic appearance used to interpret paraffin-section IHC (HPA subcellular; HPA tissue IHC).
Why is my staining missing, weak or wrong?
SituationLikely causeNext action
No stain in a placental trophoblast or marrow hematopoietic-cell positive control.The expected high-expression cells have not been demonstrated; the record alone cannot distinguish tissue selection from a failed staining run (HPA tissue IHC: High in these cells).Target-specific fixation effects are not established by the supplied assay evidence. Verify with a matched IHC source before attributing a result to fixation.
Only faint signal in a tissue chosen as a positive control.The sampled cells may have a lower HPA rating: hepatocytes and small-intestine glandular cells are Low, while several other glandular populations are Medium (HPA tissue IHC).Judge intensity against the named cell type and include a High-rated positive population when available (HPA tissue IHC: tissue levels). Review section and detection quality before interpreting faint staining as TFRC loss (general IHC practice).
Strong staining in an HPA Not detected cell population.Cell identification, antibody cross-reactivity, or endogenous detection activity may account for the discrepancy; HPA's negative call alone cannot separate them (HPA tissue IHC: Not detected; general IHC practice).Recheck cell identity and compare a detection-only control with a known-positive population in the same run (general IHC practice; HPA tissue IHC: High-positive populations).
Predominantly nuclear or structureless cytoplasmic signal.This conflicts with the reported tissue pattern and membrane topology; the image does not by itself establish an artefact mechanism (HPA tissue IHC: membranous and cytoplasmic; UniProt P02786 topology).Inspect morphology, compare the expected positive-cell distribution, and review control staining before scoring the signal as TFRC (general IHC practice; HPA tissue IHC).
Diffuse chromogen obscures otherwise expected positive cells.Background may prevent a reliable cell-specific readout; a secreted serum form is annotated, but its detection in this section is unproven (HPA tissue IHC; UniProt P02786 processing).Compare detection-only controls and review blocking, washing, and chromogen development as general IHC checks (general IHC practice). Score only interpretable cell-associated staining against the HPA pattern (HPA tissue IHC).
IF/ICC puncta seem inconsistent with membrane staining in IHC.HPA supports endosomal and lysosomal ICC-IF localisation, whereas its tissue-IHC profile describes membranous and cytoplasmic expression (HPA subcellular; HPA tissue IHC).Interpret each image against its own application's reported pattern and controls (HPA subcellular; HPA tissue IHC; general IHC/IF practice). The supplied records do not establish that the two preparations must show identical visual detail.

Sample controls for TFRC IHC & IF

🧪Run placenta first: trophoblastic cells should stain (HPA: High in trophoblastic cells). Use skeletal muscle myocytes as the negative tissue (HPA: Not detected in myocytes); on the placenta slide, compare staining with adjacent non-trophoblastic cells as an internal background reference without assuming those cells are TFRC-negative (HPA: High in trophoblastic cells).
Positive control tissue: Bone marrow (Hematopoietic cells, HPA High)
Negative control tissue: Adipose tissue (HPA Not detected)
ICC-IF cell lines (HPA subcellular resource): HPA ICC-IF images show TFRC in A-431, U-251MG, U2OS, with annotated localisation: Endosomes (supported), Lysosomes (supported) (HPA subcellular).
Technical controls: Include a no-primary, secondary-only control, a concentration-matched rabbit IgG isotype control for the rabbit primary, and a TFRC-knockout biological negative where available (selected PB9233 tissue-IHC caption: rabbit primary; standard IHC control practice). For placenta, check endogenous peroxidase and block endogenous biotin before avidin–biotin detection to distinguish tissue background from DAB signal (selected PB9233 tissue-IHC caption: placenta, SABC and DAB; standard IHC practice).
⚠️Feasibility: A target-specific fixation window or fixation effect is unreported, and the selected PB9233 tissue-IHC caption does not state a fixative (selected PB9233 tissue-IHC caption). The documented paraffin-section workflow uses heat-mediated citrate retrieval at pH 6 for 20 minutes; whether retrieval is required under other conditions is unreported (selected PB9233 tissue-IHC caption). Paraffin IHC has a documented starting protocol, while the supplied evidence does not establish whether frozen sections or IF are easier; assess placental endogenous biotin background with the caption’s SABC detection (selected PB9233 tissue-IHC caption; HPA subcellular: ICC-IF images available).

HPA tissue IHC evidence for TFRC

Comprehensive Human Protein Atlas IHC scoring per tissue (reliability: Enhanced — Medium consistency between antibody staining and RNA expression data. At least one protein variant secreted, tissue location of RNA and protein might differ and correlation is complex.). Rows are taken directly from the HPA tissue chart — click any row's HPA link to view the source.

Positive expression · recommended positive controls

TissueCell typeLevelEvidenceSource
Bone marrow Hematopoietic cells High Protein (IHC) HPA →
Lung Macrophages High Protein (IHC) HPA →
Placenta Trophoblastic cells High Protein (IHC) HPA →
Adrenal gland Glandular cells Medium Protein (IHC) HPA →
Appendix Glandular cells Medium Protein (IHC) HPA →

Undetected expression · recommended negative controls

TissueCell typeLevelEvidenceSource
Adipose tissue Adipocytes Not detected Protein (IHC) HPA →
Salivary gland Glandular cells Not detected Protein (IHC) HPA →
Seminal vesicle Glandular cells Not detected Protein (IHC) HPA →
Skeletal muscle Myocytes Not detected Protein (IHC) HPA →
Spleen Cells in red pulp Not detected Protein (IHC) HPA →
Section 3

Advanced TFRC IHC Tips

Troubleshoot TFRC staining in paraffin sections by checking retrieval, cellular distribution, controls, and scoring before interpreting chromogenic signal.

What retrieval should I use when TFRC staining is weak in paraffin sections?
Start with heat-mediated citrate retrieval at pH 6 for 20 minutes (PB9233 tissue-IHC caption). That condition produced TFRC staining in a paraffin-embedded human placenta section, although the caption does not state the fixative (PB9233 tissue-IHC caption). Keep section thickness, heating, cooling, and detection conditions consistent while comparing retrieval runs, and include a placenta control on each run (standard IHC practice; HPA: high in placental trophoblastic cells). If staining remains weak, test an alternative retrieval condition on adjacent sections and judge both signal and tissue preservation; treat it as an optimization, not a validated PB9233 condition (standard IHC practice).
Can fixation explain weak or uneven TFRC staining?
The PB9233 placenta caption identifies a paraffin-embedded section but gives no fixative, so TFRC-specific fixation sensitivity is unknown (PB9233 tissue-IHC caption). Record the fixative, fixation duration, and processing history for each case before attributing weak staining to the antibody (standard IHC practice). Compare affected sections with similarly processed controls containing placental trophoblastic cells or bone marrow hematopoietic cells, which show high TFRC staining in the tissue atlas (HPA: placenta and bone marrow, High). If staining differs between processing batches, repeat adjacent sections with the same pH 6 citrate retrieval and detection conditions before changing antibody concentration (PB9233 tissue-IHC caption; standard IHC practice).
Should TFRC staining appear at the cell surface or inside cells?
Assess both membranous and cytoplasmic staining in paraffin sections; the tissue atlas reports both patterns across most tissues (HPA: tissue IHC profile). TFRC has one transmembrane segment at residues 68–88, with a cytoplasmic 1–67 region and an extracellular 89–760 region (UniProt P02786 topology). Intracellular signal can fit receptor uptake and recycling, and subcellular imaging supports endosomal and lysosomal localisation (UniProt P02786 function; HPA: subcellular location). Judge the pattern within identifiable cells alongside morphology and controls; diffuse staining confined to damaged edges should prompt a technical review before being scored as TFRC (standard IHC practice).
How do epitope location and receptor processing affect TFRC interpretation?
Do not assign PB9233 staining to a particular membrane side: the supplied tissue-IHC caption does not identify the antibody epitope (PB9233 tissue-IHC caption). The annotated receptor has a cytoplasmic 1–67 region and extracellular 89–760 region, while a serum form spans 101–760 (UniProt P02786 topology and processing). UniProt lists 0 annotated isoforms and glycosylation sites at residues 104, 251, 317, and 727; these annotations alone do not establish which form PB9233 detects in sections (UniProt P02786 isoforms and glycosylation; PB9233 tissue-IHC caption). For an unexpected compartment, seek epitope information and compare staining with a separately validated antibody before assigning a molecular form (standard IHC practice).
How should I assess TFRC by multiplex IF alongside chromogenic IHC?
Use the chromogenic placenta result as tissue-IHC evidence; the PB9233 caption supplies no IF fixation or permeabilisation condition (PB9233 tissue-IHC caption). For multiplex IF, pair TFRC with a validated marker for the expected cell population, such as placental trophoblastic cells, and check whether their distributions overlap (HPA: high in placental trophoblastic cells; standard IF practice). Choose a spectrally separated, preferably far-red TFRC channel after examining tissue autofluorescence and single-stain controls (standard IF practice). If the antibody epitope is intracellular, evaluate permeabilisation; if it is extracellular, compare staining without permeabilisation, but first establish the epitope because its location is not supplied for PB9233 (UniProt P02786 topology; PB9233 tissue-IHC caption; standard IF practice).
How can I reduce background without erasing genuine TFRC signal?
First inspect a no-primary control and the same tissue region on the stained slide to separate detection background from cellular signal (standard IHC practice). The PB9233 placenta example used 10% goat serum, 1 µg/mL primary antibody overnight at 4°C, and a biotin-based DAB detection sequence (PB9233 tissue-IHC caption). Check the peroxidase block and, with this detection system, assess endogenous biotin using appropriate controls before increasing washing or reducing antibody concentration (PB9233 tissue-IHC caption; standard IHC practice). Preserve interpretable trophoblastic staining while adjusting background, since placental trophoblastic cells are a high-expression reference in tissue IHC (HPA: placenta, High; standard IHC practice).
How should I score TFRC when membrane and cytoplasmic staining coexist? ⚠ ANSWER MARKED FOR VERIFICATION
Define the target cell population and score viable cells within matched anatomical regions before comparing cases (standard IHC practice). Record the percentage of positive cells and staining intensity on a 0–3 scale; an H-score combines these into a 0–300 range (standard IHC scoring). Keep membranous and cytoplasmic scores separate when their distributions differ, because both patterns are reported for TFRC in tissue sections (HPA: tissue IHC profile; standard IHC practice). Normalize positive-cell counts to the number of evaluable target cells, or positive-cell density to sampled tissue area in mm², and use the same threshold and retrieval batch for comparisons (standard IHC practice).
What distinguishes convincing TFRC positivity from a staining artefact?
Look for a reproducible membranous or cytoplasmic pattern in intact cells, supported by a clean no-primary control and consistent staining across comparable sections (HPA: tissue IHC profile; standard IHC practice). Placental trophoblastic cells, bone marrow hematopoietic cells, and lung macrophages are reported as high-staining populations, whereas adipocytes and skeletal-muscle myocytes are reported as not detected (HPA: tissue IHC). Review unexpected staining against cell identity rather than treating every brown deposit as receptor expression (standard IHC practice). Edge-only staining, necrotic areas, or signal attributable to endogenous peroxidase should be excluded from TFRC scoring until controls and tissue morphology support it (standard IHC practice).
Boster reagents

Best TFRC / Transferrin receptor protein 1 IHC Antibodies

The catalog includes anti-TFRC antibodies with IHC images of human placenta, kidney, and brain, plus IF examples in A431 cells and human placenta (IHC/IF image captions).

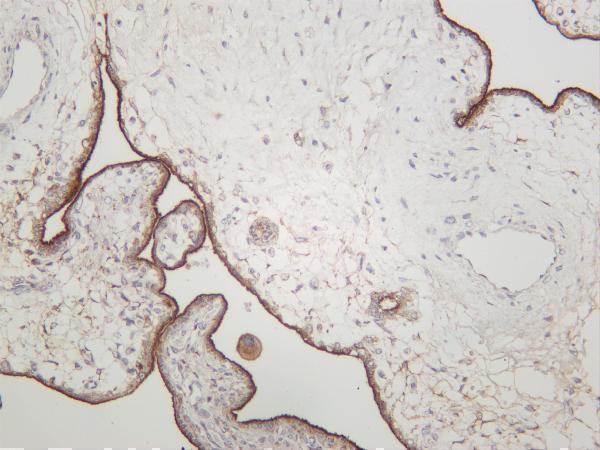
Real IHC data IHC analysis of TFRC using anti-TFRC antibody (PB9233). TFRC was detected in paraffin-embedded section of human placenta tissue. Heat mediated antigen retrieval was performed in citrate buffer (pH6, epitope retrieval solution) for 20 mins. The tissue section was blocked with 10% goat serum. The tissue section was then incubated with 1μg/ml rabbit anti-TFRC Antibody (PB9233) overnight at 4°C. Biotinylated goat anti-rabbit IgG was used as secondary antibody and incubated for 30 minutes at 37°C. The tissue section was developed using Strepavidin-Biotin-Complex (SABC)(Catalog # SA1022) with DAB as the chromogen.
Anti-Transferrin Receptor/TFRC Antibody ®
Cat # PB9233
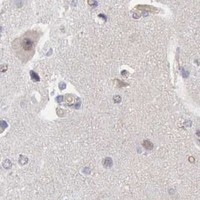
Real IHC data IHC analysis of CD71 using anti-CD71 antibody (M00591-1). CD71 was detected in a paraffin-embedded section of human placenta tissue. Heat mediated antigen retrieval was performed in EDTA buffer (pH 8.0, epitope retrieval solution). The tissue section was blocked with 10% goat serum. The tissue section was then incubated with 1:50 rabbit anti-CD71 Antibody (M00591-1) overnight at 4°C. Peroxidase Conjugated Goat Anti-rabbit IgG was used as secondary antibody and incubated for 30 minutes at 37°C. The tissue section was developed using HRP Conjugated Rabbit IgG Super Vision Assay Kit (Catalog # SV0002) with DAB as the chromogen.
Anti-Transferrin Receptor (CD71) TFRC Rabbit Monoclonal Antibody
Cat # M00591-1
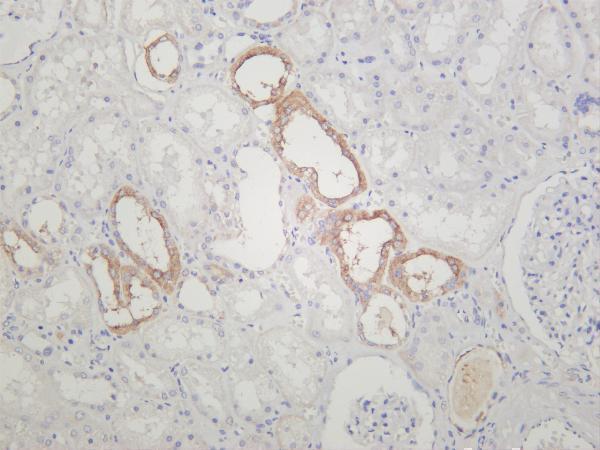
Real IHC data Human kidney was stained with anti-Transferrin Receptor rabbit antibody
Anti-Transferrin Receptor Rabbit Monoclonal Antibody
Cat # M00591-4
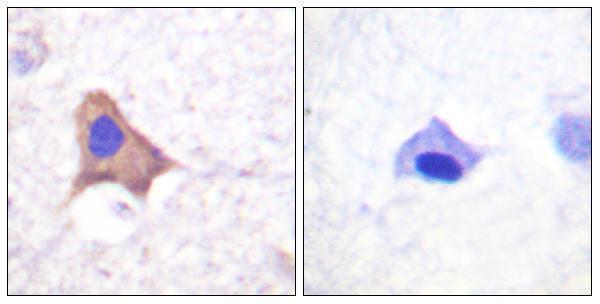
Real IHC data Immunohistochemistry analysis of paraffin-embedded human brain, using CD71/TfR (Phospho-Ser24) Antibody. The picture on the right is blocked with the phospho peptide.
Anti-Phospho-CD71 (S24) TFRC Antibody
Cat # A00591S24

PB9233 and M00591-1 show paraffin-section IHC in human placenta (IHC image captions). M00591-4 shows IHC in human placenta and human, mouse, and rat kidney; A00591S24 shows phospho-Ser24 IHC in paraffin-embedded human brain with peptide blocking (IHC image captions).

Which to pick: For paraffin-section tissue IHC, PB9233 has a human placenta example using citrate retrieval at pH 6 for 20 minutes; M00591-1 has a human placenta example using EDTA retrieval at pH 8.0 (IHC image captions). For IF/ICC, choose PB9233, which lists both applications and has A431 cell and human placenta IF examples (catalog applications; IF image captions). For IHC across species, M00591-4 is a rabbit monoclonal with kidney images from human, mouse, and rat; the fixative is unreported in those captions (catalog antibody description; IHC image captions).

Each figure is that product's own IHC / IF validation image from its datasheet.

References

  1. UniProt Consortium. UniProt entry P02786 (TFR1_HUMAN, Transferrin receptor protein 1).
  2. Human Protein Atlas. TFRC tissue IHC expression (reliability: Enhanced).
  3. Human Protein Atlas. TFRC subcellular location (ICC-IF): Mainly localized to the endosomes and lysosomes..
  4. Human Protein Atlas. TFRC antibody validation summary (2 antibodies).
  5. Novel insights into immune-related genes associated with type 2 diabetes mellitus-related cognitive impairment. World journal of diabetes 2024 — PMC11045412.
  6. Dual-Multivalent Aptamer-Based Drug Delivery Platform for Targeted SRC Silencing to Enhance Doxorubicin Sensitivity in Endometrial Cancer. International journal of biological sciences 2024 — PMC11628347.
  7. Comparative Analysis of Ferroptosis- and Mitochondria-Related Genes in Ischemic Stroke via Bioinformatics Analysis and Experimental Validation. Journal of inflammation research 2026 — PMC13367347.
  8. RAB17 promotes endometrial cancer progression by inhibiting TFRC-dependent ferroptosis. Cell death & disease 2024 — PMC11379720.
  9. PubMed PMID:6090955 — UniProt-cited evidence.
  10. PubMed PMID:6094009 — UniProt-cited evidence.
  11. PubMed PMID:9358047 — UniProt-cited evidence.