This website uses cookies to ensure you get the best experience on our website.


- Table of Contents
Plan TNFRSF10B IHC in paraffin sections using cytoplasmic tissue staining as the reference pattern (HPA tissue IHC). This guide covers fixation, controls and interpretation of extracellular versus cytoplasmic epitopes based on receptor topology (UniProt).

Expected localisation, validated protocols, controls and antibodies — the at-a-glance facts below, then the full design guide.
| Expected localisation | Cytoplasmic tissue staining (HPA tissue IHC); membrane topology (UniProt) | |
| Staining pattern | Cytoplasmic staining across many tissue cell types (HPA tissue IHC) | |
| Antigen retrieval | EDTA pH 8.0 HIER, heat-mediated (datasheet A00410) | |
| Positive control | Adipose tissue+4 more · see all | |
| Negative control | None in HPA (detected in all 45 tissues); use no-primary + isotype controls |
| Fixation | Keep fixation consistent across paraffin sections. (standard IHC practice; not target-specific) | |
| Caveat | Staining may differ from RNA expression (HPA tissue IHC) | |
| Regulation | HCMV UL141 blocks surface expression (UniProt) | |
| Isoform / epitope | 3 isoforms; epitope side matters; coverage unknown (UniProt) |
The catalog antibody’s IHC-P protocol uses EDTA retrieval (datasheet A00410). The published IHC protocols below cover synovial tissue (PMC13607894 methods) and lung autopsy sections (PMC10417228 methods).
| Sample | Paraffin-embedded rat kidney tissue; fixative not specified (datasheet A00410) |
| Fixation | Image fixative and duration unreported (datasheet A00410); verify before use. |
| Sectioning | 4–5 µm sections on charged slides (standard) |
| Deparaffinisation | Xylene, graded ethanol series to water (standard) |
| Antigen retrieval | Heat retrieval: EDTA pH 8.0 (datasheet A00410); 20 min, 95–100 °C (standard) |
| Peroxidase block | 3% H2O2, 10 min, room temperature (standard) |
| Blocking | 10% goat serum (datasheet A00410) |
| Primary antibody | Rabbit anti-TNFRSF10B, 0.5-1μg/ml (datasheet A00410) |
| Primary incubation | Overnight at 4 °C (datasheet A00410) |
| Detection | Streptavidin-biotin complex (SABC), DAB chromogen (datasheet A00410) |
| Counterstain | Hematoxylin, blue, dehydrate and mount (standard) |
| Expected result | TNFRSF10B-positive staining in adipocytes of adipose tissue (HPA tissue IHC: High). HPA tissue profile: Ubiquitous cytoplasmic expression. No signal in the no-primary control. |
TNFRSF10B is a membrane receptor with an extracellular region at residues 56–210 and a cytoplasmic region at 232–440 (UniProt O14763 topology). On paraffin sections, expect broad cellular staining, often cytoplasmic, with strong staining in several listed cell populations (HPA: ubiquitous cytoplasmic expression; High in listed cells). Interpret intensity with care: HPA rates tissue IHC reliability Approved, with medium consistency between antibody staining and RNA expression (HPA tissue IHC).
| Adipocytes, bronchial respiratory epithelium, or breast glandular cells show strong cellular chromogen, sometimes outlining cells. | High staining in these cell populations is consistent with HPA tissue IHC (HPA: High in adipocytes, respiratory epithelial cells, and breast glandular cells). A resolved cell-edge pattern is compatible with membrane localisation (UniProt O14763 topology; HPA subcellular: Membrane). Record cytoplasmic and edge staining separately: HPA describes the overall tissue pattern as cytoplasmic (HPA tissue IHC). |
| Cytoplasmic staining is widespread, but crisp membrane outlines are absent. | This can match the reported tissue pattern; it does not, by itself, establish surface receptor staining (HPA tissue IHC: ubiquitous cytoplasmic expression; UniProt O14763: Membrane). Assess whether signal follows cell boundaries in a well-preserved positive area. The HPA subcellular summary says Membrane but supplies no ICC-IF images here (HPA subcellular). |
| Only nuclei stain, or the deposit follows folds, debris, or section edges. | A nuclear-only pattern conflicts with the membrane annotation and reported cytoplasmic tissue pattern (UniProt O14763: Membrane; HPA tissue IHC). Treat deposit confined to tissue damage as suspect in routine chromogenic IHC; compare a clean area and the negative detection control before scoring it as TNFRSF10B. |
| The strongest signal falls in cells expected to stain weakly, such as hippocampal glia, while listed high-staining cells remain faint. | HPA reports low staining in hippocampal glia and high staining in selected cell populations (HPA tissue IHC). Check cell identification and staining controls before calling this a true reversal. Cross-reactivity or endogenous detection activity is possible in IHC; distribution alone cannot distinguish them. |
| A known HPA high-staining cell population has no visible signal. | An absent result in adipocytes, bone-marrow hematopoietic cells, or colon endothelial cells warrants a control review (HPA: High in these cells). Confirm that those cells are present, then review the catalog antibody's IHC-P instructions, antigen retrieval, and detection controls. HPA's Approved rating has medium RNA–staining consistency, so one negative section does not settle target absence (HPA tissue IHC). |
| Compartment and epitope orientation | The receptor spans residues 211–231, with extracellular and cytoplasmic regions on either side (UniProt O14763 topology). Interpret a cell-edge signal in that context. The supplied antibody record does not identify its epitope (HPA antibody record: HPA023625), so topology cannot predict which region its stain reports. |
| Tissue pattern versus receptor annotation | HPA calls the tissue IHC pattern ubiquitous and cytoplasmic, while UniProt and HPA subcellular annotate membrane localisation (HPA tissue IHC; HPA subcellular; UniProt O14763). Preserve that distinction when scoring. Cytoplasmic chromogen alone cannot show whether receptor is present at the cell surface. |
| Tissue and cell selection | Use the named cell population as the comparison unit: HPA lists high staining in adipocytes, marrow hematopoietic cells, and colon endothelial cells, but low staining in hippocampal and caudate glia (HPA tissue IHC). An entire tissue should not receive one intensity score when its cell populations differ. |
| Source and antibody certainty | HPA marks the tissue IHC profile Approved, with medium consistency against RNA data, and records HPA023625 as IHC Approved (HPA tissue IHC; HPA antibodies). These ratings support comparison with the displayed pattern but do not establish specificity in every specimen. The supplied record has no target-specific fixation-sensitivity result. |
| Isoforms and processing | UniProt lists 3 isoforms and a signal peptide at residues 1–55; the annotated mature chain spans 56–440 (UniProt O14763). Because the supplied antibody record gives no epitope, a particular isoform contribution or epitope loss cannot be inferred from an IHC pattern. |
| Situation | Likely cause | Next action |
|---|---|---|
| Known HPA high-staining cells are blank. | The expected cells may be absent from the section, or an IHC workflow step may have failed; a negative slide alone does not identify the cause (HPA: High in the named cells). | Locate the named cells on the counterstain, include a separately processed positive tissue, and verify retrieval, primary-antibody incubation, and chromogenic detection against the catalog antibody's IHC-P instructions. |
| Chromogen covers cells and stroma uniformly. | Diffuse deposit can reflect background from detection chemistry or insufficient blocking in routine IHC; it is hard to reconcile with a cell-resolved pattern (HPA tissue IHC: cellular staining profile). | Compare a primary-omission control, inspect reagent and wash steps, and adjust blocking or detection conditions using the catalog IHC-P procedure. Score cellular signal only after the diffuse background is resolved. |
| Nuclear staining dominates. | This conflicts with membrane localisation and HPA's reported cytoplasmic tissue pattern (UniProt O14763; HPA tissue IHC). A nuclear deposit should therefore be treated as an unverified IHC signal. | Inspect morphology and a primary-omission control; compare nuclear staining with the same run's positive tissue. Reassess primary-antibody and detection conditions before assigning a TNFRSF10B score. |
| Unexpected cells stain more strongly than the anticipated cells. | Cell misidentification, nonspecific binding, or endogenous chromogen-generating activity may explain the mismatch in routine IHC; HPA assigns different levels to specific cells (HPA tissue IHC). | Identify cells by morphology and counterstain, compare the HPA cell-level pattern, and run an appropriate negative detection control. For enzyme detection, check the applicable endogenous-activity blocking step. |
| A slide is called negative because membrane outlines are faint. | HPA describes ubiquitous cytoplasmic tissue staining despite membrane localisation annotations (HPA tissue IHC; HPA subcellular; UniProt O14763). Requiring crisp outlines could discard a reported pattern. | Score reproducible cellular cytoplasmic staining separately from membrane-associated staining. Use the same compartment criteria in controls and study sections; do not infer surface receptor abundance from cytoplasmic chromogen alone. |
| Cerebellar Purkinje cells stain despite an expectation of no brain signal. | The sources differ: HPA lists high Purkinje-cell IHC staining, whereas UniProt reports TNFRSF10B as undetectable in brain in its tissue-specificity summary (HPA tissue IHC; UniProt O14763 tissue specificity). | Document the cell-specific observation and the source disagreement. Review staining controls and antibody specificity before treating the Purkinje-cell signal as confirmed TNFRSF10B or rejecting it solely from the UniProt summary. |

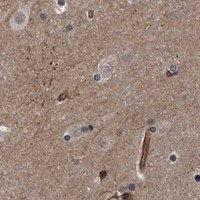
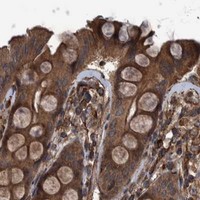
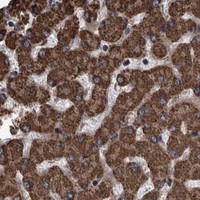
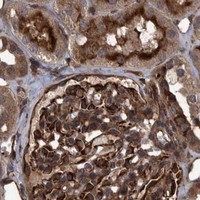
Comprehensive Human Protein Atlas IHC scoring per tissue (reliability: Approved — Medium consistency between antibody staining and RNA expression data.). Rows are taken directly from the HPA tissue chart — click any row's HPA link to view the source.
| Tissue | Cell type | Level | Evidence | Source |
|---|---|---|---|---|
| Adipose tissue | Adipocytes | High | Protein (IHC) | HPA → |
| Adrenal gland | Glandular cells | High | Protein (IHC) | HPA → |
| Appendix | Glandular cells | High | Protein (IHC) | HPA → |
| Bone marrow | Hematopoietic cells | High | Protein (IHC) | HPA → |
| Breast | Glandular cells | High | Protein (IHC) | HPA → |
| Tissue | Cell type | Level | Evidence | Source |
|---|---|---|---|---|
| None in HPA: TNFRSF10B is detected in all 45 scored tissues. Use a no-primary (secondary-only) and an isotype control instead. | ||||
Troubleshoot TNFRSF10B staining by checking retrieval, antibody access, compartmental pattern and controls before comparing signal across sections.
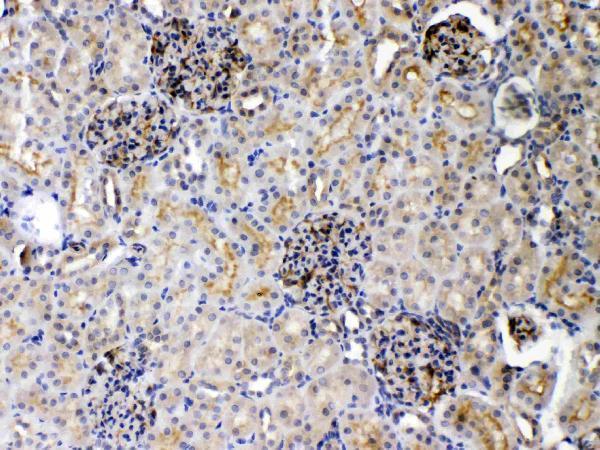
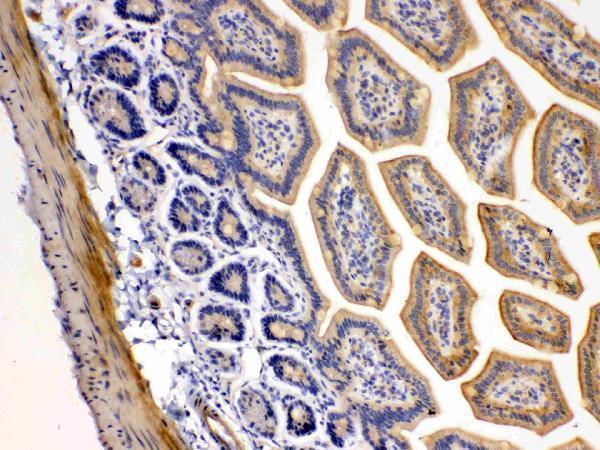
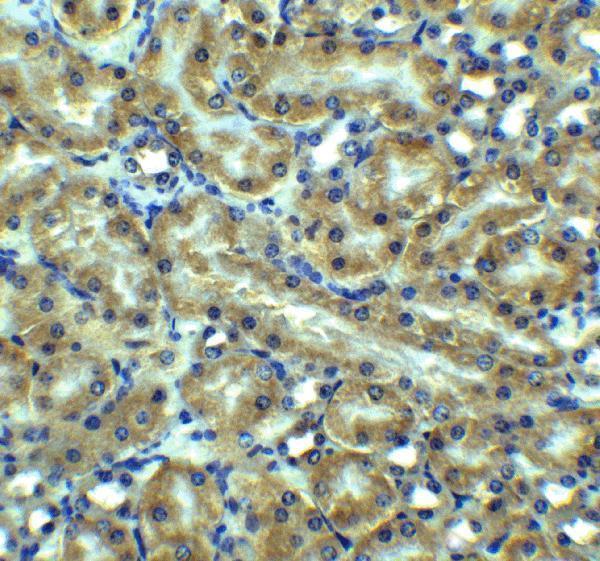
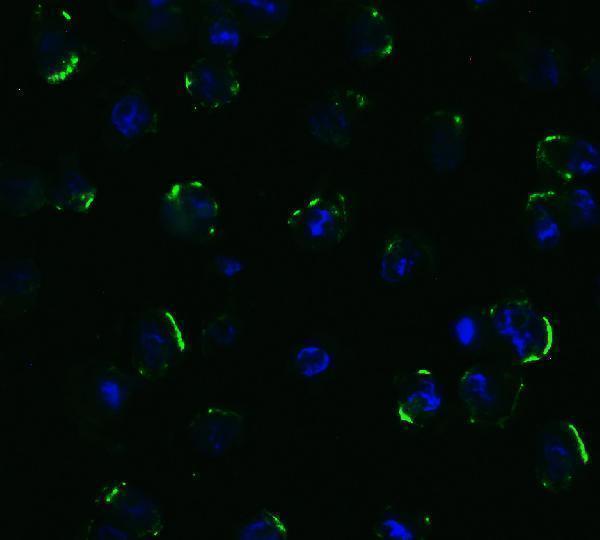
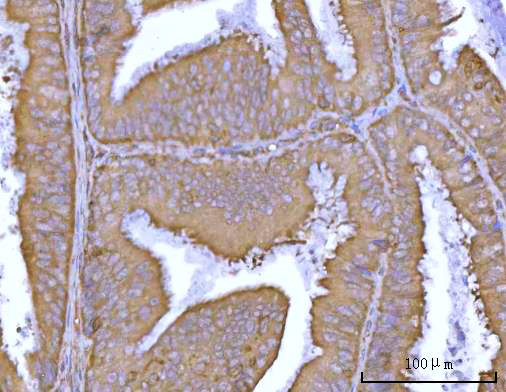
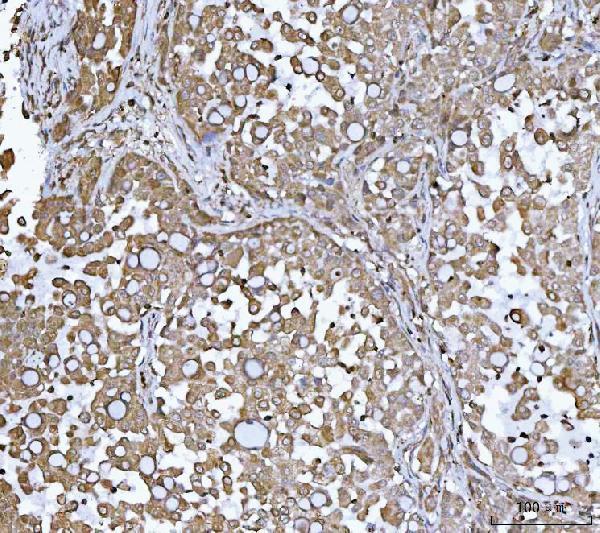
Catalog images show TNFRSF10B staining in human, mouse and rat paraffin sections, plus IF in human, mouse and rat samples (catalog image captions).
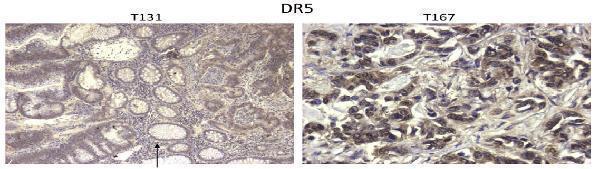
A00410 has IHC images from rat kidney, mouse intestine and human intestinal cancer; A00410-2 has mouse kidney IHC and human, mouse and rat IF images (catalog image captions). A00410-5 has IHC images from human endometrioid adenocarcinoma, lung cancer and tonsil; PA1842 shows human lung cancer IHC (catalog image captions).
Which to pick: For human tissue IHC, A00410-5 shows paraffin-section staining in three human tissues, with fixative unreported; A00410-2 shows paraffin-section mouse kidney paraffin sections (respective IHC image captions). For cross-species IHC, A00410 lists human, mouse and rat reactivity and shows paraffin sections from all three, with fixative unreported (catalog reactivity; A00410 IHC image captions). For IF/ICC, choose A00410-2: it lists IF for human, mouse and rat and shows 4% paraformaldehyde-fixed human HepG2 cells; clonality is unreported for every SKU (catalog applications and clone fields; A00410-2 IF image captions). The selected A00410 tissue-IHC caption documents paraffin sections, but does not specify the fixative (selected-SKU IHC image A00410).