This website uses cookies to ensure you get the best experience on our website.


- Table of Contents
Real validated TNFSF10 Western blot protocols, expected-band and isoform facts, troubleshooting for weak or shifted signal, and recommended anti-TNFSF10 WB antibodies. Everything you need to plan the experiment before you commit precious samples.
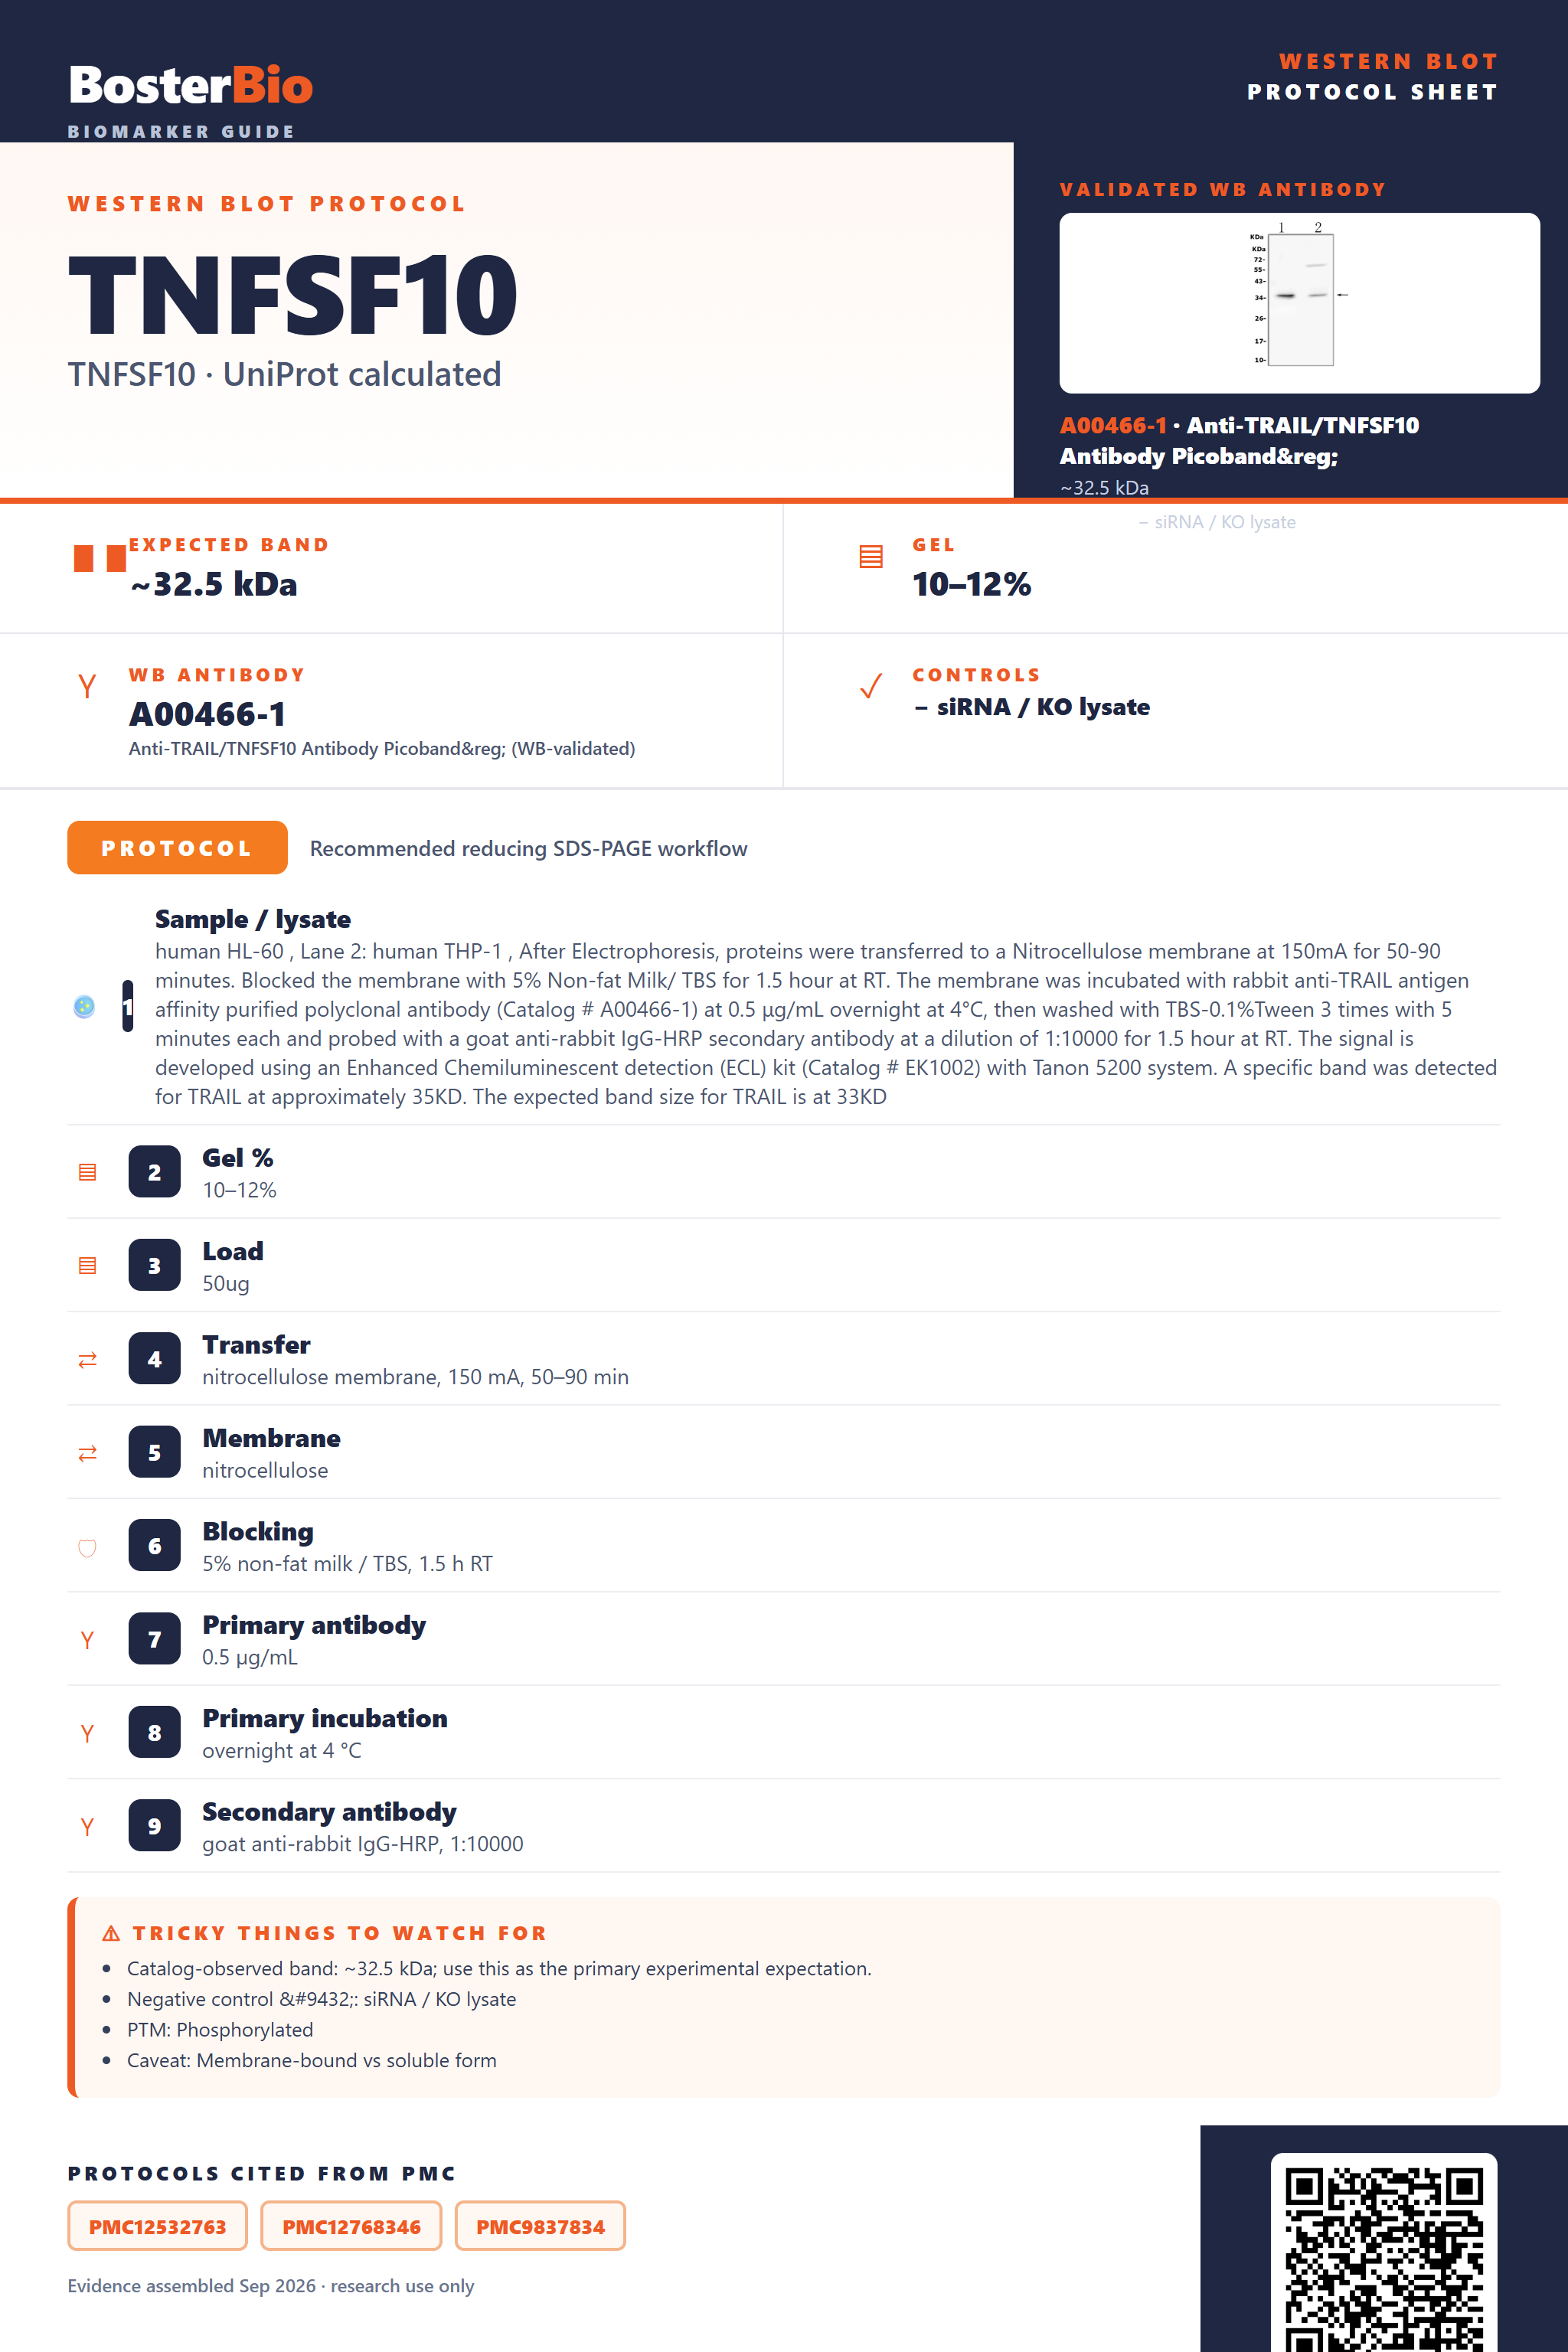
Expected bands, validated protocols, controls and antibodies — the at-a-glance facts below, then the full design guide.
| Expected band | ~32.5 kDa | |
| Observed band | ~35 kDa | |
| Gel | 10–12% | |
| Negative control | siRNA / KO lysate |
| PTM | Phosphorylated | |
| Caveat | Membrane-bound vs soluble form | |
| Regulation | Inflammation up | |
| Isoform | 2 isoform(s) |
Literature-validated Western blot parameters for TNFSF10 — gel percentage, transfer, blocking, antibody incubation and detection, extracted from published methods.
| Sample / lysate | human HL-60 , Lane 2: human THP-1 , After Electrophoresis, proteins were transferred to a Nitrocellulose membrane at 150mA for 50-90 minutes. Blocked the membrane with 5% Non-fat Milk/ TBS for 1.5 hour at RT. The membrane was incubated with rabbit anti-TRAIL antigen affinity purified polyclonal antibody (Catalog # A00466-1) at 0.5 μg/mL overnight at 4°C, then washed with TBS-0.1%Tween 3 times with 5 minutes each and probed with a goat anti-rabbit IgG-HRP secondary antibody at a dilution of 1:10000 for 1.5 hour at RT. The signal is developed using an Enhanced Chemiluminescent detection (ECL) kit (Catalog # EK1002) with Tanon 5200 system. A specific band was detected for TRAIL at approximately 35KD. The expected band size for TRAIL is at 33KD |
| Gel % | 10–12% |
| Load | 50ug |
| Transfer | nitrocellulose membrane, 150 mA, 50–90 min |
| Membrane | nitrocellulose |
| Blocking | 5% non-fat milk / TBS, 1.5 h RT |
| Primary antibody | 0.5 µg/mL |
| Primary incubation | overnight at 4 °C |
| Secondary antibody | goat anti-rabbit IgG-HRP, 1:10000 |
| Wash | TBS-0.1% Tween, 3 × 5 min |
| Detection | ECL |
| Exposure / imaging | Tanon 5200 |
| Observed band | 35 kDa |
TNFSF10 has a 32.5 kDa predicted backbone but runs at about 35 kDa on blots, likely due to its type II membrane-anchored structure rather than glycosylation, which it lacks.
| single band at ~35 kDa | the full-length TNFSF10 monomer, running modestly above its 32.5 kDa predicted mass consistent with its type II membrane-anchored structure |
| band near 32.5 kDa | the unmodified TNFSF10 backbone, since the protein carries no annotated glycosylation sites or disulfide-linked oligomerization |
| little or no band in whole-cell lysate | TNFSF10 exists in a soluble, secreted form in addition to the membrane-bound form, so much of the protein pool is released outside the cell rather than retained in lysate |
| two closely spaced bands | expression of the two annotated TNFSF10 splice isoforms at slightly different apparent sizes |
| sharp, non-smeared band | expected given the absence of annotated glycosylation sites, so no glycoform-driven heterogeneity is predicted |
| Predicted mass from UniProt | sets the 32.5 kDa baseline for the unmodified TNFSF10 monomer backbone |
| Type II membrane signal-anchor sequence | can cause the protein to migrate somewhat higher than predicted, consistent with the ~35 kDa empirically observed band |
| Dual membrane-bound and secreted localization | shifts a portion of the protein pool out of the cell lysate and into the soluble/secreted fraction, reducing lysate band intensity |
| Splice isoforms (isoform 1, isoform 2) | can add a second band of qualitatively different size alongside the principal isoform |
| Absence of annotated glycosylation and disulfide bonds | predicts a single sharp band rather than a glycoform smear or a covalently linked higher-mass complex |
| Situation | Likely cause | Next action |
|---|---|---|
| No band in lysate | TNFSF10 exists in a soluble, secreted form that is released from the cell rather than fully retained intracellularly | test concentrated conditioned media or extracellular fractions alongside whole-cell lysate |
| Band higher than expected | the type II membrane-anchored monomer runs above its 32.5 kDa calculated mass | reference the ~35 kDa empirical band reported for this antibody rather than the calculated mass alone |
| Multiple bands | co-expression of the two annotated TNFSF10 splice isoforms in the sample | confirm isoform identity using isoform-specific controls or transcript-level validation |
| Weak or no signal | release of the soluble form into the extracellular space can lower intracellular TNFSF10 abundance | increase lysate loading or enrich membrane fractions, and probe concentrated supernatant separately |
| Broad smear instead of sharp band | unlikely to be glycosylation since none is annotated, so a smear more likely reflects degradation or sample overloading | add protease inhibitors, reduce sample loading, and use fresh lysate |
| Fragments below expected size | the soluble form released from the membrane-bound precursor can appear as a smaller species distinct from the full transmembrane form | expect a smaller band in secreted/conditioned-media fractions separate from the membrane-associated lysate band |

Comprehensive Human Protein Atlas IHC scoring per tissue. Rows are taken directly from the HPA tissue chart — click any row's HPA link to view the source.
| Tissue | Cell type | Level | Evidence | Source |
|---|
| Tissue | Cell type | Level | Evidence | Source |
|---|
Deeper troubleshooting and optimisation questions for TNFSF10, answered from its protein features.
BosterBio's TNFSF10 antibodies are among the best-performing WB antibodies on the market — well cited, thoroughly validated, and orthogonally cross-validated against negative tissues and complementary methods.
The anti-TRAIL antibody below is our top-performing pick for TNFSF10 Western blotting, supported by extensive citation history and rigorous validation, including orthogonal confirmation against negative tissue controls and complementary detection methods to ensure specific, reproducible band detection.
Which to pick: Only one Boster antibody is catalogued for TNFSF10: A00466-1, which includes a validated Western blot image showing a specific TRAIL band on SDS-PAGE, making it the clear, ready-to-use choice for this target.