TP53I3 / Quinone oxidoreductase PIG3 · IHC design guide

Design Immunohistochemistry for TP53I3

Plan TP53I3 chromogenic IHC in paraffin sections using the catalog antibody and tissue staining evidence. Compare nuclear and cytoplasmic staining across cells while accounting for p53-dependent expression.

Evidence assembled Oct 2026 · For research use; verify linked source records and product datasheet before use
Immunohistochemistry protocol sheet for TP53I3 (IHC for TP53I3): expected localisation Nuclear and cytoplasmic staining in most tissues (HPA tissue IHC), antibody A06870-3, validated IHC image, and IHC protocol steps
Printable TP53I3 IHC protocol sheet — expected localisation Nuclear and cytoplasmic staining in most tissues (HPA tissue IHC), antibody A06870-3, controls and protocol steps. Open the full TP53I3 IHC guide →

TP53I3 Immunohistochemistry Experimental Design Guide

Expected localisation, validated protocols, controls and antibodies — the at-a-glance facts below, then the full design guide.

Must know before staining
Expected localisation Nuclear and cytoplasmic staining in most tissues (HPA tissue IHC)
Staining pattern Most tissues: nuclear and cytoplasmic staining (HPA tissue IHC)
Antigen retrieval EDTA pH 8.0 HIER, heat-mediated (datasheet A06870-3)
Positive control ⓘ Appendix+4 more · see all
Negative control ⓘ Spleen
Important caveats
Reasons your staining may differ from the expected pattern.
Fixation Keep fixation consistent across sections. (standard IHC practice; not target-specific)
Caveat Staining and RNA show only medium consistency (HPA tissue IHC)
Regulation Expression is induced by p53 (UniProt)
Isoform / epitope 2 isoforms; epitope coverage is unspecified (UniProt; catalog data)
Section 1

Recommended TP53I3 IHC & IF Protocols

The catalog antibody uses EDTA pH 8.0 heat retrieval (datasheet A06870-3). One published IHC protocol stains melanoma tissue microarrays (PMC4712681).

Recommended immunohistochemistry (IHC-P) protocol parameters
SampleParaffin-embedded human breast cancer tissue; fixative not specified (datasheet A06870-3)
FixationImage fixative and duration unreported (datasheet A06870-3); verify before use.
Sectioning4–5 µm sections on charged slides (standard)
DeparaffinisationXylene, graded ethanol series to water (standard)
Antigen retrievalHeat retrieval: EDTA pH 8.0 (datasheet A06870-3); 20 min, 95–100 °C (standard)
Peroxidase block3% H2O2, 10 min, room temperature (standard)
Blocking10% goat serum (datasheet A06870-3)
Primary antibodyRabbit anti-TP53I3, 1-2 μg/ml (datasheet A06870-3)
Primary incubationOvernight at 4 °C (datasheet A06870-3)
DetectionHRP-conjugated secondary, DAB chromogen (datasheet A06870-3)
CounterstainHematoxylin, blue, dehydrate and mount (standard)
Expected resultTP53I3-positive staining in endocrine cells of appendix (HPA tissue IHC: High). HPA tissue profile: Nuclear and cytoplasmic expression in most tissues. No signal in the no-primary control.
💡Decision noteStart with EDTA pH 8.0 for the catalog antibody (datasheet A06870-3); consider citrate pH 6.0 when adapting the published melanoma protocol (PMC4712681).
Section 2

What Is the Expected TP53I3 Staining Pattern?

In paraffin-section IHC, expect nuclear and cytoplasmic TP53I3 staining in many tissues (HPA tissue IHC: nuclear and cytoplasmic expression in most tissues). High staining is reported in selected endocrine, glandular, tubular, glial and alveolar cells (HPA tissue IHC: High). HPA rates its tissue profile Enhanced, with medium antibody–RNA consistency and external verification pending (HPA tissue IHC: reliability). TP53I3 has no annotated transmembrane segment (UniProt Q53FA7 topology).

What am I looking at on my slide?
Defined nuclear and cytoplasmic staining in endometrial glandular cells or kidney tubule cells.This fits the reported tissue compartment pattern and two High cell populations (HPA tissue IHC: profile; endometrium and kidney, High). Score the cells and compartments actually stained; a High HPA designation is a reference pattern, not a required intensity for every section or run (HPA tissue IHC: High).
Staining appears only at cell borders, with no convincing nuclear or cytoplasmic signal.A border-only pattern is discordant with the reported tissue profile (HPA tissue IHC: nuclear and cytoplasmic expression). The absence of an annotated transmembrane segment also gives no topology-based reason to expect an exclusively membranous pattern (UniProt Q53FA7 topology). Check morphology and controls before calling it TP53I3.
Strong color appears in an unexpected cell population while the expected cells remain unstained.First verify the cell identity against the relevant HPA image and its named population; HPA reports cell-specific levels, including High endocrine cells in appendix and duodenum (HPA tissue IHC: appendix and duodenum, High). Cross-reactivity or endogenous chromogen activity are possible assay causes, not findings established for this antibody.
Haze covers tissue structures, including spaces between cells, and obscures nuclear boundaries.Treat widespread, poorly localized color as background rather than a TP53I3-positive cell call. The reference pattern describes staining within nuclei and cytoplasm (HPA tissue IHC: profile). Inspect a no-primary control, washing and chromogen development as general chromogenic IHC checks; the HPA profile does not diagnose the cause.
No signal appears in a section containing a documented High cell population.A blank result warrants assay review when the expected cells are present, for example kidney tubule cells or lung alveolar type II cells (HPA tissue IHC: kidney and lung, High). It does not alone prove TP53I3 absence: section quality, detection performance and cell identification need checking before biological interpretation.
💡Expected TP53I3 appearanceCall a convincing positive when identifiable glandular or tubular cells show distinct nuclear and cytoplasmic color, using the High endometrial and kidney populations as references (HPA tissue IHC: profile; endometrium and kidney, High); broad haze or isolated border color is a questionable result, not the reported tissue pattern (HPA tissue IHC: profile).
How each factor affects the staining
Tissue and cell populationExpected intensity depends on the named population: HPA reports High staining in appendix and duodenal endocrine cells, endometrial and fallopian-tube glandular cells, kidney tubules, and lung alveolar type II cells (HPA tissue IHC: High). Spleen red-pulp cells are listed as Not detected; this is a cell-specific reference, not a claim that every spleen cell is negative (HPA tissue IHC: spleen).
Evidence strengthThe tissue IHC profile is rated Enhanced, while its description reports medium agreement between staining and RNA and says external verification is pending (HPA tissue IHC: reliability). Three listed rabbit polyclonal antibodies have Enhanced IHC status (HPA antibodies: HPA022012, HPA028742, CAB017479). These labels support a reference pattern, not certainty for each specimen.
Assay-dependent compartmentParaffin tissue IHC shows nuclear and cytoplasmic expression in most tissues (HPA tissue IHC: profile). Separately, ICC-IF reports supported vesicle localization in imaged A-549 and U-251MG cells (HPA subcellular: Vesicles; cell-line images). For an IF/ICC experiment, assess that result with the separate IF/ICC guide; do not substitute it for the tissue IHC pattern.
Protein features and unknownsUniProt lists two isoforms, a single 1–332 chain, no signal peptide, no propeptide, no annotated glycosylation sites and no transmembrane segment (UniProt Q53FA7: isoforms, processing, glycosylation, topology). No epitope position or target-specific fixation effect is supplied, so these features cannot predict retrieval needs or fixation sensitivity.
Why is my staining missing, weak or wrong?
SituationLikely causeNext action
A documented High population is blank.The expected cells may be missing from the section, or the IHC detection run may have failed; a blank slide alone cannot distinguish these causes (HPA tissue IHC: High populations).Confirm the population on the counterstain and compare a documented High control from the same run; then check the primary-antibody and detection steps using general IHC controls.
Only membrane-like outlines stain.Border-only signal differs from HPA's nuclear and cytoplasmic tissue profile (HPA tissue IHC: profile); UniProt annotates no transmembrane segment (UniProt Q53FA7 topology).Recheck focus and cell boundaries, inspect the no-primary control, and compare nuclear and cytoplasmic staining in a documented High cell population.
Unexpected cells stain more strongly than the intended cells.Cell identity may have been misread; cross-reactivity or endogenous peroxidase activity can also produce misleading chromogenic signal (general IHC practice).Compare morphology with the relevant HPA cell designation, run a no-primary control and assess the peroxidase-blocking step as appropriate for the detection system.
Brown haze obscures cell borders or nuclei.Diffuse signal can arise from nonspecific binding, inadequate washing or excess chromogen development (general chromogenic IHC practice); HPA does not assign a TP53I3-specific cause.Inspect a no-primary control and review blocking, washing and development time; score only resolvable cellular staining.
Spleen red-pulp cells stain strongly.That population is listed as Not detected, so strong signal conflicts with its HPA reference result (HPA tissue IHC: spleen red pulp). A single discordant section does not identify the mechanism.Verify the cells on the counterstain, examine background controls and compare a documented High population processed in the same run before interpreting the signal.
IF/ICC shows puncta unlike the broad tissue IHC pattern.Vesicle localization is supported in the separate ICC-IF dataset, whereas tissue IHC is described as nuclear and cytoplasmic (HPA subcellular: Vesicles; HPA tissue IHC: profile).Record assay and cell context, assess the puncta under the separate IF/ICC guide, and use the tissue IHC profile when interpreting paraffin sections.

Sample controls for TP53I3 IHC & IF

🧪Run appendix first and require staining in its endocrine cells (HPA: High in appendix endocrine cells); use spleen red-pulp cells as the negative tissue reference (HPA: Not detected in spleen red-pulp cells). Adjacent non-endocrine cells on the appendix slide should show background-level signal as an internal comparison, but the supplied HPA row does not establish them as TP53I3-negative (HPA: appendix endocrine cells High).
Positive control tissue: Appendix (Endocrine cells, HPA High)
Negative control tissue: Spleen (HPA Not detected)
ICC-IF cell lines (HPA subcellular resource): HPA ICC-IF images show TP53I3 in A-549, U-251MG, with annotated localisation: Vesicles (supported) (HPA subcellular).
Technical controls: Include no-primary (secondary-only) and concentration-matched rabbit IgG isotype controls, matching the primary antibody’s clonality where known, plus a TP53I3 knockout section if available (selected-SKU caption: rabbit primary; standard IHC practice). Block endogenous peroxidase and check whether inflammatory cells in appendix contribute chromogenic background (selected-SKU caption: HRP/DAB detection; standard IHC practice).
⚠️Feasibility: A target-specific fixation window or fixation effect is unreported, and the selected-SKU paraffin-section caption does not report a fixative (selected-SKU caption: fixative not stated). The reported paraffin IHC example uses heat-mediated EDTA retrieval at pH 8.0, but its necessity has not been established by the supplied evidence (selected-SKU caption: EDTA retrieval, pH 8.0). The supplied evidence does not establish frozen sections or IF as easier; for appendix IHC, assess inflammatory-cell peroxidase background when scoring endocrine cells (HPA: High in appendix endocrine cells; selected-SKU caption: HRP/DAB detection; standard IHC practice).

HPA tissue IHC evidence for TP53I3

Comprehensive Human Protein Atlas IHC scoring per tissue (reliability: Enhanced — Medium consistency between antibody staining and RNA expression data. Pending external verification.). Rows are taken directly from the HPA tissue chart — click any row's HPA link to view the source.

Positive expression · recommended positive controls

TissueCell typeLevelEvidenceSource
Appendix Endocrine cells High Protein (IHC) HPA →
Cerebellum Bergmann glia - cytoplasm/membrane High Protein (IHC) HPA →
Duodenum Endocrine cells High Protein (IHC) HPA →
Endometrium Glandular cells High Protein (IHC) HPA →
Fallopian tube Glandular cells High Protein (IHC) HPA →

Undetected expression · recommended negative controls

TissueCell typeLevelEvidenceSource
Spleen Cells in red pulp Not detected Protein (IHC) HPA →
Section 3

Advanced TP53I3 IHC Tips

Troubleshoot TP53I3 staining in paraffin sections by checking retrieval, cellular pattern, controls, and scoring before interpreting changes in expression.

What retrieval should I try first when TP53I3 staining is weak?
Start with heat-mediated retrieval in EDTA buffer at pH 8.0 (datasheet A06870-3). The selected paraffin-section image used this retrieval, followed by 2 μg/ml primary antibody overnight at 4°C; match those conditions when investigating weak staining (datasheet A06870-3). Keep section thickness, heating, cooling, and detection conditions consistent across the comparison (standard IHC practice). If staining remains weak, test a second retrieval condition on matched sections while retaining the EDTA condition as a reference (standard IHC practice). Compare signal in glandular cells of endometrium with staining in spleen red-pulp cells, while accounting for the limited external verification of the tissue profile (HPA: high in endometrial glandular cells; not detected in spleen red-pulp cells; Enhanced reliability pending external verification).
Could fixation explain variable TP53I3 staining between paraffin blocks?
Target-specific TP53I3 sensitivity to fixation is unknown because the selected paraffin-section caption does not state a fixative (datasheet A06870-3). Record each block’s fixative and processing history, and compare sections processed together before attributing a staining difference to TP53I3 biology (standard IHC practice). Use the documented EDTA retrieval at pH 8.0 and 2 μg/ml primary antibody overnight at 4°C as a consistent starting point (datasheet A06870-3). Inspect tissue morphology and staining at section edges, where processing artefacts can complicate comparison (standard IHC practice). Report fixation as an unresolved variable when its identity or duration is unavailable; neither the tissue staining profile nor the protein record establishes a TP53I3-specific fixation effect (HPA: tissue IHC profile; UniProt Q53FA7).
Should TP53I3 stain nuclei, cytoplasm, or both in tissue sections?
Assess nuclear and cytoplasmic staining separately: the tissue profile reports both compartments in most tissues (HPA: tissue IHC profile). A supported vesicular location comes from cell imaging, so punctate cytoplasmic signal can also be evaluated, without requiring every paraffin section to show distinct vesicles (HPA: subcellular profile). UniProt provides no subcellular annotation and lists no transmembrane segment; it therefore does not establish a membrane-sided staining pattern (UniProt Q53FA7 topology and subcellular record). Score signal within identifiable cells and compare it with a no-primary control on a matched section (standard IHC practice). Treat strong staining confined to damaged edges or acellular material cautiously, even when the overall nuclear or cytoplasmic distribution appears plausible (standard IHC practice).
Can this stain distinguish the two TP53I3 isoforms?
Do not assign an isoform from this stain without an epitope map and isoform-specific validation: the record lists isoforms 1 and 2, while the supplied caption gives no epitope position (UniProt Q53FA7 isoforms; datasheet A06870-3). Check the antibody’s documented immunogen or epitope against both isoform sequences before making an isoform claim (standard antibody validation practice). The annotated chain spans residues 1–332, with no signal peptide, propeptide, transmembrane segment, or glycosylation site; these annotations alone do not identify the antibody’s binding site (UniProt Q53FA7 processing and topology). If staining varies after retrieval, compare matched sections under the same EDTA pH 8.0 condition first (datasheet A06870-3). Report the result as TP53I3 immunoreactivity unless independent evidence establishes isoform specificity (standard IHC practice).
How can I investigate a TP53I3 pattern by multiplex immunofluorescence?
For a separate IF experiment, pair TP53I3 with an independently validated marker of the cell population being examined, such as a type II alveolar cell marker in lung (HPA: high in lung alveolar cells type II; standard multiplex IF practice). Choose spectrally separated fluorophores and consider a far-red TP53I3 channel if the specimen has substantial autofluorescence; inspect unstained tissue in every channel (standard IF practice). Optimise permeabilisation for intracellular access, because the epitope location is unspecified and TP53I3 has no annotated transmembrane segment that defines a membrane side (datasheet A06870-3; UniProt Q53FA7 topology). Compare puncta with the supported vesicular pattern, while recognising that tissue IHC also shows nuclear and cytoplasmic signal (HPA: subcellular and tissue IHC profiles). Validate the antibody and fixation conditions for IF independently; the selected paraffin-section caption supplies neither IF performance nor its fixative (datasheet A06870-3).
How do I reduce diffuse brown background without losing TP53I3 signal?
Begin with the documented 10% goat-serum block and 2 μg/ml primary antibody overnight at 4°C, then inspect a matched no-primary section (datasheet A06870-3; standard IHC practice for the control). The selected method uses a peroxidase-conjugated secondary and DAB; include a peroxidase block and assess secondary-only staining as general chromogenic IHC controls (datasheet A06870-3; standard IHC practice). If background persists, titrate the primary antibody and adjust blocking or wash conditions one variable at a time (standard IHC practice). Compare cellular signal with background in acellular regions, section edges, and damaged tissue before changing retrieval (standard IHC practice). Retain EDTA at pH 8.0 as the reference retrieval condition when comparing changes (datasheet A06870-3).
What is a defensible way to quantify TP53I3 IHC across samples? ⚠ ANSWER MARKED FOR VERIFICATION
Define the cell population and compartment before scoring, because the reported tissue pattern includes nuclear and cytoplasmic expression (HPA: tissue IHC profile). For identifiable cells, record the percentage positive and staining intensity, or calculate an H-score from intensity categories 0–3; keep the scoring rule fixed across sections (standard IHC quantification practice). For a sparse cell population, report positive cells per mm² of viable tissue and normalise to the relevant cell count or tissue area (standard IHC quantification practice). Exclude folds, necrosis, and section edges using the same prespecified rule for every sample (standard IHC practice). Include matched controls and note that the HPA tissue profile has medium staining-to-RNA consistency and awaits external verification (HPA: Enhanced reliability description).
When should a strong TP53I3 stain be treated as artefact?
Evaluate whether signal sits in intact cells and in plausible nuclear or cytoplasmic compartments, rather than relying on brown intensity alone (HPA: tissue IHC profile; standard IHC practice). High staining in glandular cells of endometrium and low or absent staining in spleen red-pulp cells can guide comparison, but the tissue profile awaits external verification (HPA: endometrium and spleen entries; Enhanced reliability description). Treat staining restricted to section edges, necrotic areas, or acellular deposits as suspect, and check no-primary and secondary-only controls (standard IHC practice). A peroxidase block helps assess endogenous enzyme contribution to DAB signal (standard chromogenic IHC practice). Interpret biological changes cautiously: TP53I3 expression is induced by p53 and participates in DNA damage response and apoptosis, but a stain alone does not measure either process (UniProt Q53FA7 function).
Boster reagents

Best TP53I3 / Quinone oxidoreductase PIG3 IHC Antibodies

Two catalog antibodies have IHC images from human paraffin sections (catalog image captions). One also lists IF/ICC and mouse and rat reactivity, but has no IF image (catalog: A30504).

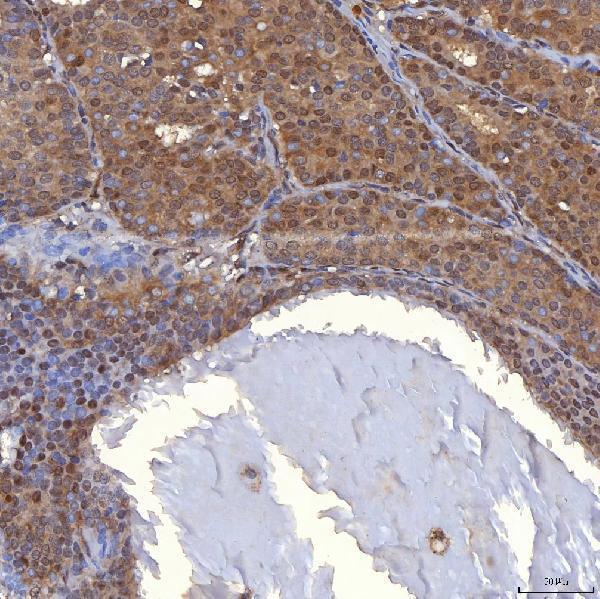
Real IHC data IHC analysis of PIG3/TP53I3 using anti-PIG3/TP53I3 antibody (A06870-3). PIG3/TP53I3 was detected in a paraffin-embedded section of human breast cancer tissue. Heat mediated antigen retrieval was performed in EDTA buffer (pH 8.0, epitope retrieval solution). The tissue section was blocked with 10% goat serum. The tissue section was then incubated with 2 μg/ml rabbit anti-PIG3/TP53I3 Antibody (A06870-3) overnight at 4°C. Peroxidase Conjugated Goat Anti-rabbit IgG was used as secondary antibody and incubated for 30 minutes at 37°C. The tissue section was developed using HRP Conjugated Rabbit IgG Super Vision Assay Kit (Catalog # SV0002) with DAB as the chromogen.
Anti-PIG3/TP53I3 Antibody ®
Cat # A06870-3
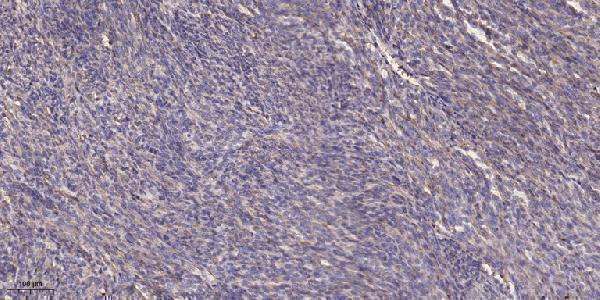
Real IHC data Immunohistochemical analysis of paraffin-embedded human Colon cancer. 1, Antibody was diluted at 1:200(4° overnight). 2, Tris-EDTA,pH9.0 was used for antigen retrieval. 3,Secondary antibody was diluted at 1:200(room temperature, 45min).
Anti-QORX TP53I3 Antibody
Cat # A30504

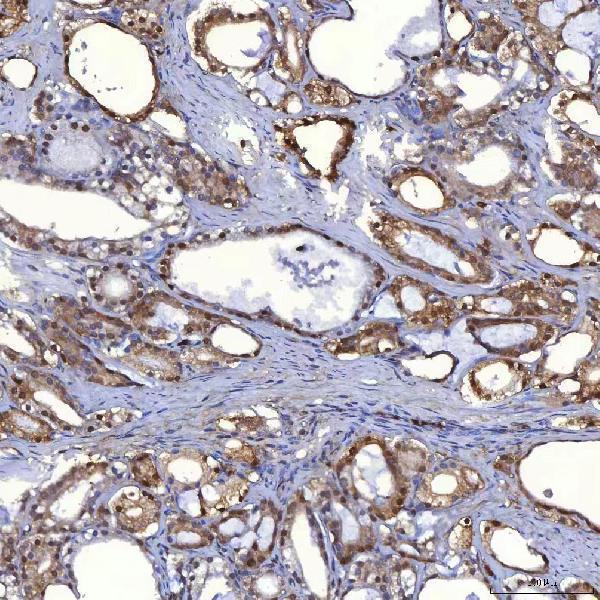
A06870-3 has IHC images from human breast cancer, prostate adenocarcinoma, colon adenocarcinoma, and renal cancer paraffin sections (catalog: A06870-3 image captions). A30504 has an IHC image from a human colon cancer paraffin section and lists IF/ICC among its applications (catalog: A30504 image caption and applications).

Which to pick: For human tissue IHC, A06870-3 has images from four paraffin-section tissue types; its caption specifies EDTA retrieval at pH 8.0 and 2 μg/ml primary antibody, but does not report the fixative (catalog: A06870-3 image captions). For IF/ICC or mouse and rat samples, choose A30504 because those applications and species are listed for this polyclonal antibody; no IF image is supplied (catalog: A30504 applications, reactivity, dilution data, and image list). Its IHC caption supports human colon cancer paraffin sections with Tris-EDTA retrieval at pH 9.0 and 1:200 primary antibody; the fixative is unreported (catalog: A30504 image caption).

Each figure is that product's own IHC / IF validation image from its datasheet.

References

  1. UniProt Consortium. UniProt entry Q53FA7 (QORX_HUMAN, Quinone oxidoreductase PIG3).
  2. Human Protein Atlas. TP53I3 tissue IHC expression (reliability: Enhanced).
  3. Human Protein Atlas. TP53I3 subcellular location (ICC-IF): Localized to vesicles..
  4. Human Protein Atlas. TP53I3 antibody validation summary (3 antibodies).
  5. A TP53-Pathway-Based Prognostic Signature for Radiotherapy and Functional Validation of TP53I3 in Non-Small-Cell Lung Cancer. Cancers 2026 — PMC12896867.
  6. Gamabufotalin Suppresses Colorectal Cancer Growth via Oxidative Stress-Induced Apoptosis and DNA Synthesis Inhibition. Iranian journal of pharmaceutical research : IJPR 2026 — PMC13181813.
  7. Reactivation of p53 by a Cytoskeletal Sensor to Control the Balance Between DNA Damage and Tumor Dissemination. Journal of the National Cancer Institute 2016 — PMC4712681.
  8. PubMed PMID:9305847 — UniProt-cited evidence.
  9. PubMed PMID:15067011 — UniProt-cited evidence.
  10. PubMed PMID:15815621 — UniProt-cited evidence.