Click image to see more details
-

-
-
-
-
+9
Product Info Summary
| SKU: | A08751 |
|---|---|
| Size: | 100 µg/vial |
| Reactive Species: | Mouse, Rat |
| Host: | Rabbit |
| Application: | IF, IHC |
Customers Who Bought This Also Bought

Product info
Product Name
Anti-F4/80/Adgre1 Antibody
SKU/Catalog Number
A08751
Size
100 µg/vial
Form
Liquid
Description
Boster Bio Anti-F4/80/Adgre1 Antibody catalog # A08751. Tested in IF, IHC applications. This antibody reacts with Mouse, Rat.
Storage & Handling
At -20˚C for one year, at 4˚C for one month. Avoid repeated freezing and thawing.
Cite This Product
Anti-F4/80/Adgre1 Antibody (Boster Biological Technology, Pleasanton CA, USA, Catalog # A08751)
Host
Rabbit
Contents
500 ug/ml antibody with PBS, 0.02% NaN3, 1 mg/ml stabilizing protein and 50% glycerol.
*This antibody is supplied in a stabilized formulation.
Compatibility with conjugation reactions depends on the chemistry of the conjugation method used.
For conjugation methods that are not compatible with the stabilizing components present in this formulation, a carrier-free antibody format is required.
Clonality
Polyclonal
Isotype
Rabbit IgG
Immunogen
E.coli-derived mouse F4/80/Adgre1 recombinant protein (Position: G27-S230).
Cross-reactivity
No cross-reactivity with other proteins.
Reactive Species
A08751 is reactive to Adgre1 in Mouse, Rat
Calculated molecular weight
102.1 kDa
Background of Adgre1
Predicted to enable G protein-coupled receptor activity. Predicted to be involved in adenylate cyclase-activating G protein-coupled receptor signaling pathway. Predicted to act upstream of or within G protein-coupled receptor signaling pathway and adaptive immune response. Located in external side of plasma membrane. Is expressed in several structures, including cardiovascular system; central nervous system; genitourinary system; hemolymphoid system; and intestine. Orthologous to human ADGRE1 (adhesion G protein-coupled receptor E1).
Antibody Validation
Boster validates all antibodies on WB, IHC, ICC, Immunofluorescence, and ELISA with known positive control and negative samples to ensure specificity and high affinity, including thorough antibody incubations.
Application & Images
Applications
A08751 is guaranteed for IF, IHC Boster Guarantee
Recommend Dilution
| Application | Dilution | Species |
|---|---|---|
| Immunohistochemistry(Paraffin-embedded Section) | 2-5 µg/ml | Mouse, Rat |
| Immunofluorescence | 5 µg/ml | Mouse, Rat |
Tested application
Use TE buffer pH 9.0 for antigen retrieval; (*) citrate buffer pH 6.0 is an alternative.
Validation Images & Assay Conditions
Click image to see more details
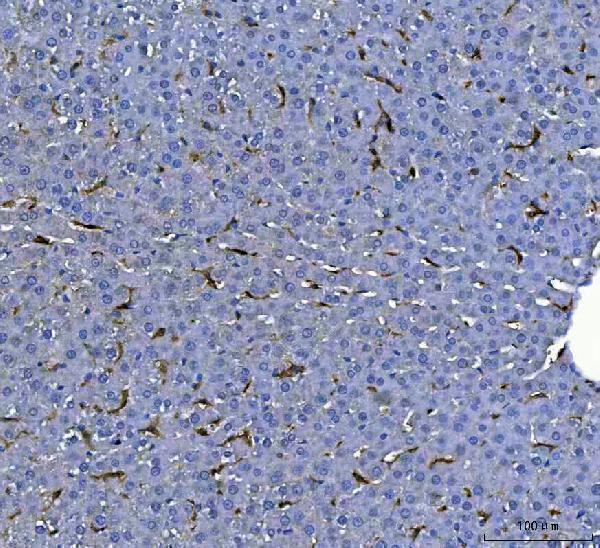
IHC analysis of F4/80/Adgre1 using anti-F4/80/Adgre1 antibody (A08751).
F4/80/Adgre1 was detected in a paraffin-embedded section of rat liver tissue. Heat mediated antigen retrieval was performed in EDTA buffer (pH 8.0, epitope retrieval solution). The tissue section was blocked with 10% goat serum. The tissue section was then incubated with 2 μg/ml rabbit anti-F4/80/Adgre1 Antibody (A08751) overnight at 4°C. Peroxidase Conjugated Goat Anti-rabbit IgG was used as secondary antibody and incubated for 30 minutes at 37°C. The tissue section was developed using HRP Conjugated Rabbit IgG Super Vision Assay Kit (Catalog # SV0002) with DAB as the chromogen.

Click image to see more details
IHC analysis of F4/80/Adgre1 using anti-F4/80/Adgre1 antibody (A08751).
F4/80/Adgre1 was detected in a paraffin-embedded section of mouse liver tissue. Heat mediated antigen retrieval was performed in EDTA buffer (pH 8.0, epitope retrieval solution). The tissue section was blocked with 10% goat serum. The tissue section was then incubated with 2 μg/ml rabbit anti-F4/80/Adgre1 Antibody (A08751) overnight at 4°C. Peroxidase Conjugated Goat Anti-rabbit IgG was used as secondary antibody and incubated for 30 minutes at 37°C. The tissue section was developed using HRP Conjugated Rabbit IgG Super Vision Assay Kit (Catalog # SV0002) with DAB as the chromogen.

Click image to see more details
IHC analysis of F4/80/Adgre1 using anti-F4/80/Adgre1 antibody (A08751).
F4/80/Adgre1 was detected in a paraffin-embedded section of mouse spleen tissue. Heat mediated antigen retrieval was performed in EDTA buffer (pH 8.0, epitope retrieval solution). The tissue section was blocked with 10% goat serum. The tissue section was then incubated with 2 μg/ml rabbit anti-F4/80/Adgre1 Antibody (A08751) overnight at 4°C. Peroxidase Conjugated Goat Anti-rabbit IgG was used as secondary antibody and incubated for 30 minutes at 37°C. The tissue section was developed using HRP Conjugated Rabbit IgG Super Vision Assay Kit (Catalog # SV0002) with DAB as the chromogen.

Click image to see more details
IF analysis of F4/80/Adgre1 using anti-F4/80/Adgre1 antibody (A08751).
F4/80/Adgre1 was detected in a paraffin-embedded section of mouse liver tissue. Heat mediated antigen retrieval was performed in EDTA buffer (pH 8.0, epitope retrieval solution). The tissue section was blocked with 10% goat serum. The tissue section was then incubated with 5 μg/mL rabbit anti-F4/80/Adgre1 Antibody (A08751) overnight at 4°C. Cy3 Conjugated Goat Anti-Rabbit IgG (BA1032) was used as secondary antibody at 1:500 dilution and incubated for 30 minutes at 37°C. Visualize using a fluorescence microscope and filter sets appropriate for the label used.

Click image to see more details
IHC analysis of F4/80/Adgre1 using anti-F4/80/Adgre1 antibody (A08751).
F4/80/Adgre1 was detected in a paraffin-embedded section of mouse kidney tissue. Heat mediated antigen retrieval was performed in EDTA buffer (pH 8.0, epitope retrieval solution). The tissue section was blocked with 10% goat serum. The tissue section was then incubated with 2 μg/ml rabbit anti-F4/80/Adgre1 Antibody (A08751) overnight at 4°C. Peroxidase Conjugated Goat Anti-rabbit IgG was used as secondary antibody and incubated for 30 minutes at 37°C. The tissue section was developed using HRP Conjugated Rabbit IgG Super Vision Assay Kit (Catalog # SV0002) with DAB as the chromogen.

Click image to see more details
IF analysis of F4/80/Adgre1 using anti-F4/80/Adgre1 antibody (A08751).
F4/80/Adgre1 was detected in a paraffin-embedded section of mouse spleen tissue. Heat mediated antigen retrieval was performed in EDTA buffer (pH 8.0, epitope retrieval solution). The tissue section was blocked with 10% goat serum. The tissue section was then incubated with 5 μg/mL rabbit anti-F4/80/Adgre1 Antibody (A08751) overnight at 4°C. DyLight®550 Conjugated Goat Anti-Rabbit IgG (BA1135) was used as secondary antibody at 1:500 dilution and incubated for 30 minutes at 37°C. Visualize using a fluorescence microscope and filter sets appropriate for the label used.

Click image to see more details
IHC analysis of F4/80/Adgre1 using anti-F4/80/Adgre1 antibody (A08751).
F4/80/Adgre1 was detected in a paraffin-embedded section of mouse kidney tissue. Heat mediated antigen retrieval was performed in EDTA buffer (pH 8.0, epitope retrieval solution). The tissue section was blocked with 10% goat serum. The tissue section was then incubated with 2 μg/ml rabbit anti-F4/80/Adgre1 Antibody (A08751) overnight at 4°C. Peroxidase Conjugated Goat Anti-rabbit IgG was used as secondary antibody and incubated for 30 minutes at 37°C. The tissue section was developed using HRP Conjugated Rabbit IgG Super Vision Assay Kit (Catalog # SV0002) with DAB as the chromogen.

Click image to see more details
IF analysis of F4/80/Adgre1 using anti-F4/80/Adgre1 antibody (A08751).
F4/80/Adgre1 was detected in a paraffin-embedded section of rat liver tissue. Heat mediated antigen retrieval was performed in EDTA buffer (pH 8.0, epitope retrieval solution). The tissue section was blocked with 10% goat serum. The tissue section was then incubated with 5 μg/mL rabbit anti-F4/80/Adgre1 Antibody (A08751) overnight at 4°C. Cy3 Conjugated Goat Anti-Rabbit IgG (BA1032) was used as secondary antibody at 1:500 dilution and incubated for 30 minutes at 37°C. Visualize using a fluorescence microscope and filter sets appropriate for the label used.

Click image to see more details
Pseudoephedrine + emodin inhibited (M1) macrophage and activated (M2) macrophage in LPS‐induced rats lung tissue. A F4/80 expression was determined using immunohistochemistry (n = 3). B F4/80 positive score was determined using ImageJ: negative (0), low positive (1+), positive (2+), high positive (3+). C – F CD86, CD206 expression was determined using immunofluorescence (n = 5). Data are expressed as mean ± S.D. ## p < 0.01, ### p < 0.001 vs. control group. **p < 0.01, ***p < 0.001 vs. LPS alone group. +++ p < 0.001 vs. combined treatment group (20 + 40 mg/kg)
Index in PubMed under a CC BY license. PMID: 35123524

Click image to see more details
ADCP assays with BMDMs. In vitro assay to determine elimination of Raji cells by macrophages. (A) BMDMs from WT and FcαRI Tg C57BL/6 mice were incubated with CFSE-labeled Raji cells at an E:T ratio of 5:1 in the presence of 10 μg/mL anti-CD20 antibodies. After a 4-h incubation, cells were transferred to a new tube and visualized via confocal microscopy. Representative images of ADCP mediated by anti-CD20 antibodies are shown. (B) BMDMs were labeled with APC-F4/80 antibodies and cocultured with CFSE-labeled Raji cells in the presence of the indicated antibodies. Phagocytosis of Raji cells was analyzed by FACS and quantified as the percentage of double-positive cells relative to total CFSE-positive cells and F4/80+cells. ** P < 0.01 using unpaired two-tailed t tests.
Index in PubMed under a CC BY license. PMID: 28454118

Click image to see more details
Effects of co-adjustment of TO901317 and tacrolimus on AR following liver transplantation in rats. A – D Hepatic pathological changes and apoptosis following co-adjustment with TO901317 and tacrolimus during AR (magnification, ×200; scale bar = 100 μm) (The area indicated by the red arrow shows inflammatory cell infiltration in the portal area and hepatic sinusoids, cholangitis and venulitis, as well as hepatic parenchymal cell damage). E , F The percentages of M1-type polarized macrophages in different groups were detected by flow cytometry, macrophages were separated with FITC-labeled F4/80, and M1-type polarization was separated with PE-labeled CD86. G ALT and AST levels in rat serum. H Survival rate of rats. n = 6 for each group. I Levels of TNF-α IL-6 and IL-1β in serum of different groups. Differences among groups were assessed by one-way ANOVA. n = 6, ns P > 0.05, *P < 0.05, **P < 0.01, ***P < 0.001
Index in PubMed under a CC BY license. PMID: 40087552

Click image to see more details
LXRα improves AR after liver transplantation by activating PI3K/AKT/mTOR pathway to regulate macrophage polarization. A , B Protein expression levels of PI3K/AKT/mTOR signaling pathway factors. C , D Detection of the proportion of M1 polarization by flow cytometry, macrophages were separated with FITC-labeled F4/80, and M1-type polarization was separated with PE-labeled CD86. E , F Pathological changes in the liver following treatment with TO901317 or LY294002 during AR (magnification, ×200; scale bar = 100 μm) (The area indicated by the red arrow shows inflammatory cell infiltration in the portal area and hepatic sinusoids, cholangitis and venulitis, as well as hepatic parenchymal cell damage). One-way ANOVA was used to determine the statistical differences between groups. n = 6, *P < 0.05, **P < 0.01, ***P < 0.001
Index in PubMed under a CC BY license. PMID: 40087552

Click image to see more details
Effects of ABCA1 in vivo. A , B Pathological changes in the liver following treatment with TO901317 and ABCA1 shRNA during AR (magnification, ×200/400; scale bar = 100 μm) (The area indicated by the red arrow shows inflammatory cell infiltration in the portal area and hepatic sinusoids, cholangitis and venulitis, as well as hepatic parenchymal cell damage). C , D Hepatic apoptosis following treatment with TO901317 and ABCA1 shRNA during AR (magnification, ×200; scale bar = 100 mm). E , F Protein expression levels of LXRα/ABCA1/MAPK and mTOR signaling pathway factors. E Detection of the proportion of M1 polarization by flow cytometry, macrophages were separated with FITC-labeled F4/80, and M1-type polarization was separated with PE-labeled CD86. One-way ANOVA was used to determine the statistical differences between groups. n = 6, ns P > 0.05, *P < 0.05, **P < 0.01, ***P < 0.001
Index in PubMed under a CC BY license. PMID: 40087552
Specific Publications For Anti-F4/80/Adgre1 Antibody (A08751)
Loading publications
Recommended Resources
Here are featured tools and databases that you might find useful.
- Boster's Pathways Library
- Protein Databases
- Bioscience Research Protocol Resources
- Data Processing & Analysis Software
- Photo Editing Software
- Scientific Literature Resources
- Research Paper Management Tools
- Molecular Biology Software
- Primer Design Tools
- Bioinformatics Tools
- Phylogenetic Tree Analysis
Customer Reviews
Have you used Anti-F4/80/Adgre1 Antibody?
Share your experimental results or join a short interview to earn up to $1,000 in product credits or other rewards.
0 Reviews For Anti-F4/80/Adgre1 Antibody
Customer Q&As
Have a question?
Find answers in Q&As, reviews.
Can't find your answer?
Submit your question
