This website uses cookies to ensure you get the best experience on our website.


- Table of Contents
Plan ALDH3A1 paraffin-section IHC around mainly cytoplasmic staining in squamous epithelia and stomach glands (HPA tissue IHC). The IHC-validated antibody A01121-4 has a 2–5 μg/mL recommended range (datasheet A01121-4); esophageal squamous cells provide a high-staining reference (HPA tissue IHC).

Expected localisation, validated protocols, controls and antibodies — the at-a-glance facts below, then the full design guide.
| Expected localisation | Mainly cytoplasmic staining in tissue (HPA tissue IHC) | |
| Staining pattern | Cytoplasmic signal in squamous epithelia and stomach glands (HPA tissue IHC) | |
| Antigen retrieval | EDTA pH 8.0 HIER, heat-mediated (datasheet A01121-4) | |
| Positive control | Esophagus+4 more · see all | |
| Negative control | Adipose tissue+4 more · see all |
| Fixation | Keep fixation consistent across sections (standard IHC practice; not target-specific); Matched tissue-IHC evidence does not establish the fixation claim. Validate the specimen-specific method before use. (selected-SKU IHC image A01121-4) | |
| Caveat | Antibody staining and RNA show medium consistency (HPA tissue IHC) | |
| Regulation | High in esophagus and stomach (UniProt) | |
| Isoform / epitope | No annotated isoforms; chain spans residues 2–453 and is cytoplasmic (UniProt) |
The catalog antibody’s IHC-P protocol (datasheet A01121-4) is accompanied by four published ALDH3A1 IHC protocols (PMC12246704; PMC12384013; PMC6966589; PMC4153422).
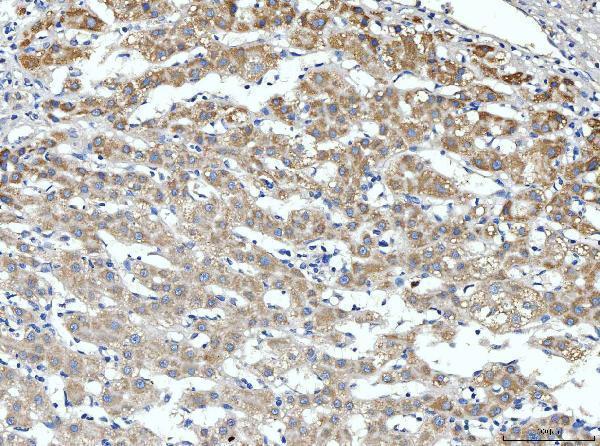
| Sample | Paraffin-embedded human liver cancer tissue; fixative not specified (datasheet A01121-4) |
| Fixation | Image fixative and duration unreported (datasheet A01121-4); verify before use. |
| Sectioning | 4–5 µm sections on charged slides (standard) |
| Deparaffinisation | Xylene, graded ethanol series to water (standard) |
| Antigen retrieval | Heat retrieval: EDTA pH 8.0 (datasheet A01121-4); 20 min, 95–100 °C (standard) |
| Peroxidase block | 3% H2O2, 10 min, room temperature (standard) |
| Blocking | 10% goat serum (datasheet A01121-4) |
| Primary antibody | Rabbit anti-ALDH3A1, 2-5 μg/ml (datasheet A01121-4) |
| Primary incubation | Overnight at 4 °C (datasheet A01121-4) |
| Detection | HRP-conjugated secondary, DAB chromogen (datasheet A01121-4) |
| Counterstain | Hematoxylin, blue, dehydrate and mount (standard) |
| Expected result | ALDH3A1-positive staining in squamous epithelial cells of esophagus (HPA tissue IHC: High). HPA tissue profile: Mainly cytoplasmic expression in several tissues, most abundant in squamous epithelia and stomach. No signal in the no-primary control. |
ALDH3A1 should appear mainly cytoplasmic in IHC, especially in esophageal and oral squamous epithelial cells, skin basal-layer cells, and stomach glandular cells (HPA: High in each; mainly cytoplasmic tissue profile). UniProt places ALDH3A1 in the cytoplasm and reports no transmembrane segment (UniProt P30838). HPA rates the tissue profile Enhanced, with medium consistency between antibody staining and RNA expression (HPA: reliability description).
| Strong cytoplasmic staining in esophageal or oral squamous epithelium, skin basal cells, or stomach glands. | This matches the reported high-staining cells and principal tissue compartment (HPA: High in these cells; mainly cytoplasmic profile). Compare the stained cells with tissue morphology before scoring the whole section as positive (general IHC practice). |
| Predominantly nuclear staining or a continuous membrane rim in an IHC section. | This does not match the principal tissue IHC pattern and warrants a specificity check (HPA: mainly cytoplasmic tissue profile). ICC-IF separately reports additional nucleoplasm and plasma-membrane localization, so compartment alone cannot establish an artefact (HPA: subcellular locations). |
| Strong signal in adipocytes or bone-marrow hematopoietic cells, with little signal in expected epithelial cells. | These cell populations are reported as not detected (HPA: adipocytes; bone-marrow hematopoietic cells). Check cell identification and controls; antibody cross-reactivity or endogenous chromogenic activity are possible explanations (general IHC practice). |
| Even chromogen haze across epithelium, stroma, and blank areas. | A uniform haze obscures the cell-restricted pattern expected in high-staining tissues (HPA: positive cell types). Inadequate blocking, washing, or chromogen control can produce diffuse background (general IHC practice); haze alone does not establish ALDH3A1 expression. |
| No signal in well-preserved esophageal squamous epithelium or stomach glands. | These are reported high-staining populations, so first assess tissue identity and the staining run (HPA: High in esophageal squamous epithelial cells and stomach glandular cells). A blank section does not by itself establish absent ALDH3A1 (general IHC practice). |
| Cell type and tissue | Interpret intensity within the named population: HPA reports High staining in esophageal and oral squamous cells, skin basal cells, and stomach glands, but Medium in epididymal and rectal glands (HPA: tissue IHC). A single intensity threshold across tissues would miss that context (general IHC practice). |
| Primary compartment | UniProt assigns ALDH3A1 to the cytoplasm and lists no transmembrane segment (UniProt P30838). HPA's tissue IHC profile is mainly cytoplasmic; use morphology and the cytoplasmic distribution together when judging chromogenic signal (HPA: tissue IHC profile; general IHC practice). |
| Strength of reference evidence | The tissue IHC profile is Enhanced, yet its antibody-staining versus RNA consistency is Medium (HPA: reliability and description). HPA also lists 3 antibodies with Enhanced IHC validation (HPA: HPA051150, HPA063783, CAB045957). These labels support a reference pattern, not certainty for every specimen. |
| Retrieval and detection | No ALDH3A1-specific retrieval or fixation effect is supplied (UniProt P30838; HPA: supplied tissue IHC record). If a validated positive is blank, inspect the run's retrieval and detection steps as general IHC troubleshooting; do not infer target-specific fixation sensitivity from that result (general IHC practice). |
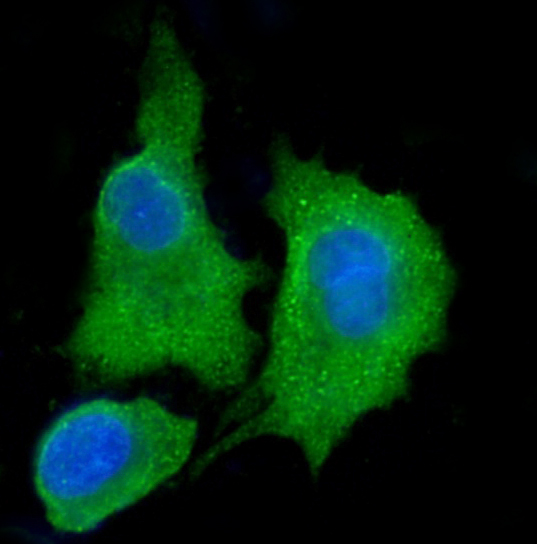
| IF/ICC Q&A: Should fluorescence copy the IHC pattern? | HPA reports cytosol and plasma membrane as main ICC-IF locations, with nucleoplasm and vesicles as additional locations (HPA: subcellular record). That IF observation adds compartment context; the paraffin IHC decision here remains anchored to HPA's mainly cytoplasmic tissue profile. |
| Situation | Likely cause | Next action |
|---|---|---|
| Known high-staining epithelium is blank. | A failed staining run, incorrect tissue selection, or low assay sensitivity is possible (general IHC practice); HPA reports High staining in esophageal squamous cells (HPA: esophagus). | Confirm the cell population and check a run-level positive control, retrieval, primary-antibody step, and detection controls before calling the specimen negative (general IHC practice). |
| Only a weak signal appears in epididymal or rectal glands. | Medium staining is the reported reference level for these cells (HPA: epididymis and rectum). | Compare with a High reference tissue and assess localization within glandular cells before treating the weaker result as assay failure (HPA: tissue IHC levels; general IHC practice). |
| Adipocytes or bone-marrow hematopoietic cells stain strongly. | Those populations are reported as not detected (HPA: adipose tissue and bone marrow); nonspecific primary binding or endogenous detection activity is possible (general IHC practice). | Review morphology and include appropriate no-primary and detection controls to locate the unwanted signal (general IHC practice). |
| Nuclei dominate the chromogenic signal. | The result conflicts with the mainly cytoplasmic tissue IHC profile (HPA: tissue IHC), although nucleoplasm is an additional ICC-IF location (HPA: subcellular record). | Check counterstain, chromogen distribution, and antibody controls; interpret any residual nuclear signal with the assay and tissue context (general IHC practice). |
| A uniform brown veil hides cell borders. | Background from blocking, washing, or chromogen development can obscure the cell-restricted pattern (general IHC practice; HPA: tissue IHC profile). | Compare no-primary and detection controls, then adjust the implicated general IHC step and reassess whether the expected epithelial cells remain distinct (general IHC practice). |
| A sharp membrane rim dominates an IHC-positive area. | HPA's tissue IHC profile is mainly cytoplasmic, while its ICC-IF record includes plasma membrane localization (HPA: tissue IHC and subcellular records). | Check whether cytoplasmic staining is also present and review controls before scoring the rim as specific in the paraffin section (general IHC practice). |

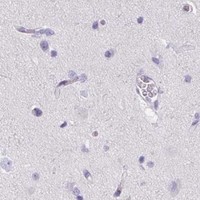


Comprehensive Human Protein Atlas IHC scoring per tissue (reliability: Enhanced — Medium consistency between antibody staining and RNA expression data.). Rows are taken directly from the HPA tissue chart — click any row's HPA link to view the source.
| Tissue | Cell type | Level | Evidence | Source |
|---|---|---|---|---|
| Esophagus | Squamous epithelial cells | High | Protein (IHC) | HPA → |
| Oral mucosa | Squamous epithelial cells | High | Protein (IHC) | HPA → |
| Skin | Cells in basal layer | High | Protein (IHC) | HPA → |
| Stomach | Glandular cells | High | Protein (IHC) | HPA → |
| Epididymis | Glandular cells | Medium | Protein (IHC) | HPA → |
| Tissue | Cell type | Level | Evidence | Source |
|---|---|---|---|---|
| Adipose tissue | Adipocytes | Not detected | Protein (IHC) | HPA → |
| Adrenal gland | Glandular cells | Not detected | Protein (IHC) | HPA → |
| Appendix | Glandular cells | Not detected | Protein (IHC) | HPA → |
| Bone marrow | Hematopoietic cells | Not detected | Protein (IHC) | HPA → |
| Breast | Adipocytes | Not detected | Protein (IHC) | HPA → |
Troubleshoot ALDH3A1 staining in paraffin sections by checking retrieval, compartment, controls and cell-specific scoring before interpreting signal.
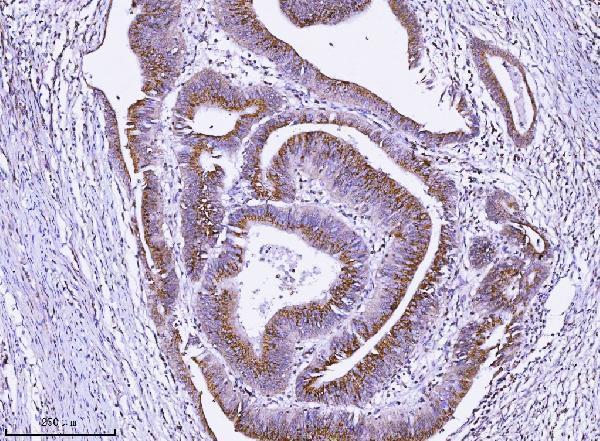
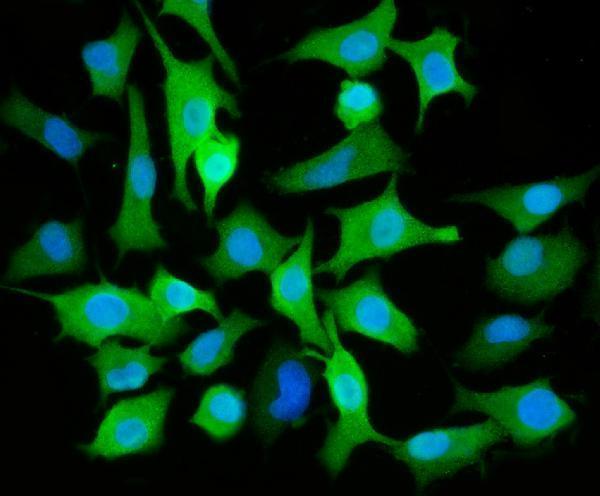
Anti-ALDH3A1 antibodies have IHC images from human paraffin-embedded liver and rectal cancer sections (catalog image captions) and IF images from A549 cells (catalog image captions).
A01121-4 has IHC data from a human liver cancer section and IF data from A549 cells (A01121-4 image captions); A01121-5 and PA2074 have IHC data from human rectal cancer sections (their image captions). A01121-3 has IF data from A549 cells and lists human, mouse, and rat reactivity (A01121-3 image caption; catalog reactivity).
Which to pick: For human paraffin-section IHC, choose A01121-4 for its liver cancer image or A01121-5 or PA2074 for their rectal cancer images (respective image captions); each IHC caption reports EDTA pH 8 retrieval and 2 μg/ml primary antibody, but does not report the fixative (respective image captions). For IF/ICC, choose A01121-3 or A01121-4: both list IF and ICC and show staining in A549 cells (catalog applications; respective IF image captions). For mouse or rat work, A01121-3 lists those species and is described as polyclonal, though its IF image is from A549 cells (A01121-3 catalog reactivity; dilution data; IF image caption).