This website uses cookies to ensure you get the best experience on our website.


- Table of Contents
Plan APAF1 staining in paraffin sections around its expected cytoplasmic location (UniProt) and the tissue IHC pattern, which is most abundant in immune cell subsets (HPA tissue IHC). Use bone marrow hematopoietic cells as a positive reference (HPA tissue IHC), and check antibody epitope coverage across the six isoforms (UniProt).

Expected localisation, validated protocols, controls and antibodies — the at-a-glance facts below, then the full design guide.
| Expected localisation | Cytoplasm expected; cytoplasmic tissue staining observed (UniProt; HPA tissue IHC) | |
| Staining pattern | General cytoplasmic stain, most abundant in immune cell subsets (HPA tissue IHC) | |
| Antigen retrieval | Citrate pH 6.0 HIER, 95–98 °C, 20 min (rule: cytoplasmic / membrane antigen) | |
| Positive control | Bone marrow+4 more · see all | |
| Negative control | Adipose tissue+4 more · see all |
| Fixation | Keep fixation consistent (standard IHC practice; not target-specific); Matched tissue-IHC evidence does not establish the fixation claim. Validate the specimen-specific method before use. (selected-SKU IHC image A00889) | |
| Caveat | Marrow endogenous peroxidase can mimic chromogenic signal (HPA tissue IHC; standard IHC practice) | |
| Regulation | Stimulus-dependent regulation is unreported (UniProt) | |
| Isoform / epitope | 6 isoforms; verify that the antibody epitope is shared (UniProt) |
The catalog antibody protocol is followed by published APAF1 IHC methods for solitary fibrous tumor, pancreatic ductal adenocarcinoma, and mouse lung (PMC6746689; PMC4775273; PMC6892980).
| Sample | Tissue sections; selected-image fixative not specified (standard IHC workflow) |
| Fixation | Image fixative and duration unreported (datasheet A00889); verify before use. |
| Sectioning | 4–5 µm sections on charged slides (standard) |
| Deparaffinisation | Xylene, graded ethanol series to water (standard) |
| Antigen retrieval | Heat-induced epitope retrieval in citrate buffer, pH 6.0, 20 min at 95–98 °C (standard rule: cytoplasmic / membrane antigen) |
| Peroxidase block | 3% H2O2, 10 min, room temperature (standard) |
| Blocking | 10% normal serum of the secondary host, 30 min, room temperature (standard) |
| Primary antibody | Rabbit anti-APAF1, 1 μg/mL (datasheet A00889) |
| Primary incubation | Overnight at 4 °C (standard) |
| Detection | HRP-polymer secondary, DAB chromogen 5–10 min (standard) |
| Counterstain | Hematoxylin, blue, dehydrate and mount (standard) |
| Expected result | APAF1-positive staining in hematopoietic cells of bone marrow (HPA tissue IHC: High). HPA tissue profile: General cytoplasmic expression, most abundant in subsets of immune cells. No signal in the no-primary control. |
APAF1 is a cytoplasmic protein with no transmembrane segment (UniProt O14727 localization and topology). In paraffin sections, expect cytoplasmic staining, strongest in bone marrow hematopoietic cells; several glandular and endothelial populations show medium staining (HPA tissue IHC). HPA describes general cytoplasmic expression, most abundant in subsets of immune cells, but rates agreement between staining and RNA as medium (HPA tissue IHC: Enhanced reliability description).
| Bone marrow hematopoietic cells show clear cytoplasmic chromogenic staining. | This is the strongest listed tissue pattern: HPA scores these cells High (HPA tissue IHC: bone marrow). Assess staining within the hematopoietic cells rather than calling an entire marrow section uniformly positive; the HPA profile emphasizes subsets of immune cells (HPA tissue IHC profile). |
| Appendix or duodenal glandular cells, or colon endothelial cells, show moderate cytoplasmic staining. | These are plausible positives: each named cell population is scored Medium (HPA tissue IHC: appendix, duodenum, colon). Their lower reported intensity makes them less decisive than High bone marrow hematopoietic cells when judging a weak run (HPA tissue IHC: bone marrow). |
| A section shows predominantly nuclear staining with little cytoplasmic signal. | For tissue IHC, this departs from HPA's general cytoplasmic profile and UniProt's cytoplasmic assignment (HPA tissue IHC profile; UniProt O14727 localization). Review morphology and controls before calling it APAF1. HPA separately reports nucleoplasm in ICC-IF, so nuclear signal alone is not universal proof of artefact (HPA subcellular ICC-IF). |
| Cells reported as Not detected stain strongly, such as adipocytes or heart muscle cardiomyocytes. | That pattern conflicts with the cited tissue observations (HPA tissue IHC: adipocytes and cardiomyocytes, Not detected). Consider cross-reactivity or endogenous chromogenic activity, then compare a matched negative control and the expected cellular compartment (general IHC practice; UniProt O14727 localization). A conflicting cell is a warning, not proof of either cause. |
| Color spreads across extracellular spaces or broadly obscures cell boundaries. | This is background rather than an interpretable cytoplasmic cell pattern (general IHC interpretation; HPA tissue IHC profile). Compare the negative control, counterstain and cell morphology before scoring. Diffuse staining confined to identifiable cytoplasm can still fit the reported APAF1 localization (UniProt O14727 localization). |
| Tissue and cell population | APAF1 is broadly expressed at the tissue level (UniProt O14727 tissue specificity), yet HPA staining varies by annotated cell type: High in bone marrow hematopoietic cells, Medium in selected glandular and endothelial cells, and Not detected in several listed populations (HPA tissue IHC). Select and score the actual cell population. |
| Evidence and antibody validation | The tissue profile carries Enhanced reliability with medium staining–RNA consistency, and HPA cautions that some stained cells or structures are unannotated (HPA tissue IHC reliability description). HPA031373 has Enhanced IHC validation; CAB069399 has Approved IHC validation (HPA antibody validation). These labels support interpretation of observed patterns without guaranteeing every antibody preparation. |
| Isoforms and processing | UniProt lists six APAF1 isoforms and a single 1–1248 chain, with no signal peptide or propeptide (UniProt O14727 isoforms and processing). Isoform 6 is less effective at inducing apoptosis (UniProt O14727 function). Without an antibody epitope in the payload, staining cannot identify an isoform or establish its apoptotic activity. |
| What should IF/ICC show? | HPA reports mainly nucleoplasm and cytosol, with additional Golgi localization, in ICC-IF images from A-431, U-251MG and U2OS (HPA subcellular ICC-IF). This is a separate cell-imaging observation from the cytoplasmic tissue IHC profile; HPA031373 has Uncertain ICC validation (HPA antibody validation). |
| Situation | Likely cause | Next action |
|---|---|---|
| No signal in bone marrow hematopoietic cells. | The result conflicts with a High HPA observation, though HPA notes only medium staining–RNA consistency (HPA tissue IHC: bone marrow and reliability description). | Confirm that hematopoietic cells are present and identifiable. Check the assay's positive control, detection reagents and the IHC-validated antibody's documented retrieval and dilution settings (general IHC practice); no APAF1-specific fixation sensitivity is reported here. |
| Strong signal appears only in nuclei on tissue IHC. | The pattern differs from cytoplasmic tissue expression (HPA tissue IHC profile; UniProt O14727 localization). ICC-IF nucleoplasmic staining alone does not validate a nuclear-only tissue result (HPA subcellular ICC-IF). | Inspect cellular boundaries and counterstain, then compare positive and negative controls before assigning compartment or specificity (general IHC practice). |
| Strong staining appears in adipocytes or cardiomyocytes. | Those cell populations are listed as Not detected, so the result needs verification (HPA tissue IHC: adipose tissue and heart muscle). Cross-reactivity or endogenous detection activity are possible explanations (general IHC practice). | Check the stained cell identity and cytoplasmic distribution. Use a matched negative control and, for an enzyme-based chromogen, review the appropriate endogenous activity block (general IHC practice). |
| Diffuse color obscures most of the section. | Unresolved background prevents cell-level interpretation (general IHC practice); HPA describes a cytoplasmic pattern concentrated in immune-cell subsets (HPA tissue IHC profile). | Compare a negative control and review blocking, antibody concentration, washes and detection development under the assay's standard conditions (general IHC practice). Score only cells whose boundaries remain clear. |
| Only faint signal appears in a listed Medium population. | A Medium HPA observation can be harder to distinguish from background than the High bone marrow observation (HPA tissue IHC: appendix, duodenum, colon and bone marrow). | Check a bone marrow positive control if available, verify that the listed cell type is present, and assess signal against its local background before changing the assay (general IHC practice; HPA tissue IHC: bone marrow). |
| A granular or perinuclear focus is treated as the sole tissue-IHC positive pattern. | HPA's additional Golgi location comes from ICC-IF, while its tissue IHC summary describes general cytoplasmic expression (HPA subcellular ICC-IF; HPA tissue IHC profile). | Reassess the entire cytoplasm and compare cell-level staining with an appropriate positive tissue and negative control. Keep the ICC-IF location as context, not a tissue-IHC scoring rule (general IHC interpretation; HPA tissue IHC profile). |
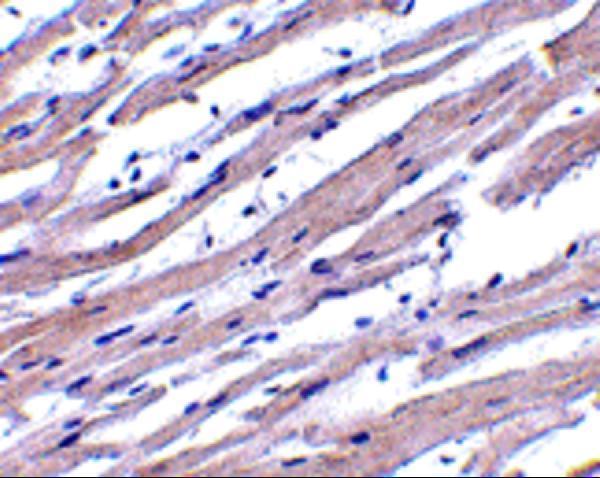
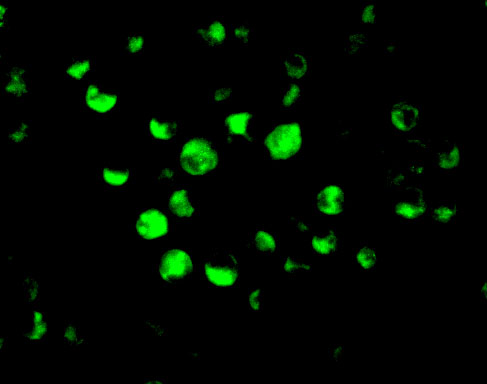
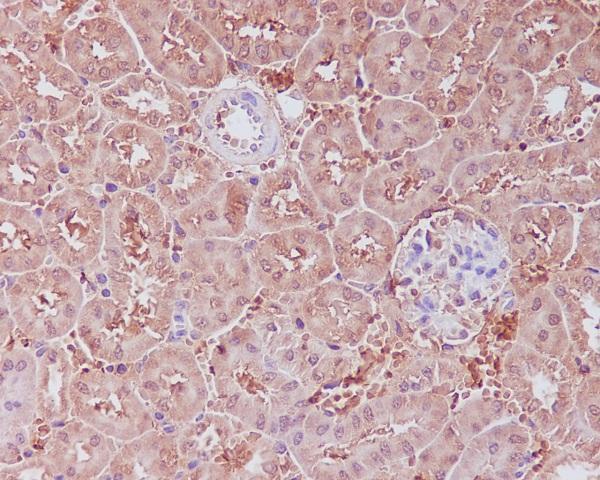
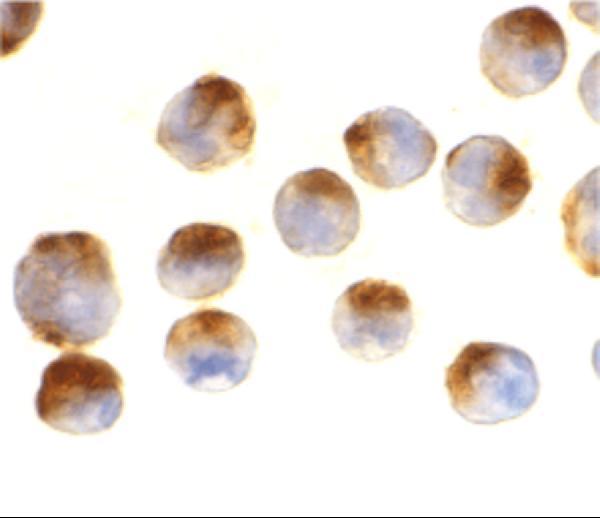


Comprehensive Human Protein Atlas IHC scoring per tissue (reliability: Enhanced — Medium consistency between antibody staining and RNA expression data. Antibody staining in cells/structures not annotated, view images.). Rows are taken directly from the HPA tissue chart — click any row's HPA link to view the source.
| Tissue | Cell type | Level | Evidence | Source |
|---|---|---|---|---|
| Bone marrow | Hematopoietic cells | High | Protein (IHC) | HPA → |
| Appendix | Glandular cells | Medium | Protein (IHC) | HPA → |
| Colon | Endothelial cells | Medium | Protein (IHC) | HPA → |
| Duodenum | Glandular cells | Medium | Protein (IHC) | HPA → |
| Endometrium | Glandular cells | Medium | Protein (IHC) | HPA → |
| Tissue | Cell type | Level | Evidence | Source |
|---|---|---|---|---|
| Adipose tissue | Adipocytes | Not detected | Protein (IHC) | HPA → |
| Adrenal gland | Glandular cells | Not detected | Protein (IHC) | HPA → |
| Cerebellum | Cells in granular layer | Not detected | Protein (IHC) | HPA → |
| Cervix | Glandular cells | Not detected | Protein (IHC) | HPA → |
| Esophagus | Squamous epithelial cells | Not detected | Protein (IHC) | HPA → |
Troubleshoot APAF1 staining in chromogenic paraffin section IHC using compartment, cell type and protocol controls; the IF/ICC entry addresses the separate fluorescence workflow.
Three APAF1 antibodies have IHC images from human heart tissue (A00889 caption), paraffin-embedded mouse kidney (M00889 caption), and K562 cells (M00889-2 caption); A00889 also has a K562 IF image (A00889 caption).
A00889 shows IHC in human heart tissue and IF in K562 cells (A00889 image captions); M00889 shows IHC in paraffin-embedded mouse kidney (M00889 IHC caption). M00889-2 shows IHC in K562 cells (M00889-2 IHC caption); all three list Human reactivity (catalog reactivity).
Which to pick: For paraffin-section tissue IHC, choose M00889: its mouse-kidney image specifies paraffin embedding, but the fixative is unreported (M00889 IHC caption). For IF with image evidence, choose A00889 (A00889 IF caption); for ICC, M00889 lists ICC/IF and is a rabbit monoclonal (M00889 catalog applications/clone). For cross-species IHC, A00889 and mouse monoclonal M00889-2 list Human, Mouse, and Rat reactivity (catalog reactivity/host/clone); their IHC images show human heart tissue and K562 cells, respectively (A00889 and M00889-2 IHC captions).