This website uses cookies to ensure you get the best experience on our website.


- Table of Contents
Plan ATG5 IHC-P using the reported cytoplasmic staining in intestinal glandular cells (HPA tissue IHC). Compare colon glandular cells reported as high with cardiomyocytes reported as undetected, and account for stronger protein expression in apoptotic cells (HPA tissue IHC; UniProt).

Expected localisation, validated protocols, controls and antibodies — the at-a-glance facts below, then the full design guide.
| Expected localisation | Cytoplasmic staining in several tissues (HPA tissue IHC) | |
| Staining pattern | Cytoplasmic staining in intestinal glandular cells (HPA tissue IHC) | |
| Antigen retrieval | Citrate pH 6.0 HIER, 95–98 °C, 20 min (rule: cytoplasmic / membrane antigen) | |
| Positive control | Appendix+4 more · see all | |
| Negative control | Bone marrow+4 more · see all |
| Fixation | Matched tissue-IHC evidence does not establish the fixation claim. Validate the specimen-specific method before use. (selected-SKU IHC image A00240) | |
| Caveat | Apoptotic cells may stain much more strongly (UniProt) | |
| Regulation | Protein rises sharply in apoptotic cells (UniProt) | |
| Isoform / epitope | 2 isoforms, Long and Short; epitope coverage unknown (UniProt) |
The catalog antibody’s IHC-P protocol is paired with 3 published ATG5 IHC protocols (PMC7609390; PMC5489357; PMC5458246).
| Sample | Tissue sections; selected-image fixative not specified (standard IHC workflow) |
| Fixation | Image fixative and duration unreported (datasheet A00240); verify before use. |
| Sectioning | 4–5 µm sections on charged slides (standard) |
| Deparaffinisation | Xylene, graded ethanol series to water (standard) |
| Antigen retrieval | Heat-induced epitope retrieval in citrate buffer, pH 6.0, 20 min at 95–98 °C (standard rule: cytoplasmic / membrane antigen) |
| Peroxidase block | 3% H2O2, 10 min, room temperature (standard) |
| Blocking | 10% normal serum of the secondary host, 30 min, room temperature (standard) |
| Primary antibody | Rabbit anti-ATG5, 2.5 μg/mL (datasheet A00240) |
| Primary incubation | Overnight at 4 °C (standard) |
| Detection | HRP-polymer secondary, DAB chromogen 5–10 min (standard) |
| Counterstain | Hematoxylin, blue, dehydrate and mount (standard) |
| Expected result | ATG5-positive staining in glandular cells of appendix (HPA tissue IHC: High). HPA tissue profile: Cytoplasmic expression in several tissues, mainly in intestines and thyroid gland. No signal in the no-primary control. |
ATG5 is cytoplasmic and associates with preautophagosomal membranes; it has no transmembrane segment (UniProt Q9H1Y0). In paraffin-section IHC, expect cytoplasmic staining in several tissues, including glandular cells of the colon, duodenum and rectum and respiratory epithelial cells of the bronchus (HPA: tissue IHC). HPA rates the tissue staining Approved, with medium consistency between staining and RNA expression; interpret intensity alongside cell identity and controls (HPA: reliability).
| Clear cytoplasmic staining in colon or duodenal glandular cells, with identifiable cell boundaries. | This fits the reported high signal in those cells and ATG5's cytoplasmic location (HPA: High in colon and duodenum glandular cells; UniProt Q9H1Y0). Compare cells within the same section before judging overall intensity. |
| A predominantly nuclear pattern replaces the expected cytoplasmic signal. | Treat dominant nuclear staining as an unexpected pattern requiring a specificity check, rather than as evidence of ATG5 redistribution (UniProt Q9H1Y0: cytoplasm; HPA: cytoplasmic tissue profile). Review the negative control and staining distribution. |
| Strong staining appears mainly in a cell population reported as not detected. | For example, signal in heart muscle cardiomyocytes conflicts with the HPA observation and warrants checks for cross-reactivity or endogenous detection activity (HPA: cardiomyocytes Not detected). A discordant cell alone does not prove either cause. |
| Diffuse colour covers stroma, lumens or the slide without a clear cellular pattern. | This is difficult to score as ATG5: the reference pattern is cellular and cytoplasmic (HPA: tissue IHC profile; UniProt Q9H1Y0). Uneven background can arise from detection or wash conditions (general IHC practice). |
| No cytoplasmic signal is visible in an otherwise intact positive tissue section. | First check the assay with a reported high-signal cell population, such as colon glandular cells (HPA: High in colon glandular cells). A blank slide is inconclusive until section integrity, detection and antibody performance are checked (general IHC practice). |
| Cell-type reference and reliability | HPA reports high signal in appendix, colon, duodenum and rectum glandular cells and bronchus respiratory epithelium; its Approved tissue profile has medium staining–RNA consistency (HPA: tissue IHC). Use these as pattern references, not guaranteed results for every specimen. |
| Low or undetected reference groups | HPA reports low signal in kidney tubule cells and adipocytes, and no detected signal in cardiomyocytes or skeletal myocytes (HPA: tissue IHC). These observations help assess contrast, but HPA also reports low tissue RNA specificity; absence in one cell group does not establish a universal negative. |
| Subcellular context | ATG5 is cytoplasmic and associates with preautophagosomal membranes; its conjugate can leave those membranes near autophagosome completion (UniProt Q9H1Y0). Routine chromogenic IHC should be judged by cellular compartment and morphology rather than requiring resolvable puncta (general IHC practice). |
| Molecular forms | UniProt lists Long and Short isoforms and ATG12 conjugation (UniProt Q9H1Y0). The supplied evidence gives no antibody epitope or isoform coverage, so an intensity difference cannot be assigned to one form from IHC appearance alone. |
| IF/ICC Q&A | Q: Should IF/ICC show the same broad pattern as tissue IHC? A: HPA reports approved localization at the centrosome, primary cilium transition zone and basal body, with additional vesicles (HPA: subcellular ICC-IF). These higher-resolution observations inform interpretation; they do not set a required chromogenic IHC puncta pattern. |
| Situation | Likely cause | Next action |
|---|---|---|
| Known high-signal glandular cells are blank. | The result conflicts with the HPA reference, but the supplied sources do not identify a target-specific fixation or retrieval failure (HPA: High in colon glandular cells). | Check tissue preservation, primary-antibody application, detection reagents and a concurrent positive control; review the assay's validated retrieval conditions if available (general IHC practice). Do not infer ATG5 fixation sensitivity from this result. |
| Nuclei stain more strongly than cytoplasm. | The compartment conflicts with the reported cytoplasmic tissue pattern (HPA: tissue IHC profile; UniProt Q9H1Y0). Background or cross-reactivity remains possible; the pattern alone cannot identify which. | Compare a no-primary control and a reported high-signal tissue, then score signal by compartment and cell type (general IHC practice; HPA: High in colon glandular cells). |
| Broad brown haze obscures cell boundaries. | Acellular or diffuse colour does not match the HPA cellular cytoplasmic profile (HPA: tissue IHC); detection background or insufficient washing can obscure localization (general IHC practice). | Inspect the no-primary control and tissue edges, review blocking and wash steps, and only interpret cells whose boundaries remain clear (general IHC practice). |
| A reported undetected cell population stains strongly. | Signal in cardiomyocytes or skeletal myocytes disagrees with those HPA observations (HPA: Not detected in cardiomyocytes and skeletal myocytes). Cross-reactivity or endogenous detection activity is possible, not proven. | Check a no-primary control, compare a reported high-signal cell group in the same run, and investigate whether the unexpected signal follows tissue rather than cellular boundaries (general IHC practice; HPA: tissue IHC). |
| Only a few fine puncta are visible, without convincing cytoplasmic cell staining. | UniProt describes preautophagosomal association, while HPA's centrosome and cilium observations come from ICC-IF (UniProt Q9H1Y0; HPA: subcellular ICC-IF). Puncta alone are insufficient to establish the expected tissue IHC result. | Reassess morphology and the broader cytoplasmic pattern in a reported high-signal cell type; compare controls before scoring puncta as specific (HPA: tissue IHC; general IHC practice). |
| Different specimens show unequal staining intensity. | HPA records high, low and undetected cell groups, and rates tissue staining–RNA consistency as medium (HPA: tissue IHC; HPA: reliability). Intensity variation alone does not demonstrate a change in autophagic activity. | Compare the same cell type under matched staining and scoring conditions, document the compartment, and use appropriate controls before assigning biological meaning (general IHC practice; UniProt Q9H1Y0: cytoplasm). |
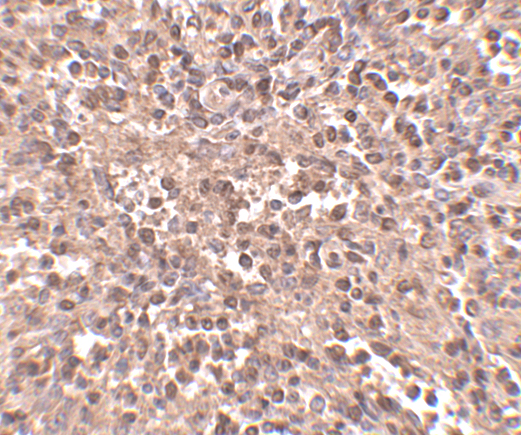
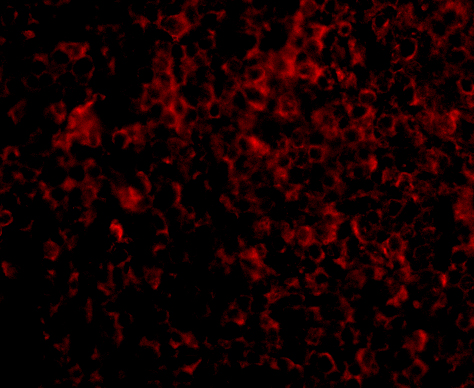


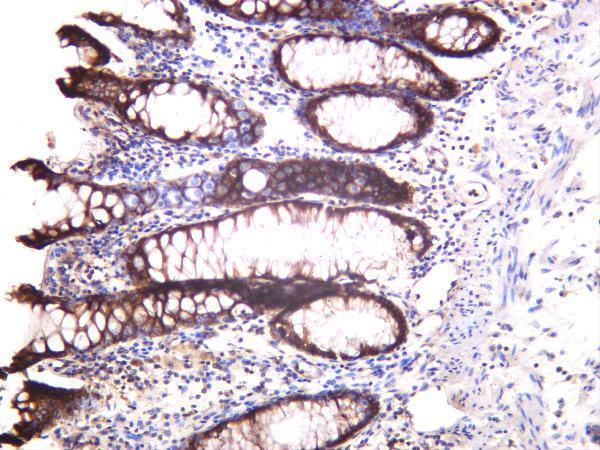
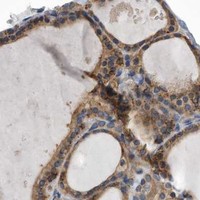


Comprehensive Human Protein Atlas IHC scoring per tissue (reliability: Approved — Medium consistency between antibody staining and RNA expression data.). Rows are taken directly from the HPA tissue chart — click any row's HPA link to view the source.
| Tissue | Cell type | Level | Evidence | Source |
|---|---|---|---|---|
| Appendix | Glandular cells | High | Protein (IHC) | HPA → |
| Bronchus | Respiratory epithelial cells | High | Protein (IHC) | HPA → |
| Colon | Glandular cells | High | Protein (IHC) | HPA → |
| Duodenum | Glandular cells | High | Protein (IHC) | HPA → |
| Gallbladder | Glandular cells | High | Protein (IHC) | HPA → |
| Tissue | Cell type | Level | Evidence | Source |
|---|---|---|---|---|
| Bone marrow | Hematopoietic cells | Not detected | Protein (IHC) | HPA → |
| Caudate | Glial cells | Not detected | Protein (IHC) | HPA → |
| Heart muscle | Cardiomyocytes | Not detected | Protein (IHC) | HPA → |
| Hippocampus | Glial cells | Not detected | Protein (IHC) | HPA → |
| Liver | Cholangiocytes | Not detected | Protein (IHC) | HPA → |
Troubleshoot ATG5 staining in paraffin sections by checking retrieval, cellular pattern, controls and scoring before interpreting changes in signal.
Anti-ATG5 antibodies have IHC images from human spleen, ovarian cancer paraffin sections, and colon (catalog IHC captions); IF images show human spleen cells, HeLa cells, and Raji cells (catalog IF captions).
A00240 has human spleen IHC and human spleen cell and HeLa IF images; M00240 has a paraffin-embedded human ovarian cancer IHC image and a Raji cell IF image (catalog image captions). M00240-2 has a human colon IHC image and lists IF among its applications, without an IF image in the payload (catalog image captions; catalog applications).
Which to pick: For paraffin tissue IHC, choose M00240: its own image caption identifies a paraffin-embedded human ovarian cancer section; the fixative is unreported (M00240 IHC image caption). For IF/ICC, choose M00240 because both applications are listed and its IF image shows Raji cells (M00240 catalog applications; M00240 IF image caption). For work across species, A00240, M00240, and M00240-2 each list Human, Mouse, and Rat reactivity, while their supplied IHC images show human samples (catalog reactivity; catalog IHC image captions).