ATP1A1 / Sodium/potassium-transporting ATPase subunit alpha-1 · IHC design guide

Design Immunohistochemistry for ATP1A1

Plan chromogenic paraffin IHC for ATP1A1 using kidney collecting ducts as a high-staining reference (HPA tissue IHC). Score membrane staining by cell type and compare its distribution with the expected basolateral location (UniProt).

Evidence assembled Oct 2026 · For research use; verify linked source records and product datasheet before use
Immunohistochemistry protocol sheet for ATP1A1 (IHC for ATP1A1): expected localisation Membranous in tissue (HPA tissue IHC); basolateral expected (UniProt), antibody PB9482, validated IHC image, and IHC protocol steps
Printable ATP1A1 IHC protocol sheet — expected localisation Membranous in tissue (HPA tissue IHC); basolateral expected (UniProt), antibody PB9482, controls and protocol steps. Open the full ATP1A1 IHC guide →

ATP1A1 Immunohistochemistry Experimental Design Guide

Expected localisation, validated protocols, controls and antibodies — the at-a-glance facts below, then the full design guide.

Must know before staining
Expected localisation Membranous in tissue (HPA tissue IHC); basolateral expected (UniProt)
Staining pattern Membranous staining in most tissues (HPA tissue IHC)
Antigen retrieval EDTA pH 8.0 HIER, heat-mediated (datasheet PB9482)
Positive control ⓘ Adrenal gland+4 more · see all
Negative control ⓘ Adipose tissue+4 more · see all
Important caveats
Reasons your staining may differ from the expected pattern.
Fixation Keep paraffin-section fixation consistent (standard IHC practice; not target-specific)
Caveat RNA and IHC show medium consistency (HPA tissue IHC)
Regulation Alpha-isoform expression varies by tissue (UniProt)
Isoform / epitope 4 isoforms; map the epitope to cytoplasmic or extracellular regions (UniProt)
Section 1

Recommended ATP1A1 IHC & IF Protocols

The catalog antibody’s IHC-P protocol is followed by three published ATP1A1 chromogenic IHC protocols for tumor sections, breast cancer tissue microarrays, and kidney sections (PMC12442677; PMC11083557; PMC9204326).

Recommended immunohistochemistry (IHC-P) protocol parameters
SampleParaffin-embedded human ovarian cancer tissue; fixative not specified (datasheet PB9482)
FixationImage fixative and duration unreported (datasheet PB9482); verify before use.
Sectioning4–5 µm sections on charged slides (standard)
DeparaffinisationXylene, graded ethanol series to water (standard)
Antigen retrievalHeat retrieval: EDTA pH 8.0 (datasheet PB9482); 20 min, 95–100 °C (standard)
Peroxidase block3% H2O2, 10 min, room temperature (standard)
Blocking10% goat serum (datasheet PB9482)
Primary antibodyRabbit anti-ATP1A1, 2-5 μg/ml (datasheet PB9482)
Primary incubationOvernight at 4 °C (datasheet PB9482)
DetectionHRP-conjugated secondary, DAB chromogen (datasheet PB9482)
CounterstainHematoxylin, blue, dehydrate and mount (standard)
Expected resultATP1A1-positive staining in glandular cells of adrenal gland (HPA tissue IHC: High). HPA tissue profile: Membranous expression in most tissues. No signal in the no-primary control.
💡Decision noteStart with heat-mediated EDTA retrieval at pH 8.0 for the catalog antibody (PB9482 datasheet); citrate at pH 6.8 is a published alternative using another antibody (PMC11083557).
Section 2

What Is the Expected ATP1A1 Staining Pattern?

ATP1A1 is a ten-pass membrane protein found at the cell membrane, including basolateral membranes (UniProt P05023 topology and subcellular annotation). In paraffin-section IHC, expect predominantly membranous staining in many tissues, with high staining in kidney collecting ducts and glandular cells of the breast and adrenal gland (HPA tissue IHC). HPA rates the tissue IHC evidence Enhanced, while reporting medium consistency between staining and RNA expression (HPA tissue IHC).

What am I looking at on my slide?
Distinct cell borders in kidney collecting ducts, with strong staining relative to nearby background.This fits the expected positive: HPA reports High staining in collecting ducts, and UniProt places ATP1A1 at the cell membrane (HPA tissue IHC; UniProt P05023 subcellular annotation). Assess the named cell population rather than calling the whole kidney uniformly positive (HPA tissue IHC).
Strong signal confined to nuclei, or diffuse cytoplasmic staining that obscures cell borders.A nuclear-only pattern conflicts with the reported membrane location (UniProt P05023; HPA tissue IHC). HPA also records cytoplasm/membrane staining in cerebellar granular cells, so cytoplasmic signal alone is insufficient to reject a section; judge its cell type, distribution and background (HPA tissue IHC).
Prominent staining in adipocytes, cardiomyocytes or skeletal-muscle myocytes.HPA reports ATP1A1 as Not detected in those specific cell populations (HPA tissue IHC). Check the annotated cells before suspecting cross-reactivity or endogenous detection activity; a tissue-wide negative claim would exceed the HPA observation (HPA tissue IHC; general IHC interpretation).
Brown deposit appears across cells and empty spaces, with little separation between them.This is difficult to score as cell-associated membrane staining (UniProt P05023 subcellular annotation; general IHC interpretation). Review the no-primary control and detection background before assigning ATP1A1 positivity; widespread deposit alone does not establish target localization (general IHC practice).
No discernible signal in kidney collecting ducts or breast glandular cells.These are HPA High populations, so their absence makes a negative result elsewhere hard to interpret (HPA tissue IHC; general IHC interpretation). Verify that the control contains the named cells and that the staining run worked before scoring the test section negative (general IHC practice).
💡Expected ATP1A1 appearanceCall a positive result when cell-associated membrane staining is clear in an HPA High population such as kidney collecting ducts; isolated nuclear signal or uniform deposit across empty spaces is suspect (HPA tissue IHC; UniProt P05023 subcellular annotation; general IHC interpretation).
How each factor affects the staining
Membrane topology and epitope locationATP1A1 has 10 transmembrane segments and both cytoplasmic and extracellular regions (UniProt P05023 topology). Epitope position could affect antibody access, but the supplied record gives no catalog-antibody epitope, so it cannot predict a retrieval condition or staining strength (UniProt P05023 topology; evidence limit).
Cell population selected for scoringHPA reports High staining in kidney collecting ducts and several glandular or endocrine populations, but Not detected in selected adipocytes and muscle cells (HPA tissue IHC). Those labels apply to the specified cells, not every cell in each tissue (HPA tissue IHC).
Antibody validationThe two listed antibodies, CAB018702 and CAB069993, each have Enhanced IHC status; HPA defines this as support from independent antibodies or orthogonal data (HPA antibody validation). The tissue profile still carries HPA's medium staining-to-RNA consistency qualifier (HPA tissue IHC).
Isoform interpretationUniProt lists 4 ATP1A1 isoforms (UniProt P05023 isoforms). No antibody epitope or isoform-specific IHC pattern is supplied, so a positive cell cannot be assigned to a particular isoform from this staining alone (UniProt P05023 isoforms; evidence limit).
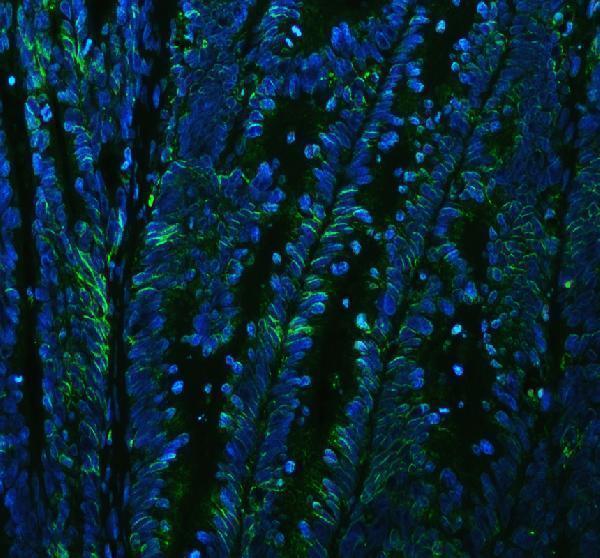
IF/ICC Q&A: what localization is reported?HPA reports approved plasma-membrane and vesicle localization in ICC-IF, with images from A-431, U-251MG and U2OS (HPA subcellular ICC-IF). This is an IF/ICC localization reference; the primary application here is paraffin-section IHC (HPA subcellular ICC-IF; guide scope).
Why is my staining missing, weak or wrong?
SituationLikely causeNext action
The positive-control section has no staining in kidney collecting ducts.The expected High population may be absent from the section, or the staining run may have failed (HPA tissue IHC; general IHC practice).Confirm collecting ducts are present; then check primary-antibody application, antigen-retrieval execution and detection steps against the run record (general IHC practice). No ATP1A1-specific retrieval setting is established here (evidence limit).
Membrane signal is weak and difficult to distinguish from counterstain.Low contrast or a weak run can obscure cell borders (general IHC interpretation); HPA intensity also varies by named cell population (HPA tissue IHC).Compare the test section with an HPA High control in the same run, then review catalog-antibody dilution and detection settings (HPA tissue IHC; general IHC practice).
Staining is mainly nuclear.Nuclear-only staining does not fit the reported cell-membrane localization (UniProt P05023 subcellular annotation; HPA tissue IHC).Check the no-primary control, staining distribution and cell identity; score ATP1A1 only where convincing target-associated staining survives those checks (general IHC practice).
An HPA Not detected cell population appears strongly positive.Possible explanations include cross-reactivity or endogenous detection activity; HPA's negative call is specific to the annotated cell population (HPA tissue IHC; general IHC interpretation).Confirm cell identity, compare a no-primary control and repeat with a separately validated antibody if needed (general IHC practice; HPA antibody validation).
Brown staining spreads beyond cell outlines or into empty spaces.Diffuse detection background can mimic a widespread positive result (general IHC interpretation).Inspect no-primary and reagent controls; review blocking, washing and detection timing before interpreting compartment-specific staining (general IHC practice).
Brown signal persists when primary antibody is omitted.The signal can arise from the detection system rather than ATP1A1; endogenous peroxidase is a consideration for peroxidase-based chromogenic IHC (general IHC practice).Review the detection chemistry and its endogenous-activity blocking step, then rerun the no-primary control alongside the sample (general IHC practice).

Sample controls for ATP1A1 IHC & IF

🧪Run breast first: its glandular cells should stain (HPA: High in breast glandular cells). Use adipose tissue as the negative tissue (HPA: adipocytes Not detected); adipocytes within the breast section, if present, are a useful internal comparison, but their status in breast is not established by the adipose tissue row.
Positive control tissue: Adrenal gland (Glandular cells, HPA High)
Negative control tissue: Adipose tissue (HPA Not detected)
ICC-IF cell lines (HPA subcellular resource): HPA ICC-IF images show ATP1A1 in A-431, U-251MG, U2OS, with annotated localisation: Vesicles (approved), Plasma membrane (approved) (HPA subcellular).
Technical controls: Include no-primary (secondary-only) and concentration-matched rabbit IgG isotype controls (caption: rabbit primary antibody; HRP-conjugated anti-rabbit secondary), plus ATP1A1 knockout material processed in parallel as a biological negative. Block endogenous peroxidase and check for residual DAB background in the breast section (caption: HRP/DAB detection).
⚠️Feasibility: A target-specific fixation window or fixation effect is unreported, and the selected PB9482 paraffin-section caption does not state the fixative (caption: fixative not stated). The caption uses heat retrieval in EDTA at pH 8.0, but does not establish whether retrieval is required; the supplied evidence also does not establish whether frozen sections or IF/ICC are easier (caption: EDTA retrieval; HPA: ICC-IF images in A-431, U-251MG and U2OS). In breast sections, identify intact glandular cells before scoring membrane staining so adipocyte spaces are not mistaken for unstained cells (HPA: High in breast glandular cells; UniProt P05023: cell membrane localization).

HPA tissue IHC evidence for ATP1A1

Comprehensive Human Protein Atlas IHC scoring per tissue (reliability: Enhanced — Medium consistency between antibody staining and RNA expression data.). Rows are taken directly from the HPA tissue chart — click any row's HPA link to view the source.

Positive expression · recommended positive controls

TissueCell typeLevelEvidenceSource
Adrenal gland Glandular cells High Protein (IHC) HPA →
Appendix Endocrine cells High Protein (IHC) HPA →
Breast Glandular cells High Protein (IHC) HPA →
Cerebellum Granular cells - cytoplasm/membrane High Protein (IHC) HPA →
Colon Endocrine cells High Protein (IHC) HPA →

Undetected expression · recommended negative controls

TissueCell typeLevelEvidenceSource
Adipose tissue Adipocytes Not detected Protein (IHC) HPA →
Bone marrow Hematopoietic cells Not detected Protein (IHC) HPA →
Heart muscle Cardiomyocytes Not detected Protein (IHC) HPA →
Hippocampus Glial cells Not detected Protein (IHC) HPA →
Lymph node Germinal center cells Not detected Protein (IHC) HPA →
Section 3

Advanced ATP1A1 IHC Tips

Troubleshoot ATP1A1 staining in paraffin sections by checking retrieval, compartment, cell identity and controls before comparing chromogenic signal across samples.

How should I optimize retrieval when ATP1A1 membrane staining is weak?
Start with heat-mediated retrieval in EDTA at pH 8.0 for paraffin sections (datasheet PB9482). The selected tissue image used this retrieval before overnight incubation with 2 μg/ml antibody at 4°C, so keep those conditions together for an initial comparison (datasheet PB9482). If staining remains weak, compare a shorter and longer heating period on adjacent sections while holding antibody concentration and DAB development constant (standard IHC practice). Check whether stronger retrieval improves crisp cell borders without lifting tissue or increasing diffuse cytoplasmic color (standard IHC practice; UniProt P05023 localisation). Record heating and cooling times for each run so a change in signal can be traced to retrieval (standard IHC practice).
Could fixation explain inconsistent ATP1A1 staining between paraffin blocks?
The selected paraffin-section caption does not state a fixative, and target-specific ATP1A1 sensitivity to fixation is unknown from the supplied evidence (datasheet PB9482). Record each block’s fixative, fixation duration and processing history before comparing staining intensity across specimens (standard IHC practice). Use adjacent sections and the same EDTA pH 8.0 retrieval, 2 μg/ml primary concentration and overnight 4°C incubation when testing a block effect (datasheet PB9482; standard IHC practice). Include a consistently processed reference section in each run to distinguish a block-specific loss from a staining-run change (standard IHC practice). Avoid assigning a fixation mechanism to differences seen in this comparison without a controlled fixation experiment (standard IHC practice).
Where should convincing ATP1A1 staining appear in tissue sections?
Expect predominantly membranous staining: ATP1A1 is assigned to the cell and basolateral membranes, and the tissue atlas describes membranous expression in most tissues (UniProt P05023 localisation; HPA: tissue IHC profile). Evaluate whether DAB follows intact cell borders within the expected tissue architecture, using adjacent cells and the counterstain to locate those borders (standard IHC practice). Cytoplasmic signal is not automatically false, because the atlas records cytoplasm/membrane staining in cerebellar granular cells and vesicular localisation by ICC/IF (HPA: cerebellum; HPA: subcellular). Still, diffuse brown haze without a discernible cellular pattern warrants checks of antibody concentration, washing and DAB development (standard IHC practice). Compare compartment patterns within matched sections before interpreting intensity differences (standard IHC practice).
Can retrieval or permeabilisation reveal whether this antibody recognizes a specific ATP1A1 epitope?
The supplied record lists 4 ATP1A1 isoforms, but it does not identify this antibody’s epitope or establish isoform-specific recognition (UniProt P05023 isoforms; datasheet PB9482). ATP1A1 has 10 transmembrane segments with cytoplasmic and extracellular intervals, so epitope position could affect access in tissue sections (UniProt P05023 topology; standard IHC practice). Its annotated modified residues include acetyllysine and phosphoserine near the N terminus, but no supplied experiment connects those modifications to antibody binding (UniProt P05023 modified residues; datasheet PB9482). Keep EDTA pH 8.0 retrieval as the reference condition while testing section treatment (datasheet PB9482; standard IHC practice). Establish epitope or isoform claims with antibody-specific mapping or orthogonal validation before using them to explain staining differences (standard IHC practice).
How can I adapt ATP1A1 localisation checks to multiplex IF?
Use IF as a separate optimisation: the supplied catalog image documents chromogenic staining of a paraffin section, while HPA reports plasma-membrane and vesicle localisation in ICC/IF (datasheet PB9482; HPA: subcellular). Multiplex ATP1A1 with a validated marker for the expected cell population; for example, interpret kidney signal against the collecting-duct population reported as high in the tissue atlas (HPA: kidney collecting ducts; standard IF practice). Choose a fluorophore channel after checking unstained tissue autofluorescence, and include single-label controls to assess bleed-through (standard IF practice). If an antibody’s mapped epitope faces a cytoplasmic interval, test gentle permeabilisation; an extracellular epitope may be accessible without it (UniProt P05023 topology; standard IF practice). Because this antibody’s epitope is unspecified, compare those conditions empirically before interpreting vesicular signal (datasheet PB9482; standard IF practice).
What should I check when DAB obscures ATP1A1 cell borders?
Inspect a no-primary control for signal arising from the detection system, and verify that the routine peroxidase-blocking step was applied before HRP/DAB detection (standard IHC practice). The selected image used 10% goat serum blocking, 2 μg/ml primary overnight at 4°C and a peroxidase-conjugated secondary (datasheet PB9482). If borders disappear under uniform brown staining, compare a primary dilution series and shorter DAB development on adjacent sections while keeping retrieval fixed at EDTA pH 8.0 (datasheet PB9482; standard IHC practice). Examine whether the signal follows cells or pools at folds, torn edges and necrotic regions (standard IHC practice). Score only intact areas where membrane outlines remain interpretable (standard IHC practice).
How should I score ATP1A1 IHC when membrane intensity varies across cells? ⚠ ANSWER MARKED FOR VERIFICATION
Define the analysis region and cell population before scoring, then record the percentage of cells with interpretable membranous DAB signal (standard IHC practice; UniProt P05023 localisation). An H-score can combine percentages at 0–3 intensity grades into a 0–300 summary, but retain the separate membrane and cytoplasmic observations (standard IHC practice). Alternatively, report positive-cell density per mm² of viable analysed tissue when cell abundance changes substantially (standard IHC practice). Normalise percentages to the counted cells of the specified population, or density to the measured viable tissue area, with consistent exclusion of folds and necrosis (standard IHC practice). Keep retrieval, primary incubation and DAB development matched across slides before comparing scores (datasheet PB9482; standard IHC practice).
How do I distinguish genuine ATP1A1 staining from misleading positive areas?
Give strongest weight to staining that outlines intact cells in a plausible population: the atlas reports high signal in kidney collecting ducts and predominantly membranous tissue expression (HPA: kidney collecting ducts; HPA: tissue IHC profile). Treat isolated nuclear color or brown accumulation at section edges, folds and necrotic areas as suspect until controls and tissue morphology support it (UniProt P05023 localisation; standard IHC practice). A no-primary control helps identify endogenous peroxidase or detection-related color under the same DAB conditions (standard IHC practice). Do not generalise the selected ovarian-cancer-section image to normal ovarian follicle cells, which the atlas lists as not detected (datasheet PB9482; HPA: ovary follicle cells). Correlate compartment, cell identity and control staining before calling a specimen positive (standard IHC practice).
Boster reagents

Best ATP1A1 / Sodium/potassium-transporting ATPase subunit alpha-1 IHC Antibodies

Two anti-ATP1A1 antibodies have IHC images from paraffin sections of human and rat tissues (catalog IHC captions). Both list human, mouse and rat reactivity; IF is also listed for both (catalog applications/reactivity).

Real IHC data IHC analysis of ATP1A1 using anti-ATP1A1 antibody (PB9482). ATP1A1 was detected in a paraffin-embedded section of human ovarian cancer tissue. Heat mediated antigen retrieval was performed in EDTA buffer (pH 8.0, epitope retrieval solution). The tissue section was blocked with 10% goat serum. The tissue section was then incubated with 2 μg/ml rabbit anti-ATP1A1 Antibody (PB9482) overnight at 4°C. Peroxidase Conjugated Goat Anti-rabbit IgG was used as secondary antibody and incubated for 30 minutes at 37°C. The tissue section was developed using HRP Conjugated Rabbit IgG Super Vision Assay Kit (Catalog # SV0002) with DAB as the chromogen.
Anti-alpha 1 Sodium Potassium ATPase/ATP1A1 Antibody ®
Cat # PB9482
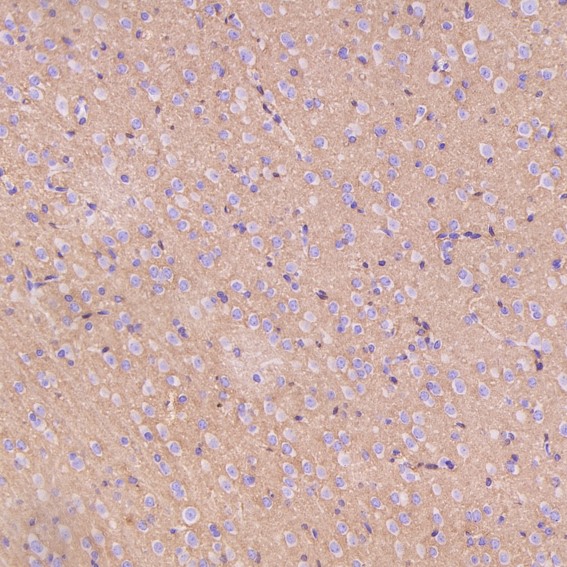
Real IHC data Immunohistochemical analysis of paraffin-embedded Rat cerebral cortex, using the Antibody at 1:100 dilution.
Anti-Sodium Potassium ATPase ATP1A1 Rabbit Monoclonal Antibody
Cat # M00956

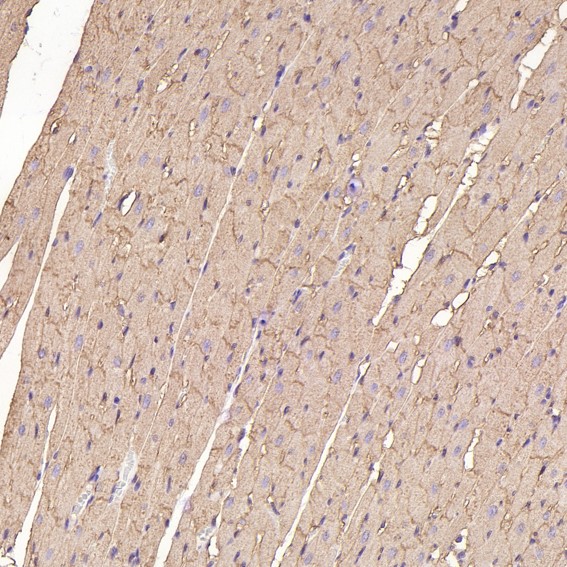
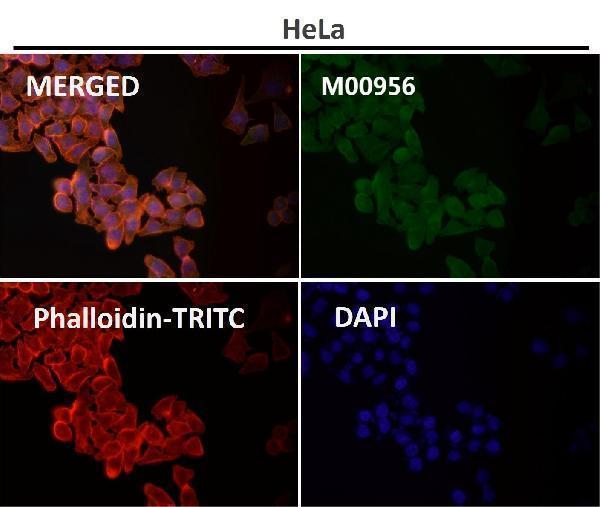
PB9482 has IHC images from paraffin sections of human ovarian, colon, endometrioid adenocarcinoma and liver cancer tissue (PB9482 IHC captions). M00956 has IHC images from paraffin sections of rat cerebral cortex and heart and human cervical and thyroid cancer tissue; IF and ICC are listed applications (M00956 IHC captions; catalog applications).

Which to pick: For tissue IHC, PB9482 offers a documented starting condition of 2 μg/ml after EDTA retrieval at pH 8.0 in a paraffin section (PB9482 IHC caption); the fixative is unreported (PB9482 IHC caption). For IF/ICC, choose the rabbit monoclonal M00956 because both applications are listed (M00956 catalog applications/clone); its paraffin IHC caption likewise does not report a fixative (M00956 IHC caption). For work across human, mouse and rat, either SKU lists all three species as reactive (catalog reactivity).

Each figure is that product's own IHC / IF validation image from its datasheet.

References

  1. UniProt Consortium. UniProt entry P05023 (AT1A1_HUMAN, Sodium/potassium-transporting ATPase subunit alpha-1).
  2. Human Protein Atlas. ATP1A1 tissue IHC expression (reliability: Enhanced).
  3. Human Protein Atlas. ATP1A1 subcellular location (ICC-IF): Localized to the plasma membrane and vesicles..
  4. Human Protein Atlas. ATP1A1 antibody validation summary (2 antibodies).
  5. LncDARS-AS1 Regulates ATP1A1 Stability and Enhances Na(+)/K(+) ATPase Activity to Promote Osteosarcoma Metastasis. Advanced science (Weinheim, Baden-Wurttemberg, Germany) 2025 — PMC12442677.
  6. Hypomethylation of ATP1A1 Is Associated with Poor Prognosis and Cancer Progression in Triple-Negative Breast Cancer. Cancers 2024 — PMC11083557.
  7. Expression Regulation of Water Reabsorption Genes and Transcription Factors in the Kidneys of Lepus yarkandensis. Frontiers in physiology 2022 — PMC9204326.
  8. Molecular architecture underlying fluid absorption by the developing inner ear. eLife 2017 — PMC5634787.
  9. PubMed PMID:2430951 — UniProt-cited evidence.
  10. PubMed PMID:7536695 — UniProt-cited evidence.
  11. PubMed PMID:14702039 — UniProt-cited evidence.