This website uses cookies to ensure you get the best experience on our website.


- Table of Contents
Plan chromogenic CD2AP IHC on paraffin sections. Use cytoplasmic staining in most cells and strong staining in glomerular cells as benchmarks (HPA tissue IHC).

Expected localisation, validated protocols, controls and antibodies — the at-a-glance facts below, then the full design guide.
| Expected localisation | Cytoplasmic in most tissue cells (HPA tissue IHC) | |
| Staining pattern | Most cells show cytoplasmic staining (HPA tissue IHC) | |
| Antigen retrieval | Citrate pH 6 HIER, heat-mediated (datasheet M01756) | |
| Positive control | Bone marrow+4 more · see all | |
| Negative control | Adipose tissue+4 more · see all |
| Fixation | Keep fixation consistent across sections (standard IHC practice; not target-specific) | |
| Caveat | Glomerular cells stain strongly; adipocytes are undetected (HPA tissue IHC) | |
| Regulation | No specific staining regulator reported (UniProt) | |
| Isoform / epitope | No reported isoforms or chain processing (UniProt) |
Start with the catalog antibody’s IHC-P protocol (datasheet M01756), then compare published CD2AP staining in brain sections (PMC8713526) and a gastric cancer tissue microarray (PMC7078920).
| Sample | Paraffin-embedded human colon cancer tissue; fixative not specified (datasheet M01756) |
| Fixation | Image fixative and duration unreported (datasheet M01756); verify before use. |
| Sectioning | 4–5 µm sections on charged slides (standard) |
| Deparaffinisation | Xylene, graded ethanol series to water (standard) |
| Antigen retrieval | Heat retrieval: Citrate pH 6, 20 min (datasheet M01756) |
| Peroxidase block | 3% H2O2, 10 min, room temperature (standard) |
| Blocking | 10% goat serum (datasheet M01756) |
| Primary antibody | Mouse monoclonal (clone 5F8) anti-CD2AP, 0.5-1μg/ml (datasheet M01756) |
| Primary incubation | Overnight at 4 °C (datasheet M01756) |
| Detection | Streptavidin-biotin complex (SABC), DAB chromogen (datasheet M01756) |
| Counterstain | Hematoxylin, blue, dehydrate and mount (standard) |
| Expected result | CD2AP-positive staining in hematopoietic cells of bone marrow (HPA tissue IHC: High). HPA tissue profile: Cytoplasmic expression in most cells. No signal in the no-primary control. |
CD2AP is expected mainly in the cytoplasm of tissue cells (HPA: Enhanced tissue IHC; cytoplasmic expression in most cells). Strong staining is documented in kidney glomerular cells, several glandular epithelia and bone marrow hematopoietic cells (HPA: High in these cell populations). Its association with the cytoskeleton and cell junctions can add peripheral detail (UniProt Q9Y5K6: subcellular location); CD2AP has no transmembrane segment (UniProt Q9Y5K6: topology).
| Clear cytoplasmic staining in glomerular cells, with signal in breast or colon glandular cells. | This fits high expression in those cell populations (HPA: kidney, breast and colon tissue IHC). Score the stained cells and compartment, since neighboring structures need not share the same intensity. A glomerular signal alone does not identify individual podocytes: slit diaphragm localization is annotated by similarity (UniProt Q9Y5K6). |
| Predominantly nuclear staining, with little convincing cytoplasmic signal in known positive cells. | Treat a nuclear only pattern as suspect: HPA describes cytoplasmic tissue staining, while UniProt places CD2AP at the cytoskeleton, ruffles and junctions (HPA: tissue profile; UniProt Q9Y5K6: subcellular location). Review morphology, counterstain and controls before scoring it as CD2AP. |
| Strong staining in adipocytes, smooth muscle cells or ovarian stromal cells. | Those populations are reported as not detected (HPA: adipose tissue, smooth muscle and ovary tissue IHC). Check whether the signal follows the named cells rather than nearby positive cells. Cross reactivity or endogenous detection activity is possible; this pattern alone cannot establish which cause applies. |
| Uniform color over cells, extracellular space or the whole section, obscuring cell boundaries. | Diffuse background cannot be interpreted as the cell associated pattern reported for CD2AP (HPA: cytoplasmic expression in most cells). In chromogenic IHC, compare a no primary control and inspect tissue edges or deposits; background can arise from detection chemistry or excess nonspecific binding. |
| No convincing signal in glomerular cells or a documented strongly stained glandular epithelium. | An absent signal in these reference populations warrants a technical check (HPA: High in kidney glomerular cells and breast or colon glandular cells). Confirm that the relevant cells are present, then check the run controls and assay settings. A blank section alone cannot establish biological absence. |
| Cell population and tissue | CD2AP has broad tissue expression (UniProt Q9Y5K6: tissue specificity; HPA: low RNA tissue specificity), but IHC levels differ by cell population. HPA reports High in kidney glomerular cells and several glandular epithelia, Low in selected muscle and glandular cells, and Not detected in adipocytes (HPA: tissue IHC). Choose the comparison cells accordingly. |
| Compartment and topology | The tissue IHC reference is mainly cytoplasmic (HPA: tissue profile). UniProt also places CD2AP at cytoskeletal structures, membrane ruffles and cell junctions, without a transmembrane segment (UniProt Q9Y5K6: subcellular location; topology). Peripheral staining can therefore fit the record, but a purely nuclear tissue pattern lacks support from these sources. |
| Cell division | UniProt reports concentration near midzone microtubules during late anaphase and telophase, and at the midbody in late telophase (UniProt Q9Y5K6: subcellular location). Interpret a small mitotic focus in its cellular context; this annotation does not establish that such detail will be resolved in every paraffin IHC section. |
| Evidence for the staining pattern | HPA rates tissue staining reliability Enhanced, citing consistency with RNA expression, and lists Enhanced IHC validation for HPA003267, HPA003326 and CAB004352 (HPA: tissue IHC; antibody validation). These ratings support the reference pattern; they do not verify an individual run, specimen or unlisted antibody. |
| Situation | Likely cause | Next action |
|---|---|---|
| The positive control is blank. | The expected cells may be absent from the section, or the IHC run may have failed; HPA reports High staining in kidney glomerular cells and breast glandular cells (HPA: tissue IHC). | Locate the reference cells on the counterstained section. Check the run control, primary antibody application, retrieval record and detection steps using the validated assay instructions. The supplied sources give no CD2AP specific retrieval condition or fixation sensitivity. |
| Signal is weak only in a low expression tissue. | A weak result may match the reference range: HPA lists Low in parathyroid glandular cells and cardiomyocytes (HPA: tissue IHC). | Compare a High reference population in the same run before adjusting the assay (HPA: High in kidney glomerular cells). Record the cell type scored; low signal alone does not show that retrieval or detection failed. |
| Unexpected nuclear staining dominates. | The dominant compartment differs from HPA tissue IHC and UniProt localization (HPA: cytoplasmic profile; UniProt Q9Y5K6: cytoskeleton and junctions). | Recheck the counterstain, focus and cell boundaries. Compare the no primary control and, where available, an independently validated IHC antibody (HPA: HPA003267, HPA003326 and CAB004352, IHC Enhanced). |
| Adipocytes or smooth muscle cells stain strongly. | Those cell types are listed as Not detected (HPA: adipose tissue and smooth muscle tissue IHC); cross reactivity or endogenous detection activity may explain the discrepancy. | Confirm cell identity and compare the no primary control. If color persists without primary antibody, investigate detection background; if it depends on primary antibody, compare an independent IHC validated antibody (HPA: antibody validation). |
| The section has widespread chromogenic haze. | Widespread color obscures the cell associated pattern reported by HPA (HPA: cytoplasmic tissue profile). Its precise cause cannot be inferred from appearance alone. | Compare a no primary control, inspect background outside cells, and review blocking, washes and detection timing as general chromogenic IHC checks. Score CD2AP only where cellular boundaries and a supported compartment remain clear. |
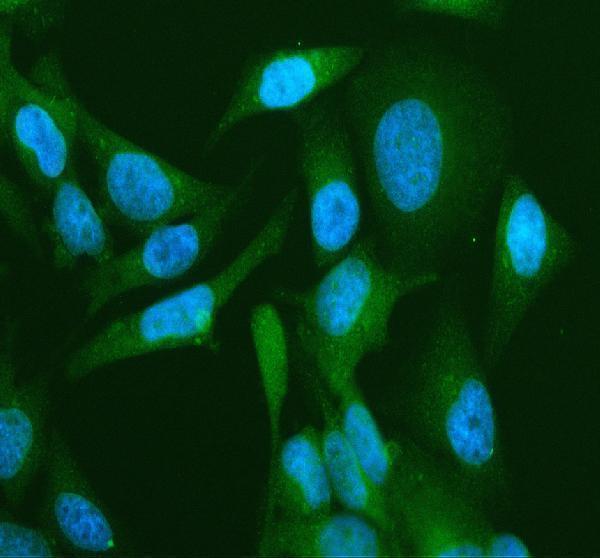
| Can the tissue IHC pattern be used to judge IF/ICC images? | The assays have different reference observations: HPA tissue IHC is mainly cytoplasmic, while HPA ICC-IF supports plasma membrane localization and marks centriolar satellites uncertain (HPA: tissue IHC; subcellular summary). | For IF/ICC, assess membrane signal against the HPA subcellular reference and treat satellite puncta cautiously (HPA: subcellular summary). Do not require the same apparent distribution at chromogenic section resolution; use the separate IF/ICC guide for assay setup. |
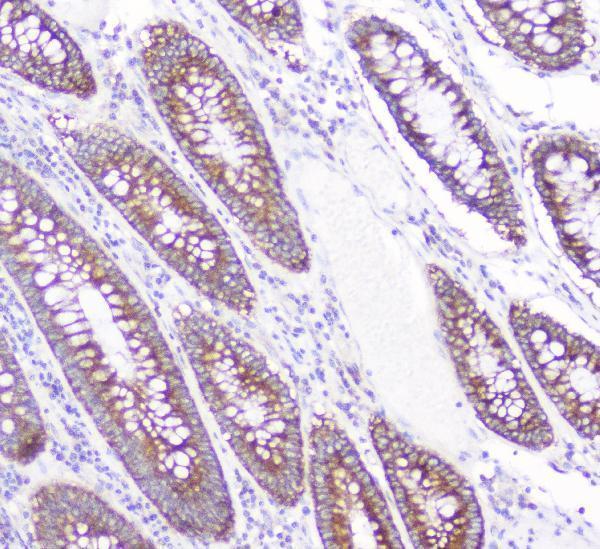
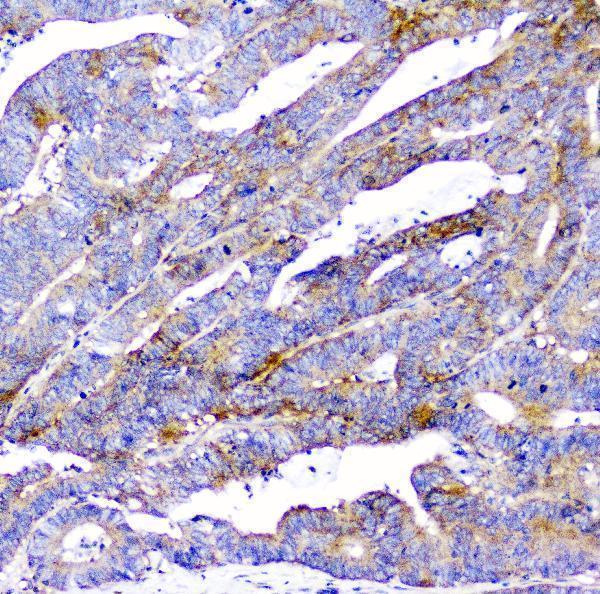
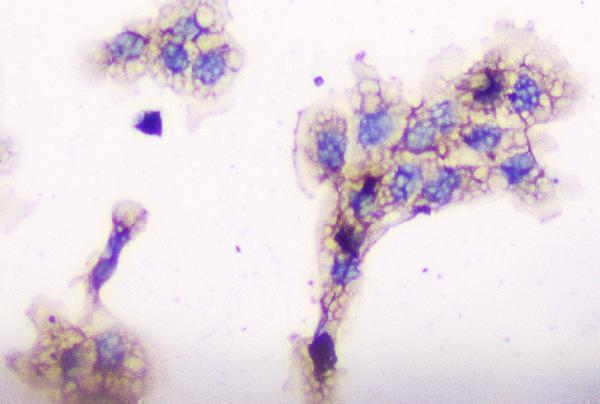
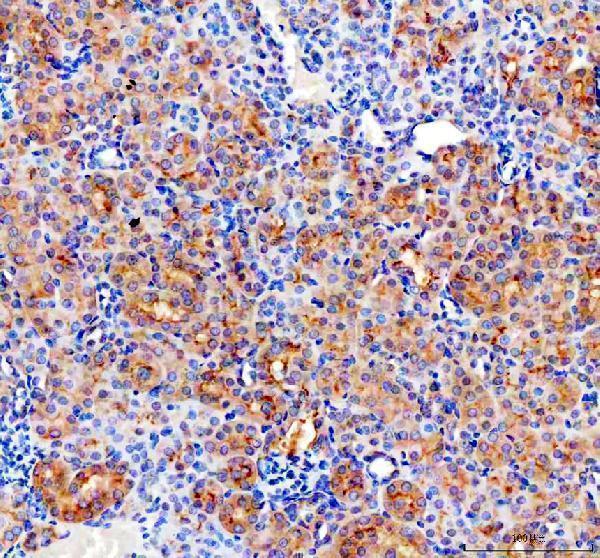
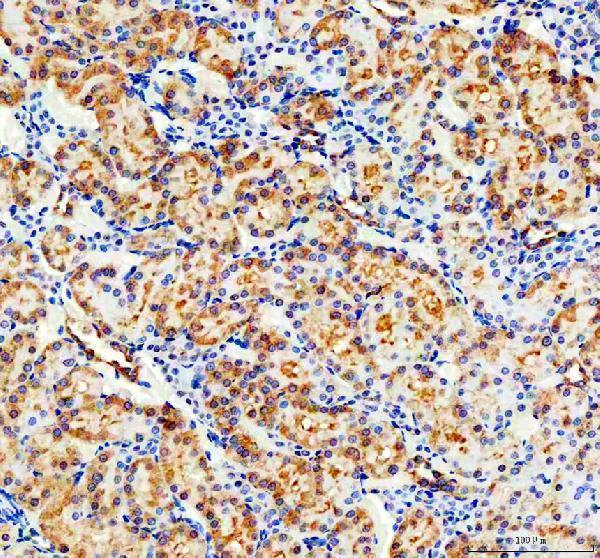
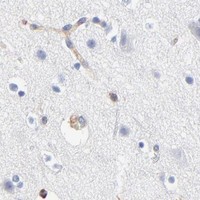
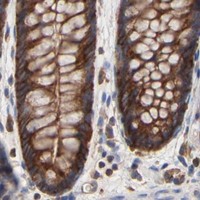


Comprehensive Human Protein Atlas IHC scoring per tissue (reliability: Enhanced — High consistency between antibody staining and RNA expression data.). Rows are taken directly from the HPA tissue chart — click any row's HPA link to view the source.
| Tissue | Cell type | Level | Evidence | Source |
|---|---|---|---|---|
| Bone marrow | Hematopoietic cells | High | Protein (IHC) | HPA → |
| Breast | Glandular cells | High | Protein (IHC) | HPA → |
| Colon | Glandular cells | High | Protein (IHC) | HPA → |
| Duodenum | Glandular cells | High | Protein (IHC) | HPA → |
| Endometrium | Glandular cells | High | Protein (IHC) | HPA → |
| Tissue | Cell type | Level | Evidence | Source |
|---|---|---|---|---|
| Adipose tissue | Adipocytes | Not detected | Protein (IHC) | HPA → |
| Caudate | Glial cells | Not detected | Protein (IHC) | HPA → |
| Hippocampus | Glial cells | Not detected | Protein (IHC) | HPA → |
| Ovary | Ovarian stroma cells | Not detected | Protein (IHC) | HPA → |
| Smooth muscle | Smooth muscle cells | Not detected | Protein (IHC) | HPA → |
Troubleshoot CD2AP staining in paraffin sections by checking retrieval, cell type, subcellular pattern, and controls before interpreting chromogenic signal.
CD2AP IHC is illustrated in human colon cancer (M01756 IHC caption) and mouse kidney (A01756-2 IHC caption); IF is illustrated in HeLa cells (A01756-2 IF caption).
M01756 has paraffin-section IHC images from human colon cancer, placenta, and mammary cancer (M01756 IHC captions). A01756-2 has paraffin-section IHC images from mouse and rat kidney and an IF image from HeLa cells (A01756-2 IHC/IF captions).
Which to pick: For human tissue IHC, choose M01756, a mouse monoclonal clone 5F8 with a human paraffin-section image using citrate pH 6 retrieval (catalog: M01756 host/clone; M01756 IHC caption). For IF/ICC, choose A01756-2, which has a HeLa IF image and lists both applications (A01756-2 IF caption; catalog: A01756-2 applications). For cross-species tissue IHC, choose A01756-2: its paraffin-section images show mouse and rat kidney with EDTA pH 8 retrieval, and its listed reactivity includes human, mouse, and rat; the fixative is unreported in both SKUs’ IHC captions (A01756-2 IHC captions; catalog: A01756-2 reactivity; M01756 IHC captions).