GOLGA1 / Golgin subfamily A member 1 · IHC design guide

Design Immunohistochemistry for GOLGA1

Plan paraffin-section GOLGA1 IHC around granular cytoplasmic tissue staining and a Golgi/TGN molecular expectation (HPA tissue IHC; UniProt). Use appendix or colon glandular cells as positive tissue examples (HPA tissue IHC), and start catalog antibody A13524-1 at 2 μg/mL (datasheet A13524-1).

Evidence assembled Oct 2026 · For research use; verify linked source records and product datasheet before use
Immunohistochemistry protocol sheet for GOLGA1 (IHC for GOLGA1): expected localisation Granular cytoplasm observed (HPA tissue IHC); Golgi/TGN membrane expected (UniProt), antibody A13524-1, validated IHC image, and IHC protocol steps
Printable GOLGA1 IHC protocol sheet — expected localisation Granular cytoplasm observed (HPA tissue IHC); Golgi/TGN membrane expected (UniProt), antibody A13524-1, controls and protocol steps. Open the full GOLGA1 IHC guide →

GOLGA1 Immunohistochemistry Experimental Design Guide

Expected localisation, validated protocols, controls and antibodies — the at-a-glance facts below, then the full design guide.

Must know before staining
Expected localisation Granular cytoplasm observed (HPA tissue IHC); Golgi/TGN membrane expected (UniProt)
Staining pattern Predominantly granular cytoplasm across tissue cell types (HPA tissue IHC)
Antigen retrieval EDTA pH 8.0 HIER, heat-mediated (datasheet A13524-1)
Positive control ⓘ Adrenal gland+4 more · see all
Negative control ⓘ Adipose tissue+2 more · see all
Important caveats
Reasons your staining may differ from the expected pattern.
Fixation Matched tissue-IHC evidence does not establish the fixation claim. Validate the specimen-specific method before use. (selected-SKU IHC image A13524-1)
Caveat Adipocytes lack detectable staining despite broad expression (HPA tissue IHC)
Regulation Expression regulation not annotated (UniProt)
Isoform / epitope No annotated isoforms or signal/propeptide cleavage (UniProt)
Section 1

Recommended GOLGA1 IHC & IF Protocols

The catalog antibody’s IHC-P protocol is accompanied by one published GOLGA1 IHC protocol using human skin sections (PMC13414942).

Recommended immunohistochemistry (IHC-P) protocol parameters
SampleParaffin-embedded human appendiceal adenocarcinoma tissue; fixative not specified (datasheet A13524-1)
FixationImage fixative and duration unreported (datasheet A13524-1); verify before use.
Sectioning4–5 µm sections on charged slides (standard)
DeparaffinisationXylene, graded ethanol series to water (standard)
Antigen retrievalHeat retrieval: EDTA pH 8.0 (datasheet A13524-1); 20 min, 95–100 °C (standard)
Peroxidase block3% H2O2, 10 min, room temperature (standard)
Blocking10% goat serum (datasheet A13524-1)
Primary antibodyRabbit anti-GOLGA1, 2-5 μg/ml (datasheet A13524-1)
Primary incubationOvernight at 4 °C (datasheet A13524-1)
DetectionStreptavidin-biotin complex (SABC), DAB chromogen (datasheet A13524-1)
CounterstainHematoxylin, blue, dehydrate and mount (standard)
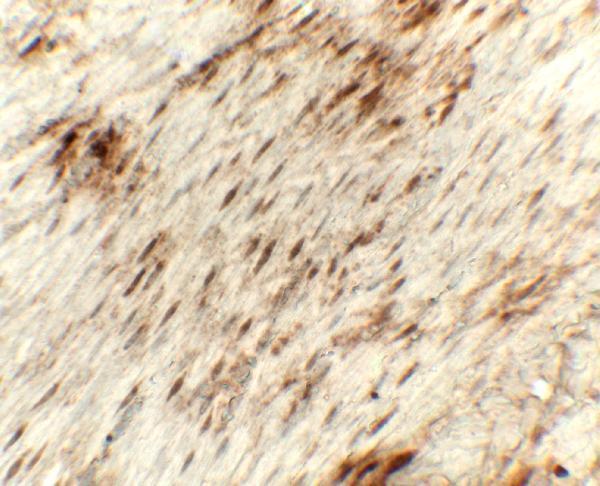
Expected resultGOLGA1-positive staining in glandular cells of adrenal gland (HPA tissue IHC: High). HPA tissue profile: General cytoplasmic expression, predominately with a granular pattern. No signal in the no-primary control.
💡Decision noteStart with heat-mediated EDTA pH 8.0 retrieval (datasheet: A13524-1); the published protocol reports 95–100 °C for 4 min without specifying a buffer (PMC13414942).
Section 2

What Is the Expected GOLGA1 Staining Pattern?

GOLGA1 is associated with the Golgi and trans-Golgi network membranes and has no transmembrane segment (UniProt Q92805 topology). In paraffin-section IHC, expect predominantly granular cytoplasmic staining in cells such as colon glandular cells and bronchial ciliated cell bodies (HPA: tissue IHC). Treat tissue comparisons cautiously: HPA rates the IHC profile Supported, with medium consistency between staining and RNA expression (HPA: tissue IHC).

What am I looking at on my slide?
Granular cytoplasmic stain in colon or appendix glandular cells, with little stain outside the cell body.This matches HPA's general granular cytoplasmic profile and its High staining calls for those glandular cells (HPA: tissue IHC). A compact Golgi-associated distribution is consistent with the recorded location (UniProt Q92805; HPA: subcellular). Judge the pattern alongside the negative control, since granularity alone does not establish specificity (general IHC practice).
Strong, predominantly nuclear or continuous cell-surface signal replaces the expected cytoplasmic granules.Those compartments differ from the Golgi location reported for GOLGA1 (UniProt Q92805; HPA: subcellular). Treat the result as suspect and inspect the negative control and staining conditions before scoring it as target signal (general IHC practice). A weak diffuse cytoplasmic component also needs caution because HPA describes the tissue pattern as predominantly granular (HPA: tissue IHC).
Adipocytes, cholangiocytes or chondrocytes stain strongly while the expected positive cells remain weak.HPA reports GOLGA1 as Not detected in those respective cell types (HPA: tissue IHC). Investigate antibody cross-reactivity or endogenous detection activity; the cell mismatch alone cannot identify which caused the signal (general IHC practice). HPA's Supported reliability is a useful reference, but it does not validate every stain in an individual run (HPA: tissue IHC).
Brown precipitate is widespread across cells, stroma or slide areas, obscuring the granular pattern.A uniform field is hard to reconcile with a cell-associated granular profile (HPA: tissue IHC). Diffuse staining can arise from nonspecific binding, detection background or residual chromogen activity; compare the no-primary control and review blocking and washes (general IHC practice). Do not infer a GOLGA1-specific fixation effect from this appearance: none is supplied by the sources.
No visible signal appears in colon or appendix glandular cells on a run intended to detect GOLGA1.Those cells are listed as High by HPA, so absence warrants a run-level check (HPA: tissue IHC). Review section quality, retrieval, antibody and detection steps against the IHC-validated antibody's instructions (general IHC practice). HPA's medium staining–RNA consistency means one negative section should not, by itself, overturn the reported tissue pattern (HPA: tissue IHC).
💡Expected GOLGA1 appearanceCall a section positive when appropriate cells show clear granular cytoplasmic chromogenic staining, especially colon or appendix glandular cells reported High (HPA: tissue IHC); predominantly nuclear, surface-only or uniform field staining is suspect against the Golgi location and granular profile (UniProt Q92805; HPA: tissue IHC).
How each factor affects the staining
Compartment and topologyGOLGA1 is assigned to Golgi and trans-Golgi network membranes, yet has no transmembrane segment (UniProt Q92805 topology). Score the visible cellular distribution, not an assumed plasma-membrane outline. Its ARL1 interaction recruits it to the Golgi (UniProt Q92805).
Tissue and cell selectionHPA lists High staining in colon and appendix glandular cells and bronchial ciliated cell bodies, but Not detected in adipocytes and cholangiocytes (HPA: tissue IHC). These are cell-specific comparison points, not claims that an entire tissue section must be uniformly positive or negative.
Strength of tissue evidenceHPA labels tissue IHC Supported and reports medium agreement with RNA expression; RNA tissue specificity is Low (HPA: tissue IHC). Use the listed cell pattern to interpret a section, while allowing for uncertainty in staining intensity across samples.
IF/ICC Q: Where should fluorescent GOLGA1 appear?A Golgi-localized signal is expected: HPA calls the Golgi apparatus the enhanced main location in ICC-IF (HPA: subcellular). That observation supports compartment interpretation; IF/ICC setup belongs in its separate guide and is not an IHC protocol option.
Processing and target-specific fixation evidenceUniProt records one chain spanning residues 1–767, with no signal peptide, propeptide or annotated isoforms (UniProt Q92805). These annotations do not establish epitope accessibility in paraffin sections. Neither supplied source reports a GOLGA1-specific fixation effect.
Why is my staining missing, weak or wrong?
SituationLikely causeNext action
Known-positive glandular cells have no chromogenic signal.The staining run may have failed, or the section may be unsuitable; HPA reports High staining in colon and appendix glandular cells (HPA: tissue IHC).Check a positive-control section processed in the same run, then review retrieval, primary antibody and detection against the IHC-validated antibody's instructions (general IHC practice). Avoid assigning a GOLGA1-specific fixation cause without evidence.
Signal is diffuse and hides intracellular granules.Background from binding or detection can mask the predominantly granular pattern reported by HPA (HPA: tissue IHC; general IHC practice).Compare the no-primary control; inspect blocking, wash quality and chromogen development before interpreting cell-specific signal (general IHC practice).
A strong brown signal appears in adipocytes or cholangiocytes.HPA calls GOLGA1 Not detected in those cells; cross-reactivity or endogenous detection activity is possible (HPA: tissue IHC; general IHC practice).Compare adjacent expected-positive cells and a no-primary control. If the control stains, review endogenous-activity blocking and detection reagents; if it does not, reassess antibody specificity (general IHC practice).
Nuclei or cell borders dominate the stain.That distribution conflicts with Golgi localization and the reported granular cytoplasmic tissue profile (UniProt Q92805; HPA: tissue IHC).Check the negative control, antibody concentration and detection background; score only a reproducible cell-associated granular component as consistent with the target (general IHC practice; HPA: tissue IHC).
An apparently negative tissue area is used to reject the entire run.HPA's Not detected calls name specific cells, while its tissue profile has medium staining–RNA consistency (HPA: tissue IHC).Identify the scored cell type and examine a same-run positive control before interpreting absence. Do not extend a cell-specific HPA call to every cell in that tissue (HPA: tissue IHC; general IHC practice).
A fluorescent Golgi pattern is assumed to guarantee the paraffin IHC result.HPA reports enhanced Golgi localization in ICC-IF, while tissue IHC has Supported reliability and medium staining–RNA consistency (HPA: subcellular; HPA: tissue IHC).Use IF/ICC as a compartment reference, then judge the chromogenic section by its own controls and HPA's cell-specific tissue pattern (HPA: subcellular; HPA: tissue IHC; general IHC practice).

Sample controls for GOLGA1 IHC & IF

🧪Run appendix first: its glandular cells should stain (HPA: Appendix glandular cells, High; caption: appendiceal tissue IHC). Use adipose tissue as the negative tissue because adipocytes are not detected there (HPA: Adipose tissue adipocytes, Not detected); on the appendix slide, use nonglandular cells to assess background, since the supplied appendix row does not identify a confirmed internal negative cell type (HPA: Appendix glandular cells, High).
Positive control tissue: Adrenal gland (Glandular cells, HPA High)
Negative control tissue: Adipose tissue (HPA Not detected)
ICC-IF cell lines (HPA subcellular resource): HPA ICC-IF images show GOLGA1 in A-431, U-251MG, U2OS, A-549, NIH 3T3, with annotated localisation: Golgi apparatus (enhanced) (HPA subcellular).
Technical controls: Include no-primary (secondary-only) and concentration-matched nonimmune rabbit IgG controls (caption: rabbit primary antibody), plus GOLGA1 knockout material as a biological specificity control. For the appendix SABC/DAB assay, quench endogenous peroxidase and block endogenous biotin (caption: SABC/DAB detection; standard IHC practice).
⚠️Feasibility: A GOLGA1-specific fixation window or fixation effect is unreported, and the selected A13524-1 paraffin-section caption does not state a fixative (caption: fixative not stated). Heat-mediated EDTA retrieval at pH 8.0 is documented for the appendiceal tumor example, but retrieval dependence across specimens is unreported (caption: EDTA pH 8.0). The supplied evidence does not establish frozen sections or IF as easier; HPA reports Golgi localization by ICC-IF, and no appendix-specific artefact is reported (HPA: Golgi apparatus, enhanced).

HPA tissue IHC evidence for GOLGA1

Comprehensive Human Protein Atlas IHC scoring per tissue (reliability: Supported — Medium consistency between antibody staining and RNA expression data.). Rows are taken directly from the HPA tissue chart — click any row's HPA link to view the source.

Positive expression · recommended positive controls

TissueCell typeLevelEvidenceSource
Adrenal gland Glandular cells High Protein (IHC) HPA →
Appendix Glandular cells High Protein (IHC) HPA →
Bronchus Ciliated cells (cell body) High Protein (IHC) HPA →
Colon Glandular cells High Protein (IHC) HPA →
Epididymis Glandular cells High Protein (IHC) HPA →

Undetected expression · recommended negative controls

TissueCell typeLevelEvidenceSource
Adipose tissue Adipocytes Not detected Protein (IHC) HPA →
Liver Cholangiocytes Not detected Protein (IHC) HPA →
Soft tissue Chondrocytes Not detected Protein (IHC) HPA →
Section 3

Advanced GOLGA1 IHC Tips

Troubleshoot GOLGA1 staining in paraffin sections by checking retrieval, staining controls and the expected Golgi pattern (datasheet A13524-1; HPA subcellular).

What should I adjust when GOLGA1 staining is weak after antigen retrieval?
Use heat-mediated EDTA at pH 8.0 for paraffin-section GOLGA1 IHC (datasheet A13524-1). Before changing retrieval, check that the primary antibody reached 2 μg/ml and was incubated overnight at 4°C, as in the selected tissue image (caption A13524-1). Run matched sections with a modest range of heating times, keeping antibody concentration and chromogen development constant so retrieval is the measured variable (standard IHC practice). Excess heating can damage tissue morphology or raise diffuse staining, making granular cytoplasmic signal harder to judge (standard IHC practice; HPA tissue IHC). Compare the result with glandular cells in appendix, where staining is reported as high (HPA: Appendix glandular cells, High).
Could fixation explain inconsistent GOLGA1 staining between paraffin blocks?
GOLGA1-specific fixation sensitivity is unknown because the selected paraffin-section caption does not state its fixative (caption A13524-1). Record each block’s fixation conditions, then compare sections processed with the same EDTA pH 8.0 retrieval and staining run (standard IHC practice; datasheet A13524-1). Include a consistently stained control section to distinguish block-dependent signal loss from a run-wide detection problem (standard IHC practice). Examine tissue morphology alongside staining, since poorly preserved or damaged areas are unreliable for cellular scoring (standard IHC practice). Do not infer a fixation effect from the reported tissue staining pattern or GOLGA1’s membrane association and phosphorylation sites (HPA tissue IHC; UniProt Q92805).
What GOLGA1 pattern should count as convincing chromogenic IHC staining?
Look for granular cytoplasmic staining with a Golgi-like concentration near the nucleus, while allowing for the broader granular pattern reported in tissue sections (HPA tissue IHC; HPA subcellular). GOLGA1 localizes to the Golgi apparatus and trans-Golgi network membrane and lacks a transmembrane segment (UniProt Q92805 topology and subcellular location). Score the pattern within identifiable cells rather than treating extracellular deposits or uniform nuclear color as expected localization (standard IHC practice; HPA subcellular). Appendix glandular cells provide a reported high-staining reference for comparison (HPA: Appendix glandular cells, High). If only diffuse color appears, reassess retrieval, primary concentration and detection controls before assigning a GOLGA1-positive score (standard IHC practice; datasheet A13524-1).
Could epitope placement explain a weak or redistributed GOLGA1 signal?
The supplied record lists one GOLGA1 chain, residues 1–767, and no annotated isoforms, so an isoform-specific explanation lacks support here (UniProt Q92805). Its GRIP domain spans residues 688–737, and annotated phosphoserines include positions 30, 36, 41, 47 and 50 (UniProt Q92805). The selected tissue-IHC caption does not identify the antibody’s epitope, so neither domain overlap nor modification sensitivity can be assigned to this reagent (caption A13524-1). Compare matched retrieval conditions before attributing weak staining to epitope masking (standard IHC practice). Treat a changed cellular pattern as a validation question requiring staining controls and morphology review, rather than evidence for an unannotated isoform (standard IHC practice; UniProt Q92805).
How can IF help assess an uncertain GOLGA1 IHC pattern?
Use IF/ICC as a complementary localization check: GOLGA1 is reported at the Golgi apparatus in cell images (HPA subcellular). For multiplexing, pair it with an independently validated marker of the expected cell type, such as a glandular-cell marker when assessing appendix glands (HPA: Appendix glandular cells, High; standard IF practice). Choose separated fluorophores and a longer-wavelength GOLGA1 channel if the specimen shows strong shorter-wavelength autofluorescence; inspect unstained controls first (standard IF practice). Include permeabilisation sufficient for a potentially cytosol-facing Golgi epitope, while recognizing that this antibody’s epitope is unspecified (UniProt Q92805 topology and ARL1 recruitment; caption A13524-1). Report IF conditions separately from the paraffin-section chromogenic workflow (standard IHC/IF practice).
How do I reduce diffuse brown staining without losing GOLGA1 signal?
Check a no-primary control and matched tissue morphology before interpreting diffuse DAB color as GOLGA1 staining (standard IHC practice). The selected image used 10% goat serum blocking, biotinylated secondary antibody, a streptavidin–biotin complex and DAB (caption A13524-1). Apply an appropriate peroxidase block and assess detection-system background, including endogenous biotin where relevant to this detection method (standard chromogenic IHC practice; caption A13524-1). Keep wash and DAB development conditions consistent when comparing adjustments across sections (standard IHC practice). Retain granular cytoplasmic staining as the pattern of interest, and reject background that spreads similarly across unrelated structures (HPA tissue IHC; standard IHC practice).
How should I quantify GOLGA1 IHC across tissue sections? ⚠ ANSWER MARKED FOR VERIFICATION
Define the scored cell population and tissue area before measuring GOLGA1, since reported staining differs among cell types (HPA tissue IHC; standard IHC practice). For appendix, score glandular cells separately from surrounding cells and record the percentage positive plus an intensity-based H-score on a 0–300 scale (HPA: Appendix glandular cells, High; standard IHC practice). If measuring positive-cell density, divide the positive-cell count by evaluable tissue area in mm² (standard IHC practice). Normalize comparisons to the same cell population, section quality, staining run and DAB threshold (standard IHC practice). Exclude folds, damaged edges and necrotic areas before calculating summary values (standard IHC practice).
When is apparent GOLGA1 positivity more likely to be artefact?
Favor cellular, granular cytoplasmic staining consistent with the reported tissue pattern and Golgi localization (HPA tissue IHC; HPA subcellular). Strong appendix glandular staining is plausible, whereas strong staining assigned to an unverified cell population needs additional controls; lung macrophages are reported low and soft-tissue chondrocytes not detected (HPA tissue IHC). Treat uniform nuclear color, extracellular precipitate, edge accentuation and necrotic-area staining as suspect patterns (standard IHC practice; HPA subcellular). Check no-primary and peroxidase controls when DAB appears broadly distributed, particularly because the selected method uses enzyme-based chromogenic detection (standard IHC practice; caption A13524-1). Base a positive call on localization, cell identity and clean controls together (standard IHC practice; HPA tissue IHC).
Boster reagents

Best GOLGA1 / Golgin subfamily A member 1 IHC Antibodies

Anti-GOLGA1 antibodies have IHC images from human paraffin sections and rat stomach, plus IF images from human cells (A13524-1, A13524, and M13524-1 catalog image captions).

Real IHC data IHC analysis of Golgin 97/GOLGA1 using anti-Golgin 97/GOLGA1 antibody (A13524-1). Golgin 97/GOLGA1 was detected in a paraffin-embedded section of human appendiceal adenocarcinoma tissue. Heat mediated antigen retrieval was performed in EDTA buffer (pH 8.0, epitope retrieval solution). The tissue section was blocked with 10% goat serum. The tissue section was then incubated with 2 μg/ml rabbit anti-Golgin 97/GOLGA1 Antibody (A13524-1) overnight at 4°C. Biotinylated goat anti-rabbit IgG was used as secondary antibody and incubated for 30 minutes at 37°C. The tissue section was developed using Strepavidin-Biotin-Complex (SABC) (Catalog # SA1022) with DAB as the chromogen.
Anti-Golgin 97/GOLGA1 Antibody ®
Cat # A13524-1
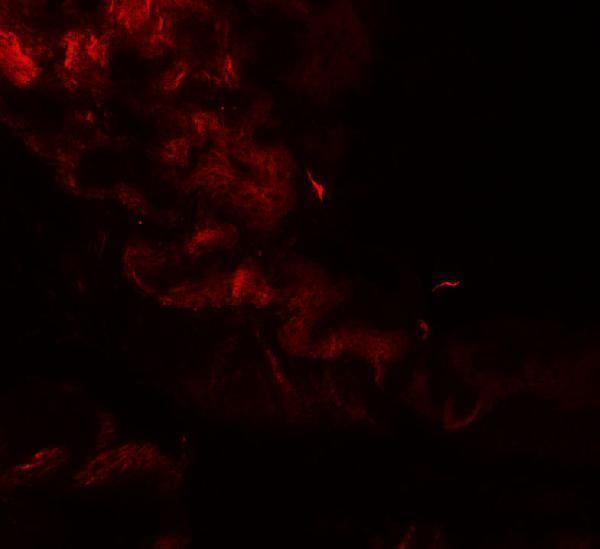
Real IHC data Immunohistochemistry of GOLGIN97 in rat stomach tissue with GOLGIN97 antibody at 5 μg/mL.
Anti-GOLGIN97 GOLGA1 Antibody
Cat # A13524
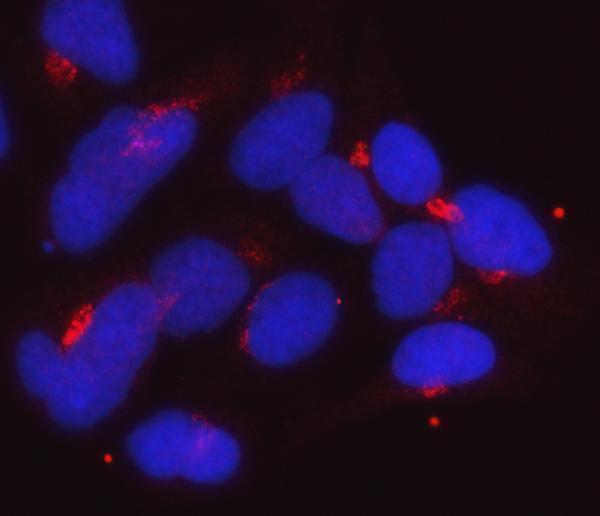
Real IF data IF analysis of Golgin 97/GOLGA1 using anti-Golgin 97/GOLGA1 antibody (M13524-1). Golgin 97/GOLGA1 was detected in an immunocytochemical section of Hela cells. Enzyme antigen retrieval was performed using IHC enzyme antigen retrieval reagent (AR0022) for 15 mins. The cells were blocked with 10% goat serum. And then incubated with 5 μg/mL mouse anti-Golgin 97/GOLGA1 Antibody (M13524-1) overnight at 4°C. Cy3 Conjugated Goat Anti-Mouse IgG (BA1031) was used as secondary antibody at 1:100 dilution and incubated for 30 minutes at 37°C. The section was counterstained with DAPI. Visualize using a fluorescence microscope and filter sets appropriate for the label used.
Anti-Golgin 97/GOLGA1 Antibody ® (monoclonal, 8E4H1)
Cat # M13524-1

A13524-1 shows IHC in human paraffin-embedded appendiceal adenocarcinoma and IF/ICC in SiHa cells; A13524 shows IHC and IF in rat stomach (catalog image captions). M13524-1 shows IF/ICC in HeLa cells and has no listed IHC application (M13524-1 catalog applications and IF image caption).

Which to pick: For tissue IHC, choose A13524-1 for human paraffin sections or A13524 for rat stomach IHC-P; neither IHC caption reports the fixative (A13524-1 and A13524 IHC image captions). For IF/ICC, M13524-1 is a human-reactive mouse monoclonal, clone 8E4H1, with a HeLa IF image (M13524-1 catalog applications, reactivity, clone, and IF image caption). For cross-species studies, A13524 and A13524-1 list human, mouse, and rat reactivity; their IHC images demonstrate rat and human tissue, respectively (catalog reactivity; A13524 and A13524-1 IHC image captions).

Each figure is that product's own IHC / IF validation image from its datasheet.

References

  1. UniProt Consortium. UniProt entry Q92805 (GOGA1_HUMAN, Golgin subfamily A member 1).
  2. Human Protein Atlas. GOLGA1 tissue IHC expression (reliability: Supported).
  3. Human Protein Atlas. GOLGA1 subcellular location (ICC-IF): Localized to the Golgi apparatus..
  4. Human Protein Atlas. GOLGA1 antibody validation summary (3 antibodies).
  5. Widespread but tissue-specific patterns of interferon-induced transmembrane protein 3 (IFITM3, FRAGILIS, MIL-1) in the mouse gastrula. Gene expression patterns : GEP 2013 — PMC3704145.
  6. Proteomics and transcriptomics reveal molecular subtypes and biomarkers of advanced cutaneous T-cell lymphoma. Frontiers in oncology 2026 — PMC13414942.
  7. Axonal autophagosome maturation defect through failure of ATG9A sorting underpins pathology in AP-4 deficiency syndrome. Autophagy 2020 — PMC6999640.
  8. PubMed PMID:9324025 — UniProt-cited evidence.
  9. PubMed PMID:15164053 — UniProt-cited evidence.
  10. PubMed PMID:15489334 — UniProt-cited evidence.