This website uses cookies to ensure you get the best experience on our website.


- Table of Contents
Plan ROCK1 IHC in paraffin sections around the cytoplasmic staining observed in most tissues (HPA tissue IHC). Compare cell types with high staining against those with undetected staining, and score the chromogenic signal by cell type (HPA tissue IHC).

Expected localisation, validated protocols, controls and antibodies — the at-a-glance facts below, then the full design guide.
| Expected localisation | Predominantly cytoplasmic in tissue sections (HPA tissue IHC) | |
| Staining pattern | Cytoplasmic staining in most tissues (HPA tissue IHC) | |
| Antigen retrieval | Citrate pH 6 HIER, heat-mediated (datasheet M00722) | |
| Positive control | Appendix+4 more · see all | |
| Negative control | Heart muscle+1 more · see all |
| Fixation | Keep fixation consistent across sections (standard IHC practice; not target-specific); ROCK1-specific effects are unknown. | |
| Caveat | Staining varies by cell type within tissues (HPA tissue IHC) | |
| Regulation | No expression regulator established (UniProt) | |
| Isoform / epitope | No annotated isoforms or extracellular segment (UniProt) |
The catalog antibody’s IHC-P protocol (datasheet: M00722) is accompanied by published ROCK1 IHC conditions for prostate, corpora cavernosa, endometrial, and lymph-node tissue (PMC6781985; PMC12683496; PMC5647010; PMC5100726).
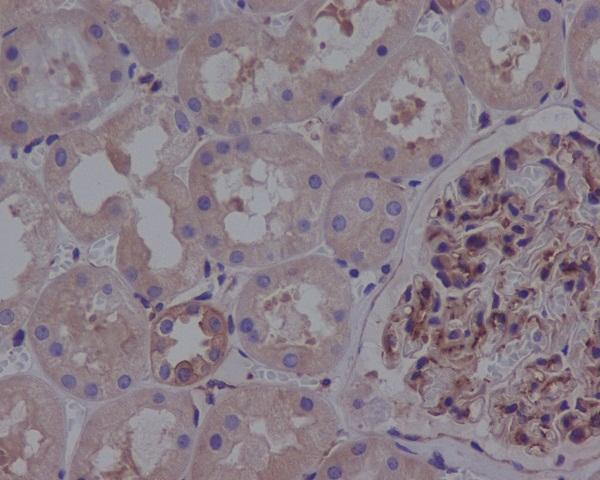
| Sample | Paraffin-embedded human kidney tissue; fixative not specified (datasheet M00722) |
| Fixation | Image fixative and duration unreported (datasheet M00722); verify before use. |
| Sectioning | 4–5 µm sections on charged slides (standard) |
| Deparaffinisation | Xylene, graded ethanol series to water (standard) |
| Antigen retrieval | Heat retrieval: Citrate pH 6, 20 min (datasheet M00722) |
| Peroxidase block | 3% H2O2, 10 min, room temperature (standard) |
| Blocking | 10% goat serum (datasheet M00722) |
| Primary antibody | Rabbit monoclonal (clone CDE-18) anti-ROCK1, 1:50 (datasheet M00722) |
| Primary incubation | Overnight at 4 °C (standard) |
| Detection | Streptavidin-biotin complex (SABC), DAB chromogen (datasheet M00722) |
| Counterstain | Hematoxylin, blue, dehydrate and mount (standard) |
| Expected result | ROCK1-positive staining in lymphoid tissue of appendix (HPA tissue IHC: High). HPA tissue profile: Cytoplasmic expression in most tissues. No signal in the no-primary control. |
ROCK1 is mainly cytoplasmic, with reported cytoskeletal, membrane, projection, centrosomal and minor Golgi associations; it has no transmembrane segment (UniProt Q13464). In IHC, expect cytoplasmic staining across many tissues, including strong staining in selected epithelial, hematopoietic, glomerular and macrophage populations (HPA tissue IHC). HPA rates its tissue staining “Approved,” with medium agreement with RNA data and external verification pending (HPA tissue IHC).
| Cytoplasmic staining is strong in bronchial respiratory epithelium, colonic glandular cells or lung macrophages. | This matches cell-specific high staining reported by HPA (HPA tissue IHC). Judge the named cells rather than the whole tissue: neighboring cells may differ. Confirm that the signal follows cell outlines and remains distinguishable from background (general IHC practice). |
| Signal is confined to nuclei, with little or no cytoplasmic staining in otherwise positive cells. | An exclusively nuclear pattern does not match HPA’s predominantly cytoplasmic tissue profile or UniProt’s listed locations (HPA tissue IHC; UniProt Q13464). Treat it as suspect and check localization with a second IHC-approved antibody and an appropriate positive section (HPA antibodies; general IHC practice). |
| Strong staining appears in cardiomyocytes or skeletal myocytes while suitable positive cells stain normally. | HPA reports ROCK1 as not detected in those cell types (HPA tissue IHC). Unexpected signal may reflect antibody cross-reactivity or endogenous detection activity; inspect adjacent cell types and detection controls before assigning it to myocytes (general IHC practice). |
| Brown signal coats many structures evenly or remains visible in areas without identifiable cells. | A uniform haze does not show the cell-specific cytoplasmic distribution described by HPA (HPA tissue IHC). Consider nonspecific binding, inadequate blocking or residual chromogen; compare a no-primary control and review washing and detection steps (general IHC practice). |
| No staining appears in a designated positive cell population, such as bone-marrow hematopoietic cells. | That conflicts with HPA’s high staining report for those cells (HPA tissue IHC). First confirm tissue identity and control performance, then review the antibody’s IHC-P instructions, retrieval, dilution and detection chemistry (general IHC practice). One negative section alone cannot establish absent ROCK1 expression. |
| Cell type within the tissue | HPA reports high signal in appendix lymphoid tissue, bone-marrow hematopoietic cells, bronchial epithelium, colonic and fallopian-tube glands, gallbladder glands, glomerular cells and lung macrophages (HPA tissue IHC). Assess the specified cells; a tissue-wide average can hide a valid focal pattern (general IHC practice). |
| Low and undetected comparators | Neuronal cells in hippocampus and caudate are low, while cardiomyocytes and skeletal myocytes are not detected in HPA tissue IHC (HPA tissue IHC). Use these as pattern comparisons, not proof that every cell on those sections must be unstained (general IHC practice). |
| Compartment and topology | ROCK1 is chiefly cytoplasmic; UniProt also lists cytoskeletal and cell-projection sites, centrosomal structures, cell membrane and a small Golgi-associated fraction (UniProt Q13464). It has no transmembrane segment (UniProt Q13464). Do not require a crisp membrane-only outline for a positive IHC call. |
| Strength of tissue-pattern evidence | Three listed antibodies have IHC “Approved” status, while HPA describes medium consistency with RNA and pending external verification (HPA antibodies; HPA tissue IHC). The payload does not report “Enhanced” validation. Interpret unexpected staining with controls and, where feasible, an independent IHC-approved antibody (general IHC practice). |
| What IF/ICC can establish here | HPA supplies no main ICC-IF location and no cell lines with ICC-IF images; the listed antibodies have no ICC status in the payload (HPA subcellular; HPA antibodies). For the separate IF/ICC guide, ask: “Is a ROCK1 IF pattern validated here?” Answer: “No IF localization pattern is established by these HPA records.” |
| Retrieval and epitope information | No antibody epitope or target-specific retrieval condition is supplied in the UniProt and HPA records. Follow the selected IHC-validated antibody’s documented IHC-P conditions and assess retrieval against a positive control (general IHC practice). These records do not establish that fixation changes ROCK1 staining. |
| Situation | Likely cause | Next action |
|---|---|---|
| Expected positive cells are blank. | The result disagrees with HPA’s high staining in the chosen cells; the reason is unresolved (HPA tissue IHC). | Check cell identity and section quality, then follow the selected antibody’s IHC-P retrieval and dilution instructions. Verify detection with a positive control (general IHC practice). |
| Only nuclei stain in otherwise suitable positive tissue. | Exclusive nuclear signal conflicts with ROCK1’s predominantly cytoplasmic distribution (HPA tissue IHC; UniProt Q13464). | Compare with a no-primary control and an independently IHC-approved ROCK1 antibody; review counterstain and chromogen appearance before scoring (HPA antibodies; general IHC practice). |
| Cardiomyocytes or skeletal myocytes stain strongly. | Those cell types are “Not detected” in HPA tissue IHC; cross-reactivity or endogenous detection activity is possible (HPA tissue IHC; general IHC practice). | Confirm which cells carry the signal. Run appropriate no-primary and detection controls, then compare staining with another IHC-approved antibody (HPA antibodies; general IHC practice). |
| Diffuse brown background obscures cell boundaries. | Nonspecific binding or detection background can conceal the cytoplasmic pattern expected by HPA (HPA tissue IHC; general IHC practice). | Inspect a no-primary control; review blocking, wash steps, antibody dilution and chromogen development under the selected IHC-P workflow (general IHC practice). |
| Signal is weak in a low-staining comparator. | HPA reports low staining in hippocampal or caudate neurons and several other specified cell populations (HPA tissue IHC). | Compare with a high-staining cell population on a suitable control section before changing conditions; a weak low-comparator signal alone is inconclusive (HPA tissue IHC; general IHC practice). |
| An IF image appears to disagree with the IHC pattern. | The supplied HPA subcellular record provides neither a main ICC-IF location nor ICC-IF images for ROCK1 (HPA subcellular). | Keep the IF interpretation separate. Verify cell identity, controls and antibody suitability within the dedicated IF/ICC guide; do not treat this IHC pattern as an IF validation (HPA antibodies; general IF practice). |
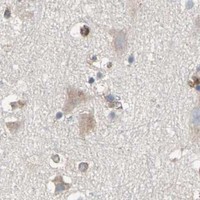


Comprehensive Human Protein Atlas IHC scoring per tissue (reliability: Approved — Medium consistency between antibody staining and RNA expression data. Pending external verification.). Rows are taken directly from the HPA tissue chart — click any row's HPA link to view the source.
| Tissue | Cell type | Level | Evidence | Source |
|---|---|---|---|---|
| Appendix | Lymphoid tissue | High | Protein (IHC) | HPA → |
| Bone marrow | Hematopoietic cells | High | Protein (IHC) | HPA → |
| Bronchus | Respiratory epithelial cells | High | Protein (IHC) | HPA → |
| Colon | Glandular cells | High | Protein (IHC) | HPA → |
| Fallopian tube | Glandular cells | High | Protein (IHC) | HPA → |
Troubleshoot ROCK1 staining in paraffin sections by checking retrieval, cell compartment, controls, and the limits of the available antibody evidence.
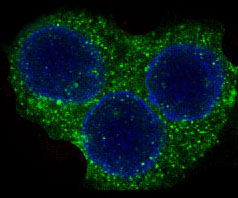
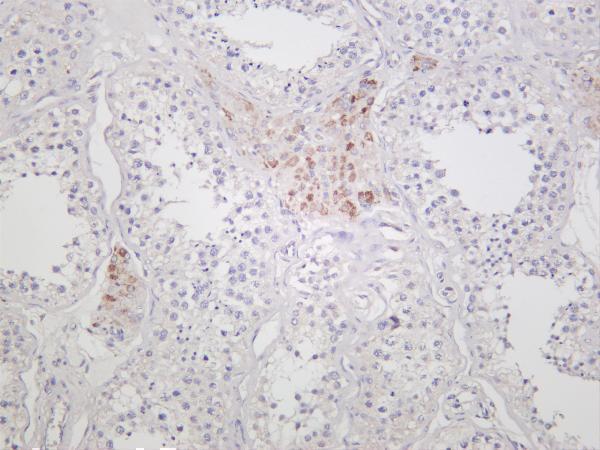
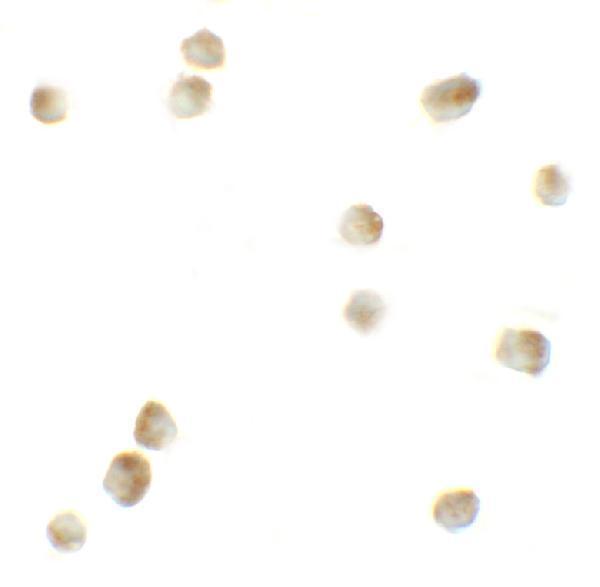
The catalog includes ROCK1 antibodies with IHC images from human kidney and testis, rat tissues, and an IF/ICC image from 293 cells (catalog image captions).
M00722 has IHC images from human kidney paraffin sections and rat tissues (M00722 image captions); M00722-2 has an IHC image from human testis (M00722-2 image caption). A00722 has an ICC image from 293 cells and lists IF and ICC applications (A00722 image captions and applications).
Which to pick: For tissue IHC, choose M00722 when a paraffin-section example is useful: its human kidney caption reports citrate retrieval at pH 6 for 20 minutes and 10% goat serum blocking; the fixative is unreported (M00722 image caption). For IF/ICC, choose A00722 for its 293-cell images, including IF at 20 μg/mL (A00722 image captions). For work spanning human and rat tissues, M00722 has IHC images in both species; mouse reactivity is listed, but no mouse IHC image is supplied (M00722 image captions and reactivity).