This website uses cookies to ensure you get the best experience on our website.


- Table of Contents
Real validated SEMA3A Western blot protocols, expected-band and isoform facts, troubleshooting for weak or shifted signal, and recommended anti-SEMA3A WB antibodies. Everything you need to plan the experiment before you commit precious samples.
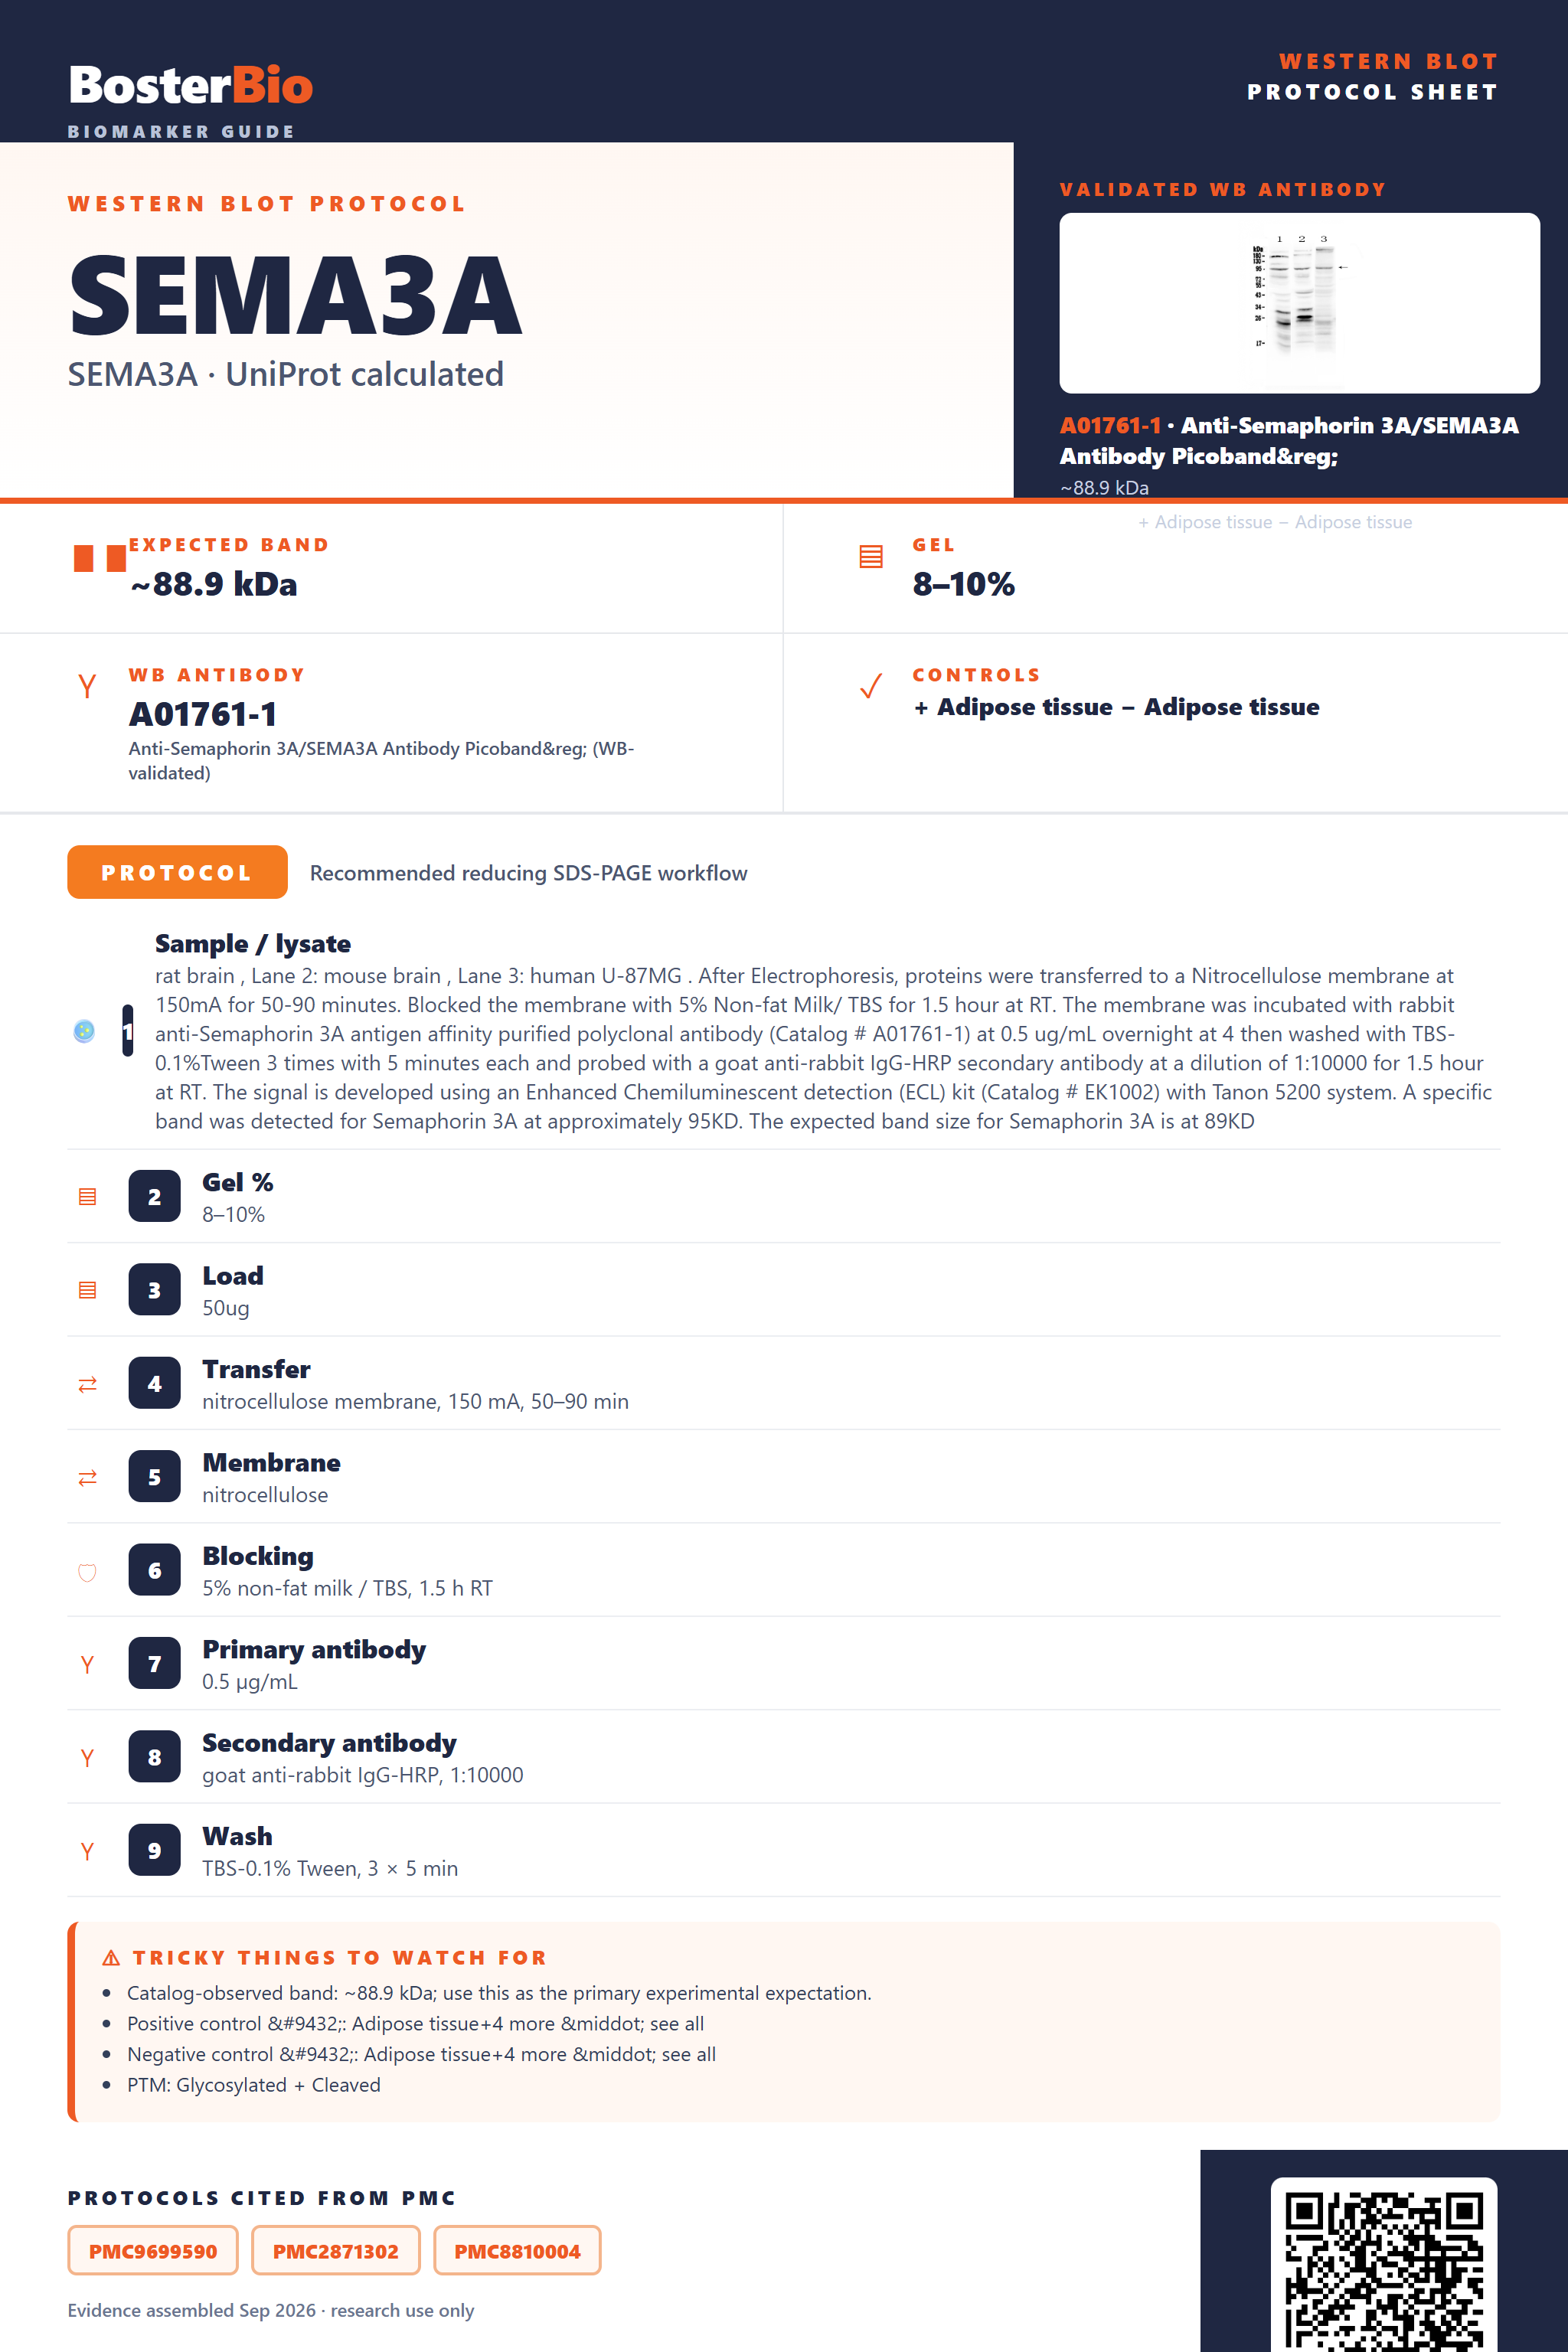
Expected bands, validated protocols, controls and antibodies — the at-a-glance facts below, then the full design guide.
| Expected band | ~88.9 kDa | |
| Observed band | ~95 kDa | |
| Gel | 8–10% | |
| Positive control | Adipose tissue+4 more · see all | |
| Negative control | Adipose tissue+4 more · see all |
| PTM | Glycosylated + Cleaved | |
| Caveat | N-linked glycosylation | |
| Regulation | LPS-induced | |
| Isoform | 1 isoform(s) |
Literature-validated Western blot parameters for SEMA3A — gel percentage, transfer, blocking, antibody incubation and detection, extracted from published methods.
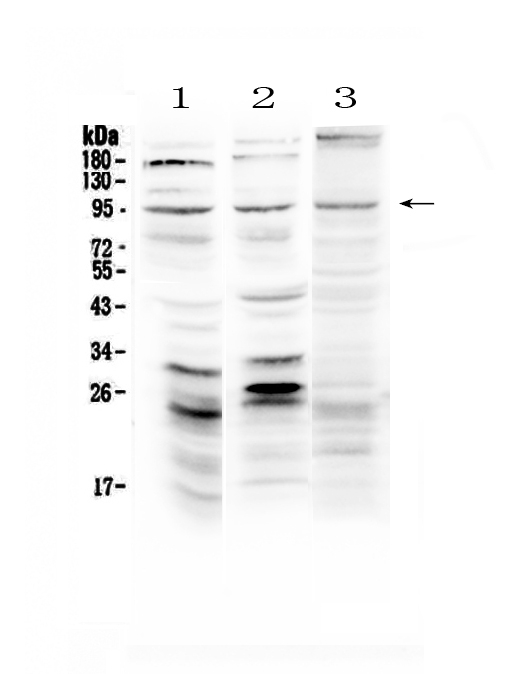
| Sample / lysate | rat brain , Lane 2: mouse brain , Lane 3: human U-87MG . After Electrophoresis, proteins were transferred to a Nitrocellulose membrane at 150mA for 50-90 minutes. Blocked the membrane with 5% Non-fat Milk/ TBS for 1.5 hour at RT. The membrane was incubated with rabbit anti-Semaphorin 3A antigen affinity purified polyclonal antibody (Catalog # A01761-1) at 0.5 ug/mL overnight at 4 then washed with TBS-0.1%Tween 3 times with 5 minutes each and probed with a goat anti-rabbit IgG-HRP secondary antibody at a dilution of 1:10000 for 1.5 hour at RT. The signal is developed using an Enhanced Chemiluminescent detection (ECL) kit (Catalog # EK1002) with Tanon 5200 system. A specific band was detected for Semaphorin 3A at approximately 95KD. The expected band size for Semaphorin 3A is at 89KD |
| Gel % | 8–10% |
| Load | 50ug |
| Transfer | nitrocellulose membrane, 150 mA, 50–90 min |
| Membrane | nitrocellulose |
| Blocking | 5% non-fat milk / TBS, 1.5 h RT |
| Primary antibody | 0.5 µg/mL |
| Secondary antibody | goat anti-rabbit IgG-HRP, 1:10000 |
| Wash | TBS-0.1% Tween, 3 × 5 min |
| Detection | ECL |
| Exposure / imaging | Tanon 5200 |
| Observed band | 95 kDa |
SEMA3A has an 88.9 kDa predicted backbone but runs at ~95 kDa on blots, mainly due to N-glycosylation after signal-peptide cleavage.
| single band near 90-95 kDa | mature secreted SEMA3A after signal peptide cleavage, close to the 88.9 kDa predicted mass with added glycan mass |
| band running at ~95 kDa, above the 88.9 kDa predicted size | the three N-glycosylation sites add carbohydrate mass that shifts the apparent size upward from predicted |
| broad or smeared band rather than a sharp line | heterogeneous glycan occupancy across the three N-glycosylation sites produces a mixture of glycoforms |
| mature band slightly smaller than the full-length translated precursor | cleavage of the 20-residue signal peptide removes mass as the protein is processed for secretion |
| little or no band in whole-cell lysate | SEMA3A is a secreted protein, so most of it partitions into conditioned media/extracellular space rather than the cell pellet |
| predicted mass from UniProt (88.9 kDa) | sets the baseline unmodified backbone size before any processing or modification |
| N-glycosylation at Asn53, Asn125, and Asn590 | adds carbohydrate mass that shifts the apparent band up toward the ~95 kDa observed size and can broaden it if glycoform occupancy varies |
| signal peptide cleavage (residues 1-20) | removes N-terminal mass during secretion, so the mature protein runs slightly smaller than the unprocessed precursor |
| secreted subcellular localization | reduces the amount of protein retained in whole-cell lysate, weakening or eliminating the band unless secreted fraction is sampled |
| bacterial or non-glycosylated recombinant standard | lacks eukaryotic glycosylation machinery, so it runs closer to the unmodified 88.9 kDa predicted mass, lower than native tissue-derived protein |
| Situation | Likely cause | Next action |
|---|---|---|
| No band in lysate | SEMA3A is secreted, so standard whole-cell lysate captures only the small intracellular pool before release | sample conditioned media or serum-free supernatant and include a known-positive tissue lysate such as brain as a control |
| Band higher than expected | N-glycosylation at three asparagine residues adds carbohydrate mass above the 88.9 kDa predicted backbone | treat the sample with PNGase F to deglycosylate and confirm the band shifts back toward the predicted size |
| Broad smear instead of sharp band | variable glycan occupancy across the three N-glycosylation sites generates a mixture of glycoforms | deglycosylate the sample before loading or use a lower-percentage gel with a longer run to improve resolution |
| Fragments below expected size | incomplete signal peptide processing or proteolytic degradation of the secreted protein during sample handling | add protease inhibitors during lysis or media collection and compare against a freshly prepared, minimally handled sample |
| Weak or no signal | secreted SEMA3A is diluted across the extracellular compartment and present at low levels in standard lysate preps | concentrate conditioned media before loading and increase total protein loaded per lane |
Comprehensive Human Protein Atlas IHC scoring per tissue. Rows are taken directly from the HPA tissue chart — click any row's HPA link to view the source.
| Tissue | Cell type | Level | Evidence | Source |
|---|---|---|---|---|
| Adipose tissue | adipocytes | Not detected | Protein (IHC) | HPA → |
| Adrenal gland | glandular cells | Not detected | Protein (IHC) | HPA → |
| Appendix | glandular cells | Not detected | Protein (IHC) | HPA → |
| Bone marrow | hematopoietic cells | Not detected | Protein (IHC) | HPA → |
| Breast | adipocytes | Not detected | Protein (IHC) | HPA → |
| Tissue | Cell type | Level | Evidence | Source |
|---|---|---|---|---|
| Adipose tissue | adipocytes | Not detected | Protein (IHC) | HPA → |
| Adrenal gland | glandular cells | Not detected | Protein (IHC) | HPA → |
| Appendix | glandular cells | Not detected | Protein (IHC) | HPA → |
| Bone marrow | hematopoietic cells | Not detected | Protein (IHC) | HPA → |
| Breast | adipocytes | Not detected | Protein (IHC) | HPA → |
Deeper troubleshooting and optimisation questions for SEMA3A, answered from its protein features.
BosterBio's SEMA3A antibodies are among the best-performing WB antibodies on the market — well cited, thoroughly validated, and orthogonally cross-validated against negative tissues and complementary methods.
These anti-SEMA3A antibodies are top-performing, extensively cited reagents whose specificity has been thoroughly validated by western blot and orthogonally cross-confirmed against negative-tissue controls and complementary methods, making them reliable choices for confident SEMA3A detection.
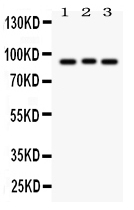
Which to pick: Two Boster antibodies are listed for SEMA3A—A01761-1 and PB9353—both with real western blot validation images. PB9353 (Picoband) shows clean bands in 293T and A549 lysates; A01761-1 provides classic SDS-PAGE validation. Either is a solid choice.