Click image to see more details
-

-
-
-
-
+3
Product Info Summary
| SKU: | M04035 |
|---|---|
| Size: | 100 μg/vial |
| Reactive Species: | Human, Mouse, Rat |
| Host: | Mouse |
| Application: | Flow Cytometry, IF, ICC, WB |
Customers Who Bought This Also Bought

Product info
Product Name
Anti-DHODH Antibody Picoband® (monoclonal, 4E3)
SKU/Catalog Number
M04035
Size
100 μg/vial
Form
Lyophilized
Description
Boster Bio Anti-DHODH Antibody Picoband® (monoclonal, 4E3) catalog # M04035. Tested in Flow Cytometry, IF, ICC, WB applications. This antibody reacts with Human, Mouse, Rat. The brand Picoband indicates this is a premium antibody that guarantees superior quality, high affinity, and strong signals with minimal background in Western blot applications. Only our best-performing antibodies are designated as Picoband, ensuring unmatched performance.
Storage & Handling
At -20°C for one year from date of receipt. After reconstitution, at 4°C for one month. It can also be aliquotted and stored frozen at -20°C for six months. Avoid repeated freezing and thawing.
Cite This Product
Anti-DHODH Antibody Picoband® (monoclonal, 4E3) (Boster Biological Technology, Pleasanton CA, USA, Catalog # M04035)
Host
Mouse
Contents
Each vial contains 4 mg Trehalose, 0.9 mg NaCl and 0.2 mg Na2HPO4.
Clonality
Monoclonal
Clone Number
4E3
Isotype
Mouse IgG2b
Immunogen
A synthetic peptide corresponding to a sequence at the N-terminus of human DHODH, different from the related mouse sequence by four amino acids, and from the related rat sequence by two amino acids.
Cross-reactivity
No cross-reactivity with other proteins.
Reactive Species
M04035 is reactive to DHODH in Human, Mouse, Rat
Observed Molecular Weight
43 kDa
Calculated molecular weight
42.9 kDa
Background of DHODH
Dihydroorotate dehydrogenase (DHODH) is an enzyme that in humans is encoded by the DHODH gene on chromosome 16. The protein encoded by this gene catalyzes the fourth enzymatic step, the ubiquinone-mediated oxidation of dihydroorotate to orotate, in de novo pyrimidine biosynthesis. This protein is a mitochondrial protein located on the outer surface of the inner mitochondrial membrane.
Antibody Validation
Boster validates all antibodies on WB, IHC, ICC, Immunofluorescence, and ELISA with known positive control and negative samples to ensure specificity and high affinity, including thorough antibody incubations.
Application & Images
Applications
M04035 is guaranteed for Flow Cytometry, IF, ICC, WB Boster Guarantee
Recommend Dilution
| Application | Dilution | Species |
|---|---|---|
| Western blot | 0.25-0.5 μg/ml | Human, Mouse, Rat |
| Immunocytochemistry/Immunofluorescence | 5 μg/ml | Human |
| Flow Cytometry (Fixed) | 1-3 μg/1x106 cells | Human |
Tested application
Suggested blocking solution with 5% non-fat milk or BSA; (*)Recommended protein loading: 20-40 µg per lane
Validation Images & Assay Conditions
Click image to see more details
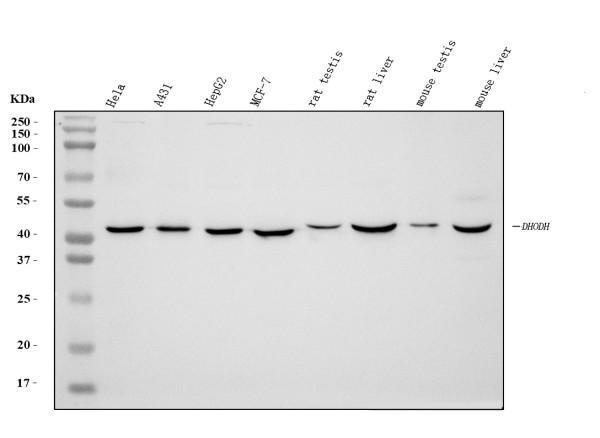
Western blot analysis of DHODH using anti-DHODH antibody (M04035).
Electrophoresis was performed on a 5-20% SDS-PAGE gel at 70V (Stacking gel) / 90V (Resolving gel) for 2-3 hours. The sample well of each lane was loaded with 30 ug of sample under reducing conditions.
Lane 1: human Hela whole cell lysates,
Lane 2: human A431 whole cell lysates,
Lane 3: human HepG2 whole cell lysates,
Lane 4: human MCF-7 whole cell lysates,
Lane 5: rat testis tissue lysates,
Lane 6: rat liver tissue lysates,
Lane 7: mouse testis tissue lysates,
Lane 8: mouse liver tissue lysates.
After electrophoresis, proteins were transferred to a nitrocellulose membrane at 150 mA for 50-90 minutes. Blocked the membrane with 5% non-fat milk/TBS for 1.5 hour at RT. The membrane was incubated with mouse anti-DHODH antigen affinity purified monoclonal antibody (Catalog # M04035) at 0.5 μg/mL overnight at 4°C, then washed with TBS-0.1%Tween 3 times with 5 minutes each and probed with a goat anti-mouse IgG-HRP secondary antibody at a dilution of 1:10000 for 1.5 hour at RT. The signal is developed using an Enhanced Chemiluminescent detection (ECL) kit (Catalog # EK1001) with Tanon 5200 system. A specific band was detected for DHODH at approximately 43 kDa. The expected band size for DHODH is at 43 kDa.

Click image to see more details
IF analysis of DHODH using anti-DHODH antibody (M04035).
DHODH was detected in an immunocytochemical section of MCF-7 cells. Enzyme antigen retrieval was performed using IHC enzyme antigen retrieval reagent (AR0022) for 15 mins. The cells were blocked with 10% goat serum. And then incubated with 5 μg/mL mouse anti-DHODH Antibody (M04035) overnight at 4°C. DyLight®488 Conjugated Goat Anti-Mouse IgG (BA1126) was used as secondary antibody at 1:100 dilution and incubated for 30 minutes at 37°C. The section was counterstained with DAPI. Visualize using a fluorescence microscope and filter sets appropriate for the label used.

Click image to see more details
Flow Cytometry analysis of U937 cells using anti-DHODH antibody (M04035).
Overlay histogram showing U937 cells stained with M04035 (Blue line). To facilitate intracellular staining, cells were fixed with 4% paraformaldehyde and permeabilized with permeabilization buffer. The cells were blocked with 10% normal goat serum. And then incubated with mouse anti-DHODH Antibody (M04035, 1 μg/1x106 cells) for 30 min at 20°C. DyLight®488 conjugated goat anti-mouse IgG (BA1126, 5-10 μg/1x106 cells) was used as secondary antibody for 30 minutes at 20°C. Isotype control antibody (Green line) was mouse IgG (1 μg/1x106) used under the same conditions. Unlabelled sample without incubation with primary antibody and secondary antibody (Red line) was used as a blank control.

Click image to see more details
USP24 inhibits ferroptosis by increasing the protein stabilization of DHODH. A , B Endogenous USP24 and DHODH interactions were detected by coimmunoprecipitation using USP24 and DHODH antibodies, respectively, in MDA-MB-231 and MDA-MB-468 cells. Quantification of protein levels, normalized to β-actin, was performed based on three independent experiments. Data were presented as Mean ± SD. * P < 0.05, ** P < 0.01, **** P < 0.0001. C , D The intracellular localization of USP24 (red) and DHODH (green) in MDA-MB-231 and MDA-MB-468 cells was examined by immunofluorescence staining using USP24 and DHODH antibodies and visualized by fluorescence microscopy. DAPI was used to stain nuclei. Scale bars: 5 μm. Immunofluorescence colocalization was quantified using the Manders’ coefficient. E , F The indicated MDA-MB-231 cell lines were pretreated with MG132 (10 μM) for 24 h, and then the extracts were immunoprecipitated with anti-DHODH antibodies and immunoblotted with anti-ubiquitin (Ub), anti-K48-linked ubiquitin, and anti-DHODH antibodies. Quantification of protein levels, normalized to β-actin, was performed based on three independent experiments. Data were presented as Mean ± SD. * P < 0.05, **** P < 0.0001. ns no significance. G , H MDA-MB-231 and MDA-MB-468 cells stably transfected with USP24 shRNA#1 or control shRNA were stably expressed with Flag-DHODH or control vector. USP24 and DHODH expression in cells was measured by Western blotting. Quantification of protein levels, normalized to β-actin, was performed based on three independent experiments. Data were presented as Mean ± SD. * P < 0.05, *** P < 0.001, **** P < 0.0001. ns no significance. I Cell death was assessed using propidium iodide (PI) staining in the indicated MDA-MB-231 and MDA-MB-468 cell lines treated with the indicated doses of RSL3 for 24 h. Quantification of PI-positive cells was shown. Mean ± SD, n = 3. ** P < 0.01, *** P < 0.001, **** P < 0.0001. ns no significance. J , K Migration ( J ) and cloning formation ( K ) abilities of the indicated MDA-MB-231 and MDA-MB-468 cell lines treated with RSL3 (0.5 μM for MDA-MB-231 cells; 0.25 μM for MDA-MB-468 cells) for 6 h. Mean ± SD, n = 3. * P < 0.05, ** P < 0.01, *** P < 0.001, **** P < 0.0001. ns no significance. L Lipid peroxidation of the indicated MDA-MB-231 and MDA-MB-468 cell lines treated with RSL3 (0.5 μM for MDA-MB-231 cells; 0.25 μM for MDA-MB-468 cells) for 6 h. Mean ± SD, n = 3. ** P < 0.01, **** P < 0.0001. ns no significance. M Cell death was assessed using propidium iodide (PI) staining in the indicated MDA-MB-231 and MDA-MB-468 cell lines treated with RSL3 (0.5 μM for MDA-MB-231 cells; 0.25 μM for MDA-MB-468 cells) in the presence or absence of MitoQH 2 (2.5 μM) for 24 h. Quantification of PI-positive cells was shown. Mean ± SD, n = 3. * P < 0.05, ** P < 0.01, *** P < 0.001, **** P < 0.0001.
Index in PubMed under a CC BY license. PMID: 40715045

Click image to see more details
DHODH is a substrate of USP24 in TNBC cells. A , B Cellular proteins in the indicated MDA-MB-231 and MDA-MB-468 cell lines was measured by Western blotting. Quantification of protein levels, normalized to β-actin, was performed based on three independent experiments. Data were presented as Mean ± SD. * P < 0.05, ** P < 0.01, *** P < 0.001, **** P < 0.0001. C , D Western blotting analysis of DHODH proteins in MDA-MB-231 and MDA-MB-468 cells treated with the indicated doses of WP1130 for 24 h. Quantification of protein levels, normalized to β-actin, was performed based on three independent experiments. Data were presented as Mean ± SD. ** P < 0.01, *** P < 0.001, **** P < 0.0001. E , F MDA-MB-231 cells were stably transfected with two individual USP9X shRNAs or control shRNA. USP9X expression in cells was measured by Western blotting. Quantification of protein levels, normalized to β-actin, was performed based on three independent experiments. Data were presented as Mean ± SD. * P < 0.05, ** P < 0.01. ns no significance. G , H Western blotting analysis of cellular proteins in the indicated MDA-MB-231 and MDA-MB-468 cell lines treated with cycloheximide (CHX, 100 μg/ml for MDA-MB-231 cells; 30 μg/ml for MDA-MB-468 cells) for the indicated time periods. Quantification of protein levels, normalized to β-actin, was performed based on three independent experiments. Data were presented as Mean ± SD. * P < 0.05, ** P < 0.01, *** P < 0.001. ns no significance. I , J MDA-MB-231 cells were treated with MG132 (10 μM) or chloroquine (CQ, 30 μM) for the indicated time periods. The protein levels of DHODH were measured by Western blotting. Quantification of protein levels, normalized to β-actin, was performed based on three independent experiments. Data were presented as Mean ± SD. * P < 0.05,, *** P < 0.001. ns no significance. K , L The indicated MDA-MB-231 and MDA-MB-468 cell lines were treated with or without MG132 (10 μM) for 12 h. The expression of DHODH and USP24 proteins was assessed by Western blotting. Quantification of protein levels, normalized to β-actin, was performed based on three independent experiments. Data were presented as Mean ± SD. * P < 0.05, ** P < 0.01, **** P < 0.0001. ns no significance.
Index in PubMed under a CC BY license. PMID: 40715045

Click image to see more details
USP24 inhibitor promotes RSL3-induced tumor suppression in TNBC in vivo. A Schematic of the anticancer effect of RSL3 (2 mg/kg/2 days) with or without WP1130 (25 mg/kg/2 days) in the MDA-MB-231 tumor xenograft models. B The tumor volume of each group was calculated every 2 days. C The excised tumors were photographed on day 22. D The tumor weights of each group. Mean ± SD, n = 6. **** P < 0.0001. E The mice body weight of each group was recorded every 2 days. F The expression of USP24, DHODH, Ki67, 4-HNE, and cleaved-caspase 3 were detected by immunohistochemical staining. Representative images and quantification in each group were shown (n = 3 samples). Scale bar, 20 μm. Mean ± SD, n = 3. * P < 0.05, ** P < 0.01, *** P < 0.001, **** P < 0.0001. ns no significance.
Index in PubMed under a CC BY license. PMID: 40715045

Click image to see more details
USP24 inhibits RSL3-induced tumor suppression in TNBC in vivo. A Schematic of the anticancer effect of RSL3 (2 mg/kg/2 days) in the indicated MDA-MB-231 tumor xenograft models. B The tumor volume of each group was calculated every 2 days. C The excised tumors were photographed on day 22. D The tumor weights of each group. Mean ± SD, n = 6. * P < 0.05, *** P < 0.001, **** P < 0.0001. E The mice body weight of each group was recorded every 2 days. F The expression of USP24, DHODH, Ki67, 4-HNE, and cleaved-caspase 3 were detected by immunohistochemical staining. Representative images and quantification in each group were shown (n = 3 samples). Scale bar, 20 μm. Mean ± SD, n = 3. * P < 0.05, ** P < 0.01, *** P < 0.001, **** P < 0.0001. ns no significance.
Index in PubMed under a CC BY license. PMID: 40715045
Specific Publications For Anti-DHODH Antibody Picoband® (monoclonal, 4E3) (M04035)
Loading publications
Recommended Resources
Here are featured tools and databases that you might find useful.
- Boster's Pathways Library
- Protein Databases
- Bioscience Research Protocol Resources
- Data Processing & Analysis Software
- Photo Editing Software
- Scientific Literature Resources
- Research Paper Management Tools
- Molecular Biology Software
- Primer Design Tools
- Bioinformatics Tools
- Phylogenetic Tree Analysis
Customer Reviews
Have you used Anti-DHODH Antibody Picoband® (monoclonal, 4E3)?
Share your experimental results or join a short interview to earn up to $1,000 in product credits or other rewards.
0 Reviews For Anti-DHODH Antibody Picoband® (monoclonal, 4E3)
Customer Q&As
Have a question?
Find answers in Q&As, reviews.
Can't find your answer?
Submit your question
