Click image to see more details
-

-
-
-
-
+4
Product Info Summary
| SKU: | A09018-1 |
|---|---|
| Size: | 100 μg/vial |
| Reactive Species: | Human |
| Host: | Rabbit |
| Application: | ELISA, Flow Cytometry, IF, ICC, WB |
Customers Who Bought This Also Bought

Product info
Product Name
Anti-HOXC10 Antibody Picoband®
SKU/Catalog Number
A09018-1
Size
100 μg/vial
Form
Lyophilized
Description
Boster Bio Anti-HOXC10 Antibody Picoband® catalog # A09018-1. Tested in ELISA, Flow Cytometry, IF, ICC, WB applications. This antibody reacts with Human. The brand Picoband indicates this is a premium antibody that guarantees superior quality, high affinity, and strong signals with minimal background in Western blot applications. Only our best-performing antibodies are designated as Picoband, ensuring unmatched performance.
Storage & Handling
Store at -20˚C for one year from date of receipt. After reconstitution, at 4˚C for one month. It can also be aliquotted and stored frozen at -20˚C for six months. Avoid repeated freeze-thaw cycles.
Cite This Product
Anti-HOXC10 Antibody Picoband® (Boster Biological Technology, Pleasanton CA, USA, Catalog # A09018-1)
Host
Rabbit
Contents
Each vial contains 4mg Trehalose, 0.9mg NaCl, 0.2mg Na2HPO4, 0.005mg NaN3.
Clonality
Polyclonal
Isotype
Rabbit IgG
Immunogen
E.coli-derived human HOXC10 recombinant protein (Position: M1-K250).
Cross-reactivity
No cross-reactivity with other proteins.
Reactive Species
A09018-1 is reactive to HOXC10 in Human
Observed Molecular Weight
48 kDa
Calculated molecular weight
38.1 kDa
Background of HOXC10
Homeobox protein Hox-C10 is a protein that in humans is encoded by the HOXC10 gene. This gene belongs to the homeobox family of genes. The homeobox genes encode a highly conserved family of transcription factors that play an important role in morphogenesis in all multicellular organisms. Mammals possess four similar homeobox gene clusters, HOXA, HOXB, HOXC and HOXD, which are located on different chromosomes and consist of 9 to 11 genes arranged in tandem. This gene is one of several homeobox HOXC genes located in a cluster on chromosome 12. The protein level is controlled during cell differentiation and proliferation, which may indicate this protein has a role in origin activation.
Antibody Validation
Boster validates all antibodies on WB, IHC, ICC, Immunofluorescence, and ELISA with known positive control and negative samples to ensure specificity and high affinity, including thorough antibody incubations.
Application & Images
Applications
A09018-1 is guaranteed for ELISA, Flow Cytometry, IF, ICC, WB Boster Guarantee
Recommend Dilution
| Application | Dilution | Species |
|---|---|---|
| Western blot | 0.25-0.5μg/ml | Human |
| Immunocytochemistry/Immunofluorescence | 5μg/ml | Human |
| Flow Cytometry (Fixed) | 1-3μg/1x106 cells | Human |
| ELISA | 0.1-0.5μg/ml | - |
Tested application
Suggested blocking solution with 5% non-fat milk or BSA; (*)Recommended protein loading: 20-40 µg per lane
Validation Images & Assay Conditions
Click image to see more details
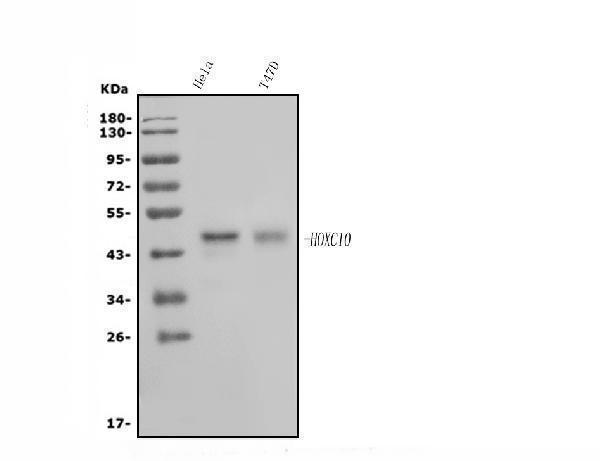
Western blot analysis of HOXC10 using anti-HOXC10 antibody (A09018-1).
Electrophoresis was performed on a 5-20% SDS-PAGE gel at 70V (Stacking gel) / 90V (Resolving gel) for 2-3 hours. The sample well of each lane was loaded with 30ug of sample under reducing conditions.
Lane 1: human Hela whole cell lysates,
Lane 2: human T-47D whole cell lysates.
After Electrophoresis, proteins were transferred to a Nitrocellulose membrane at 150mA for 50-90 minutes. Blocked the membrane with 5% Non-fat Milk/ TBS for 1.5 hour at RT. The membrane was incubated with rabbit anti-HOXC10 antigen affinity purified polyclonal antibody (Catalog # A09018-1) at 0.5 μg/mL overnight at 4°C, then washed with TBS-0.1%Tween 3 times with 5 minutes each and probed with a goat anti-rabbit IgG-HRP secondary antibody at a dilution of 1:5000 for 1.5 hour at RT. The signal is developed using an Enhanced Chemiluminescent detection (ECL) kit (Catalog # EK1002) with Tanon 5200 system. A specific band was detected for HOXC10 at approximately 48KD. The expected band size for HOXC10 is at 38KD.

Click image to see more details
RNA sequencing of callus. (A). Volcano plot of differential gene expression in bone suture tissue after mandible homotopic grafting and femoral homotopic grafting. The genes that were found to be statistically significant (false discovery rate ≤0.05) are highlighted. (B). Transcription factor enrichment analysis of bone suture tissue after mandible homotopic grafting and femoral homotopic grafting. (C–E) were the differential expressions of Hoxa, Hoxc and Hoxd clusters in bone suture tissue after mandible homotopic grafting and femoral homotopic grafting, respectively. (F). qPCR Hoxc10 was used to verify gene expression levels in mandible homotopic grafting, femoral heterotopic grafting and femoral homotopic grafting. (G). Heat maps depicting the expression patterns of distinct Hox family genes across three experimental groups, namely mandible homotopic grafting, femoral heterotopic grafting, and femoral homotopic grafting. (H). Functional enrichment analysis of all Hox genes. The data are presented as the mean ± SD ( n = 3). * p < 0.05.
Index in PubMed under a CC BY license. PMID: 39434203

Click image to see more details
Hoxc10 exists in mesodermal derived callus. The immunofluorescence of Sox9 and CD44 in the mandible homotopic grafting (A), femoral heterotopic grafting (B) and femoral homotopic grafting(C). Sox9 represents cartilage (red), CD44 is a BMSCs marker (green), and DAPI marks the nucleus. (Scale bars, 500 μm) (D–F) represent the immunofluorescence of CD105 in mandible homotopic grafting, femoral heterotopic grafting, and femoral homotopic grafting, respectively. The white dotted line shows the edge of the femoral graft and the mandibular graft, and the middle of the dotted line is the callus. (Scale bars, 200 μm) (G) Localization of Hoxc10 at callus in femoral heterotopic grafting. (Scale bars, 100 μm; Scale bars, 20 μm) The data are presented as the mean ± SD ( n = 6). * p < 0.05.
Index in PubMed under a CC BY license. PMID: 39434203

Click image to see more details
Hoxc10 is retained in L/M‐BMSCs in vitro. (A) Schematic of Transwell co‐culture model of L‐BMSCs and M‐BMSCs. (B) Schematic of the limb bones and mandibles from different embryonic origins. The mandible is of neural crest origin (blue) and the limb bone is of mesodermal origin (orange) (C) qPCR verified the gene expression levels of Sox9 and Col2a1 before and after co‐culture of L‐BMSCs and M‐BMSCs. (D) The proliferation, osteogenic and chondrogenic genes of femoral homotopic grafting, femoral heterotopic grafting and mandibles homotopic grafting. (E) After 21 days of chondrogenic induction in the upper layer cells of Transwell model before and after co cultivation with L‐BMSCs and M‐BMSCs, blue stained proteoglycans were observed using Alcian blue. (F) Quantitative analysis of Alizarin blue staining before and after co culture of L‐BMSCs and M‐BMSCs. The data are presented as the mean ± SD ( n = 3). * p < 0.05.
Index in PubMed under a CC BY license. PMID: 39434203

Click image to see more details
Hoxc10 is positively correlated with cartilage. n (C) q‐PCR validated the expression levels of Sox9 gene after overexpression and knockout of Hoxc10. (D) q‐PCR validated the expression levels of the Col2a1 gene after overexpression and knockout of Hoxc10. (E) q‐PCR validated the expression levels of Aggrecan gene after overexpression and knockout of Hoxc10. (F) The proteoglycan of BMSCs after overexpression and knockdown Hoxc10 was observed by Alcian blue staining 21 days after chondrogenic induction. (G) Quantitative analysis of Alcian blue staining. (H) Schematic diagram of co‐culture of L‐BMSCs and M‐BMSCs with and without Hoxc10 knockout. (I) Col2a1 gene expression in L‐BMSCs after Hoxc10 knockout and co‐culture with M‐BMSCs compared to control. (J) ChIP experiment of Sox9 and Hoxc10 protein binding. The data are presented as the mean ± SD ( n = 3).* p < 0.05.
Index in PubMed under a CC BY license. PMID: 39434203

Click image to see more details
Hoxc10 deletion facilitates the healing process of heterotopic femoral bone graft. (A)The experimental and control groups were imaged on day 4 using an in vivo bioluminescence imaging system. RNA was extracted after Adenovirus (AD)‐Hoxc10‐shRNA virus transfection, and q‐PCR experiments were performed to verify the viral transfection efficiency. Safranin O/fast green staining (B), haematoxylin and eosin staining (C), and Masson staining (D) were used to evaluate the effect of cartilage healing after Hoxc10 knockdown compared with control group. The distance between black arrows represents the width of the suture after healing. (Scale bar = 500 μm at lower magnifications, Scale bar = 200 μm at higher magnifications). (E) Immunohistochemistry to evaluate the expression levels of CD31 and Col10a1 before and after Hoxc10 knockdown. (Scale bar = 500 μm) (F) Quantification of red cartilage tissue stained with Safranin O/fast green staining after Hoxc10 knockdown. (G) Quantitative analysis of inflammatory cells in haematoxylin and eosin staining. (H) Quantification of CD31 before and after Hoxc10 knockdown. (I) Quantification of Col10a1 before and after Hoxc10 knockdown. The data are presented as the mean ± SD. The experiment was repeated three times. ( n = 3).
Index in PubMed under a CC BY license. PMID: 39434203

Click image to see more details
IF analysis of HOXC10 using anti-HOXC10 antibody (A09018-1).
HOXC10 was detected in immunocytochemical section of T-47D cells. Enzyme antigen retrieval was performed using IHC enzyme antigen retrieval reagent (AR0022) for 15 mins. The cells were blocked with 10% goat serum. And then incubated with 5μg/mL rabbit anti-HOXC10 Antibody (A09018-1) overnight at 4°C. DyLight®488 Conjugated Goat Anti-Rabbit IgG (BA1127) was used as secondary antibody at 1:100 dilution and incubated for 30 minutes at 37°C. The section was counterstained with DAPI. Visualize using a fluorescence microscope and filter sets appropriate for the label used.

Click image to see more details
Flow Cytometry analysis of U251 cells using anti-HOXC10 antibody (A09018-1).
Overlay histogram showing U251 cells stained with A09018-1 (Blue line). To facilitate intracellular staining, cells were fixed with 4% paraformaldehyde and permeabilized with permeabilization buffer. The cells were blocked with 10% normal goat serum. And then incubated with rabbit anti-HOXC10 Antibody (A09018-1, 1μg/1x106 cells) for 30 min at 20°C. DyLight®488 conjugated goat anti-rabbit IgG (BA1127, 5-10μg/1x106 cells) was used as secondary antibody for 30 minutes at 20°C. Isotype control antibody (Green line) was rabbit IgG (1μg/1x106) used under the same conditions. Unlabelled sample without incubation with primary antibody and secondary antibody (Red line) was used as a blank control.
Specific Publications For Anti-HOXC10 Antibody Picoband® (A09018-1)
Loading publications
Recommended Resources
Here are featured tools and databases that you might find useful.
- Boster's Pathways Library
- Protein Databases
- Bioscience Research Protocol Resources
- Data Processing & Analysis Software
- Photo Editing Software
- Scientific Literature Resources
- Research Paper Management Tools
- Molecular Biology Software
- Primer Design Tools
- Bioinformatics Tools
- Phylogenetic Tree Analysis
Customer Reviews
Have you used Anti-HOXC10 Antibody Picoband®?
Share your experimental results or join a short interview to earn up to $1,000 in product credits or other rewards.
0 Reviews For Anti-HOXC10 Antibody Picoband®
Customer Q&As
Have a question?
Find answers in Q&As, reviews.
Can't find your answer?
Submit your question
