Click image to see more details
-

-
-
-
-
+6
Product Info Summary
| SKU: | A00021-3 |
|---|---|
| Size: | 100 μg/vial |
| Reactive Species: | Mouse, Rat |
| Host: | Rabbit |
| Application: | ELISA, IHC |
Customers Who Bought This Also Bought

Product info
Product Name
Anti-IL10 Antibody
SKU/Catalog Number
A00021-3
Size
100 μg/vial
Form
Lyophilized
Description
Boster Bio Anti-IL10 Antibody catalog # A00021-3. Tested in ELISA, IHC applications. This antibody reacts with Mouse, Rat.
Storage & Handling
Store at -20˚C for one year from date of receipt. After reconstitution, at 4˚C for one month. It can also be aliquotted and stored frozen at -20˚C for six months. Avoid repeated freeze-thaw cycles.
Cite This Product
Anti-IL10 Antibody (Boster Biological Technology, Pleasanton CA, USA, Catalog # A00021-3)
Host
Rabbit
Contents
Each vial contains 4 mg Trehalose, 0.9 mg NaCl and 0.2 mg Na2HPO4.
Clonality
Polyclonal
Isotype
Rabbit IgG
Immunogen
E.coli-derived rat IL10 recombinant protein (Position: K52-A170).
Cross-reactivity
No cross-reactivity with other proteins.
Reactive Species
A00021-3 is reactive to Il10 in Mouse, Rat
Calculated molecular weight
20.4 kDa
Background of Il10
Interleukin-10 (IL-10 or IL10), also known as human cytokine synthesis inhibitory factor (CSIF), is an anti-inflammatory cytokine. In humans IL-10 is encoded by the IL10 gene. It is capable of inhibiting synthesis of pro-inflammatory cytokines like IFN-gamma, IL-2, IL-3, TNFalpha and GM-CSF made by cells such as macrophages and regulatory T-cells.IL-10 also displays potent abilities to suppress the antigen presentation capacity of antigen presenting cells. Kim et al. (1992) showed that the mouse IL 10 gene contains 5 exons and spans about 5.2 kb of genomic DNA. Eskdale et al. (1997) mapped the IL10 gene to the junction between 1q31 and 1q32.
Antibody Validation
Boster validates all antibodies on WB, IHC, ICC, Immunofluorescence, and ELISA with known positive control and negative samples to ensure specificity and high affinity, including thorough antibody incubations.
Application & Images
Applications
A00021-3 is guaranteed for ELISA, IHC Boster Guarantee
Recommend Dilution
| Application | Dilution | Species |
|---|---|---|
| Immunohistochemistry (Paraffin-embedded Section) | 2-5μg/ml | Mouse, Rat |
| ELISA | 0.1-0.5μg/ml |
Tested application
Use TE buffer pH 9.0 for antigen retrieval; (*) citrate buffer pH 6.0 is an alternative.
Validation Images & Assay Conditions
Click image to see more details
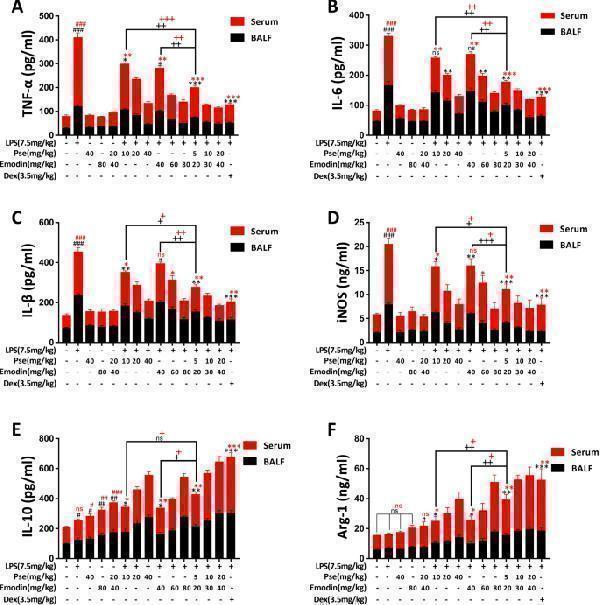
Effects of Pseudoephedrine + emodin on the expression of TNF-α, IL-6, IL-1β, iNOS, IL-10, Arg-1 in LPS‐induced ALI rats. The contents of TNF-α ( A ), IL-6 ( B ), IL-1β ( C ), iNOS ( D ), IL-10 ( E ), Arg-1 ( F ) in the serum and BALF were determined using ELISA. Data were expressed as mean ± S.D. (n = 3). # p < 0.05, ## p < 0.01, ### p < 0.001 vs. control group. *p < 0.05, **p < 0.01, ***p < 0.001 vs. LPS alone group. + p < 0.05, ++ p < 0.01, +++ p < 0.001 vs. combined treatment group (5 + 20 mg/kg)
Index in PubMed under a CC BY license. PMID: 35123524

Click image to see more details
Effects of VIP on levels of inflammatory and anti-inflammatory cytokines in LPS + IFN-γ or IL-4 + IL-13 induced AMs cells. Macrophages were pre-treated with VIP(10 –6 ,10 –7 , 10 –8 mol/L) for 24 h, followed by LPS (100 ng/mL) + IFN-γ(20 ng/mL) or IL-4 (40 ng/mL) + IL-13(20 ng/mL) stimulation for 12 h. Cells were collected and the contents of TNF-α ( A ), IL-6 ( B ), IL-10 ( C ), Arg-1 ( D ) were determined using ELISA. (E-J) TNF-α, IL-6, iNOS, IL-10, Arg-1, Ym-1 mRNA expression was determined using Real-time PCR analysis. Data were expressed as mean ± S.D. (n = 3). # p < 0.05, ## p < 0.01, ### p < 0.001 vs. control group. *p < 0.05, **p < 0.01, ***p < 0.001 vs. LPS alone group. +p < 0.05, + + p < 0.01, +++ p < 0.001 vs. IL-4 alone group
Index in PubMed under a CC BY license. PMID: 35123524

Click image to see more details
VIP inhibited (M1) macrophage and activated (M2) macrophage in LPS + IFN-γ‐induced or IL-4 + IL-13-induced AMs. Effects of Pseudoephedrine + emodin on the expression of VIP in LPS‐induced ALI rats. A – D , F , H , I (M1) macrophage Marker CD86, IL-6 and (M2) macrophage Marker CD206, IL-10 expression was determined using immunofluorescence. E , G CD86, CD206 mRNA expression was determined using Real-time PCR analysis. J The contents of VIP in the serum of ALI rats were determined using ELISA. Data are expressed as mean ± S.D. (n = 3). ## p < 0.01, ### p < 0.001 vs. control group. *p < 0.05, **p < 0.01 vs. LPS alone group. +p < 0.05, ++ p < 0.01, +++ p < 0.001 vs. IL-4 alone group
Index in PubMed under a CC BY license. PMID: 35123524

Click image to see more details
Pseudoephedrine + emodin Inhibited MAPK in LPS-induced acute lung injury in rats. A – D Western blot analysis was performed to detect p-P38, p-ERK1/2 and p-JNK1/2 protein expression. E – I TNF-α, IL-6, IL-1β, IL-10, Arg-1 mRNA expression was determined using Real-time PCR analysis. All data are expressed as mean ± S.D. (n = 3). ## p < 0.01, ### p < 0.001 vs. control group. *p < 0.05, **p < 0.01, ***p < 0.001 vs. LPS alone group. + p < 0.05, ++ p < 0.01, +++ p < 0.001 vs. Combined treatment group (5 + 20 mg/kg)
Index in PubMed under a CC BY license. PMID: 35123524

Click image to see more details
Effects of polysaccharide extract from XJEK on TNF-α, IL-1β and IL-10 of HUVECs induced by Ang II. ( a ) TNF-α level in supernatants of HUVECs; ( b ) IL-1β level in supernatants of HUVECs; ( c ) IL-10 level in supernatants of HUVECs. 1, blank control group; 2, Ang II (10 − 5 mol/L) group; 3, Ang II (10 − 5 mol/L) + AqE (0.15 mg/ml) group; 4, Ang II (10 − 5 mol/L) + AqE (0.3 mg/ml) group; 5, Ang II (10 − 5 mol/L) + AqE (0.6 mg/ml) group; 6, Ang II (10 − 5 mol/L) + AqE (1.2 mg/ml) group; 7, Ang II (10 − 5 mol/L) + XJEK (1.6 mg/ml) group. Data are expressed as mean ± SD, n = 6. ** P < 0.01 vs control group; ## P < 0.01 vs Ang II group
Index in PubMed under a CC BY license. PMID: 31196042

Click image to see more details
Effects of polysaccharide extract from XJEK on TNF-α, IL-1β and IL-10 in L -NAME-induced hypertensive mice. ( a ) TNF-α expression level in plasma. ( b ) IL-1β expression level in plasma. ( c ) IL-10 expression level in plasma. ( d ) IL-1β expression level in cardiac tissues. ( e ) TNF-α expression level in cardiac tissues. ( f ) IL-10 expression level in cardiac tissues. ( g ) Representative image of IL-1β immunocytochemistry. ( h ) Representative image of TNF-α immunocytochemistry.( i ) Representative image of IL-10 immunocytochemistry.1,negative group; 2,control group; 3, model group; 4, L -NAME+AqE group; 5, L -NAME+XJEK group; 6, L -NAME+fosinopril group. Data are presented as the mean ± SD ( n = 10). ** P < 0.01 vs. control group; # P < 0.05, ## P < 0.01 vs, model group
Index in PubMed under a CC BY license. PMID: 31196042

Click image to see more details
SADS inhibited Raw264.7 and fibroblast-like synoviocyte inflammation in vitro. (A) The effect of SADS on the viability of Raw264.7. (B–D) RT-PCR analysis of TNF-α, IL-6 and IL-10 in Raw264.7 treated with SADS.(E) The effect of SADS on the viability of fibroblast-like synoviocytes. (F–H) RT-PCR analysis of TNF-α, IL-6 and IL-10 in fibroblast-like synoviocytes treated with SADS.(I) The phenotype of Raw264.7 was analyzed by flow cytometry.(J and K) Statistics of the proportion of M2 and M1 macrophages. (L and M) TNF-α protein expression level detection. ##P < 0.01 versus Ctrl; ∗∗P < 0.01versus LPS. n = 6.
Index in PubMed under a CC BY license. PMID: 40688514

Click image to see more details
Pathological evaluation of IL-1RA−/− mice synovial tissue. HE staining showed synovial hyperplasia (A) and inflammation (B). (C) IHC staining of TNF-α in synovial tissue. (D) IHC staining of IL-10 in synovial tissue.(E and F) Levels of TNF-α and IL-10 in the blood of IL1RA−/ -deficient mice. ##P < 0.01 versus Ctrl; ∗∗P < 0.01versus Model. n = 6 mice for each group. Control is wild-type mice, and the model is IL1RA−/− mice.
Index in PubMed under a CC BY license. PMID: 40688514

Click image to see more details
IHC analysis of IL10 using anti-IL10 antibody (A00021-3).
IL10 was detected in paraffin-embedded section of mouse spleen tissue. Heat mediated antigen retrieval was performed in EDTA buffer (pH8.0, epitope retrieval solution). The tissue section was blocked with 10% goat serum. The tissue section was then incubated with 2μg/ml rabbit anti-IL10 Antibody (A00021-3) overnight at 4°C. Biotinylated goat anti-rabbit IgG was used as secondary antibody and incubated for 30 minutes at 37°C. The tissue section was developed using Strepavidin-Biotin-Complex (SABC) (Catalog # SA1022) with DAB as the chromogen.

Click image to see more details
IHC analysis of IL10 using anti-IL10 antibody (A00021-3).
IL10 was detected in paraffin-embedded section of rat spleen tissue. Heat mediated antigen retrieval was performed in EDTA buffer (pH8.0, epitope retrieval solution). The tissue section was blocked with 10% goat serum. The tissue section was then incubated with 2μg/ml rabbit anti-IL10 Antibody (A00021-3) overnight at 4°C. Biotinylated goat anti-rabbit IgG was used as secondary antibody and incubated for 30 minutes at 37°C. The tissue section was developed using Strepavidin-Biotin-Complex (SABC) (Catalog # SA1022) with DAB as the chromogen.
Specific Publications For Anti-IL10 Antibody (A00021-3)
Loading publications
Recommended Resources
Here are featured tools and databases that you might find useful.
- Boster's Pathways Library
- Protein Databases
- Bioscience Research Protocol Resources
- Data Processing & Analysis Software
- Photo Editing Software
- Scientific Literature Resources
- Research Paper Management Tools
- Molecular Biology Software
- Primer Design Tools
- Bioinformatics Tools
- Phylogenetic Tree Analysis
Customer Reviews
Have you used Anti-IL10 Antibody?
Share your experimental results or join a short interview to earn up to $1,000 in product credits or other rewards.
0 Reviews For Anti-IL10 Antibody
Customer Q&As
Have a question?
Find answers in Q&As, reviews.
Can't find your answer?
Submit your question
