Click image to see more details
-

-
-
-
-
+1
Product Info Summary
| SKU: | A00667-1 |
|---|---|
| Size: | 100 μg/vial |
| Reactive Species: | Human, Mouse, Rat |
| Host: | Rabbit |
| Application: | ELISA, WB |
Customers Who Bought This Also Bought

Product info
Product Name
Anti-Thrombospondin/THBS1 Antibody Picoband®
SKU/Catalog Number
A00667-1
Size
100 μg/vial
Form
Lyophilized
Description
Boster Bio Anti-Thrombospondin/THBS1 Antibody Picoband® catalog # A00667-1. Tested in ELISA, WB applications. This antibody reacts with Human, Mouse, Rat. The brand Picoband indicates this is a premium antibody that guarantees superior quality, high affinity, and strong signals with minimal background in Western blot applications. Only our best-performing antibodies are designated as Picoband, ensuring unmatched performance.
Storage & Handling
Store at -20˚C for one year from date of receipt. After reconstitution, at 4˚C for one month. It can also be aliquotted and stored frozen at -20˚C for six months. Avoid repeated freeze-thaw cycles.
Cite This Product
Anti-Thrombospondin/THBS1 Antibody Picoband® (Boster Biological Technology, Pleasanton CA, USA, Catalog # A00667-1)
Host
Rabbit
Contents
Each vial contains 4mg Trehalose, 0.9mg NaCl, 0.2mg Na2HPO4, 0.05mg NaN3.
Clonality
Polyclonal
Isotype
Rabbit IgG
Immunogen
E. coli-derived human Thrombospondin recombinant protein (Position: D27-H112). Human Thrombospondin shares 81.4% amino acid (aa) sequence identity with mouse Thrombospondin.
Cross-reactivity
No cross-reactivity with other proteins.
Reactive Species
A00667-1 is reactive to THBS1 in Human, Mouse, Rat
Observed Molecular Weight
165 kDa, 180 kDa
Calculated molecular weight
129.4 kDa
Background of THBS1
THBS1 is also known as Thrombospondin 1, TSP1. The protein encoded by this gene is a subunit of a disulfide-linked homotrimeric protein. It is an adhesive glycoprotein that mediates cell-to-cell and cell-to-matrix interactions. This protein can bind to fibrinogen, fibronectin, laminin, type V collagen and integrins alpha-V/beta-1. It has been shown to play roles in platelet aggregation, angiogenesis, and tumorigenesis. In addition, the thrombospondin-1 protein is a member of the thrombospondinfamily. It is a multi-domain matrix glycoprotein that has been shown to be a natural inhibitor of neovascularization and tumorigenesis in healthy tissue. Both positive and negative modulation of endothelial cell adhesion, motility, and growth have been attributed to TSP1. This should not be surprising considering that TSP1 interacts with at least 12 cell adhesion receptors, including CD36, αv integrins, β1 integrins, syndecan, and integrin-associated protein (IAP or CD47). It also interacts with numerous proteases involved in angiogenesis, including plasminogen, urokinase, matrix metalloproteinase,thrombin, cathepsin, and elastase.
Antibody Validation
Boster validates all antibodies on WB, IHC, ICC, Immunofluorescence, and ELISA with known positive control and negative samples to ensure specificity and high affinity, including thorough antibody incubations.
Application & Images
Applications
A00667-1 is guaranteed for ELISA, WB Boster Guarantee
Recommend Dilution
| Application | Dilution | Species |
|---|---|---|
| ELISA | 0.1-0.5μg/ml | - |
| Western blot | 0.1-0.5μg/ml | Human, Mouse, Rat |
Tested application
Suggested blocking solution with 5% non-fat milk or BSA; (*)Recommended protein loading: 20-40 µg per lane
Validation Images & Assay Conditions
Click image to see more details
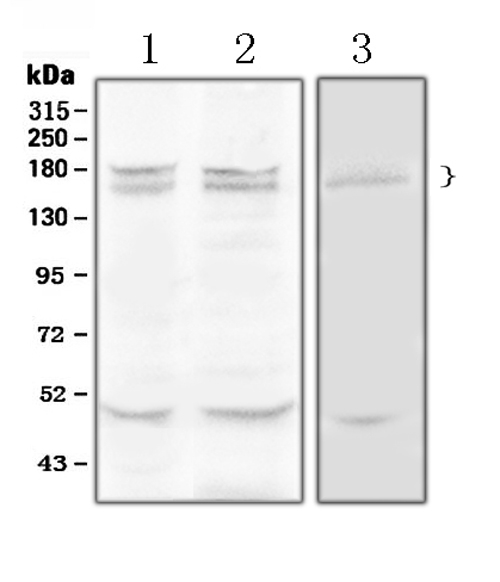
Western blot analysis of Thrombospondin using anti-Thrombospondin antibody (A00667-1).
Electrophoresis was performed on a 5-20% SDS-PAGE gel at 70V (Stacking gel) / 90V (Resolving gel) for 2-3 hours. The sample well of each lane was loaded with 50ug of sample under reducing conditions.
Lane 1: rat liver tissue lysates,
Lane 2: mouse liver tissue lysates,
Lane 3: HELA whole Cell lysates.
After Electrophoresis, proteins were transferred to a Nitrocellulose membrane at 150mA for 50-90 minutes. Blocked the membrane with 5% Non-fat Milk/ TBS for 1.5 hour at RT. The membrane was incubated with rabbit anti-Thrombospondin antigen affinity purified polyclonal antibody (Catalog # A00667-1) at 0.5 μg/mL overnight at 4°C, then washed with TBS-0.1%Tween 3 times with 5 minutes each and probed with a goat anti-rabbit IgG-HRP secondary antibody at a dilution of 1:10000 for 1.5 hour at RT. The signal is developed using an Enhanced Chemiluminescent detection (ECL) kit (Catalog # EK1002) with Tanon 5200 system. A specific band was detected for Thrombospondin at approximately 165KD, 180KD. The expected band size for Thrombospondin is at 130KD.

Click image to see more details
Sub-FS may increase TSP-1/TGF-β1, excitatory synapse and glutamate levels. A – C Gray bands and normalized gray values of TSP-1 and TGF-β1 relative to GAPDH at 3 days (n = 4/group). D – H Gray bands and normalized gray values of PSD-95, Synapsin I and VGLUT1 relative to GAPDH at 3 days ( n = 4/group). I , J Number of positive PSD-95 signals and representative immunohistochemical results of PSD-95 (green) in EC at 3 days (scale bar = 5 μm, n = 4/group). Blue, DAPI. K – N Immunohistochemical results of VGLUT1 (green) and CAMKII (red) in EC at 3 days (scale bar = 10 μm, n = 4/group). Blue, DAPI. O Content of glutamate ( n = 6/group) in EC and CA3 and ( P ) ratio of normalized power spectra intensity of beta waves ( n = 5/group) at 3 days. Mean ± SEMs were presented. * P < 0.05, ** P < 0.01, *** P < 0.001 vs control group (One-way ANOVA).
Index in PubMed under a CC BY license. PMID: 38346981

Click image to see more details
Reduced TSP-1 expression decreases susceptibility and neuronal injury induced by sub-FS stimuli and alleviates neuronal damage induced by subsequent FS stimuli. A Experimental design. B Threshold dosages of PTZ at P14 ( n = 6/group). C Threshold body temperature for induction of febrile seizures at P9 ( n = 8/group). D , E Analysis and representative images of FJB staining at 3 days after 41°C stimulus (scale bar = 50 μm). F – H Gray bands and normalized gray values of cleaved caspase-3 and caspase-3 relative to GAPDH at 3 days after 41°C stimulus. I , J Representative images (scale bar = 50 μm) and number of positive signals of FJB staining at 3 days after FS stimuli. K – M Gray bands and quantitative analysis of cleaved caspase-3 and caspase-3 at 3 days after FS stimuli. D – M n = 4/group. Mean ± SEMs were presented. * P < 0.05, ** P < 0.01, ***P < 0.001 vs siRNA-NC group (Unpaired T-test).
Index in PubMed under a CC BY license. PMID: 38346981

Click image to see more details
Reduced TSP-1 expression decreases excitatory synapse and glutamate levels. Gray bands and normalized gray values of TSP-1/TGF-β1 ( A – C ), PSD-95/synapsin I ( D – F ) and VGLUT1 ( G , H ) at 24 hours and 3 days ( n = 4/group). The immunohistochemistry results of PSD-95 (green, scale bar = 3 μm, I , J ), VGLUT1 (green, scale bar = 10 μm, K , L ) and CAMKII (red, scale bar = 10 μm, M , N ) in EC. I – N n = 4/group, Blue, DAPI. O Ratio of normalized power spectra intensity of beta waves ( n = 5/group) and ( P ) glutamate content ( n = 6/group). Mean ± SEMs were presented. * P < 0.05, ** P < 0.01, *** P < 0.001 vs siRNA-NC group (Unpaired T-test).
Index in PubMed under a CC BY license. PMID: 38346981

Click image to see more details
LSKL administration decreases excitatory synapse and glutamate levels. Gray bands and normalized gray values of TSP-1/TGF-β1 ( A – C ), PSD-95/synapsin I ( D – F ) and VGLUT1 ( G , H ) at 24 hours and 3 days ( n = 4/group). I , J Number of positive PSD-95 signals and representative immunohistochemical results of PSD-95 (green) in EC at 3 days (scale bar = 3 μm, n = 4/group). K , L Immunohistochemistry results of VGLUT1 (green) in EC at 3 days (scale bar = 10 μm, n = 4/group). M , N Representative immunohistochemical results of CAMKII (red) in EC at 3 days (scale bar = 10 μm, n = 4/group). Blue, DAPI. O Ratio of normalized power spectra intensity of beta waves ( n = 5/group) and ( P ) content of glutamate ( n = 6/group) at 3 days. Mean ± SEMs were presented. * P < 0.05, ** P < 0.01, *** P < 0.001 vs saline groups (Unpaired T-test).
Index in PubMed under a CC BY license. PMID: 38346981
Specific Publications For Anti-Thrombospondin/THBS1 Antibody Picoband® (A00667-1)
Loading publications
Recommended Resources
Here are featured tools and databases that you might find useful.
- Boster's Pathways Library
- Protein Databases
- Bioscience Research Protocol Resources
- Data Processing & Analysis Software
- Photo Editing Software
- Scientific Literature Resources
- Research Paper Management Tools
- Molecular Biology Software
- Primer Design Tools
- Bioinformatics Tools
- Phylogenetic Tree Analysis
Customer Reviews
Have you used Anti-Thrombospondin/THBS1 Antibody Picoband®?
Share your experimental results or join a short interview to earn up to $1,000 in product credits or other rewards.
0 Reviews For Anti-Thrombospondin/THBS1 Antibody Picoband®
Customer Q&As
Have a question?
Find answers in Q&As, reviews.
Can't find your answer?
Submit your question
