Click image to see more details
-

-
-
-
-
+2
Product Info Summary
| SKU: | MT0017 |
|---|---|
| Size: | 100 μl |
| Reactive Species: | Human, Mouse, Rat |
| Host: | Rabbit |
| Application: | WB |
Customers Who Bought This Also Bought

Product info
Product Name
Anti-VSV-G-Tag Rabbit Monoclonal Antibody
SKU/Catalog Number
MT0017
BM3890 is an alternative SKU for this antibody, used in previous lots.
Size
100 μl
Form
Liquid
Description
Boster Bio Anti-VSV-G-Tag Rabbit Monoclonal Antibody catalog # MT0017. Tested in WB application. This antibody reacts with Human, Mouse, Rat.
Storage & Handling
Store at -20°C for one year. For short term storage and frequent use, store at 4°C for up to one month. Avoid repeated freeze-thaw cycles.
Cite This Product
Anti-VSV-G-Tag Rabbit Monoclonal Antibody (Boster Biological Technology, Pleasanton CA, USA, Catalog # MT0017)
Host
Rabbit
Contents
Rabbit IgG in stabilizing components, phosphate buffered saline, pH 7.4, 150mM NaCl, 0.02% sodium azide and 50% glycerol.
*This antibody is supplied in a stabilized formulation.
Compatibility with conjugation reactions depends on the chemistry of the conjugation method used.
For conjugation methods that are not compatible with the stabilizing components present in this formulation, a carrier-free antibody format is required.
Clonality
Monoclonal
Clone Number
DB-22
Isotype
Rabbit IgG
Immunogen
A synthesized peptide
Reactive Species
MT0017 is reactive to VSV-G-Tag in Human, Mouse, Rat
Observed Molecular Weight
15 kDa
Antibody Validation
Boster validates all antibodies on WB, IHC, ICC, Immunofluorescence, and ELISA with known positive control and negative samples to ensure specificity and high affinity, including thorough antibody incubations.
Application & Images
Applications
MT0017 is guaranteed for WB Boster Guarantee
Recommend Dilution
WB 1:1000-5000
Tested application
Suggested blocking solution with 5% non-fat milk or BSA; (*)Recommended protein loading: 20-40 µg per lane
Validation Images & Assay Conditions
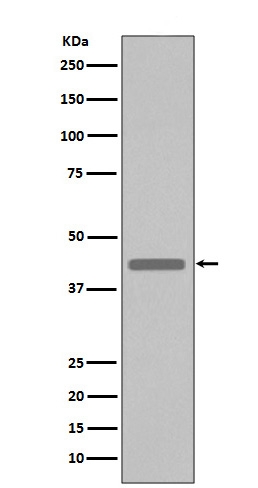
Click image to see more details
Western blot analysis of extracts from VSV-G tag fusion protein, using VSV-G tag antibody.

Click image to see more details
BT restricts the VSV infection in 2fTGH cells. (A) RT-qPCR analysis of VSV-N mRNA levels in 2fTGH cells infected with VSV (MOI = 0.1) and treated with DMSO or increasing concentrations of BT (30 and 60 μM for 12 h; 10, 30, 60, and 100 μM for 24 h). Black triangles indicate increasing BT concentrations. Data normalized to ACTB. Fold changes relative to VSV-treated control samples were calculated using the 2^-ΔΔCT method. (B) Western blotting analysis of VSV glycoprotein (G) protein expression in 2fTGH cells infected with VSV (MOI = 0.1) and treated with DMSO or BT (30 and 60 μM for 12 h; 60 and 100 μM for 24 h). (C) Plaque assay quantification of infectious viral particles from supernatants of BT-treated cells for 12 h. Culture supernatants were serially diluted and adsorbed onto fresh 2fTGH cells for 1 h, then overlaid with 0.5% carboxymethyl cellulose and incubated for an additional 48 h. (D) HeLa cells infected with VSV-GFP at an MOI of 0.1 and treated with BT (20 and 100 μM) for 24 (h) The percentage of VSV-GFP-positive cells was determined by flow cytometry analysis. (E) Representative bright-field and green fluorescence images of HeLa cells infected with VSV-GFP (MOI = 0.1, 12 h) with BT (0-60 μM). Scale bar, 100 μm. Data are presented as mean ± SEM, with n = 3. **P < 0.01; ***P < 0.001. ns, not significant.
Index in PubMed under a CC BY license. PMID: 40918260

Click image to see more details
BT inhibits a range of viral infections in vitro . (A) RT-qPCR analysis of VSV-N mRNA levels in VSV-infected (MOI = 0.1) A549, HeLa, HT29, and RAW264.7 cells treated with BT (50 μM) or DMSO (vehicle control) for 12 h. Data normalized to ACTB and expressed as fold change relative to control (VSV+DMSO, set as 1). (B) Representative plaque assay images quantifying infectious VSV particles in supernatants from (A) . (C) RT-qPCR analysis of viral RNA in HSV-1 (MOI = 0.5), IAV (MOI = 0.1), EMCV (MOI = 0.1)-infected 2fTGH cells as well as MHV-A59 (MOI = 0.1)-infected J774A.1 cells, all treated with either BT (40, 60, or 100 μM) or DMSO (vehicle control) for 12 (h) Data normalized to ACTB and expressed as fold change relative to control (virus+DMSO, set as 1). (D) HSV-1 envelope glycoprotein- and MHV-A59 spike protein-mediated cell-cell fusion and syncytium formation in the presence or absence of 60 μM BT for 12 h (Scale bar, 100 μm. The arrow points to fused cells). Data are presented as mean ± SEM, with n = 3. **P < 0.01; ***P < 0.001.
Index in PubMed under a CC BY license. PMID: 40918260

Click image to see more details
BT arrests viral replication in an FXa independent manner. (A) Schematic diagram illustrating the potential antiviral mechanism of BT. (B) 2fTGH cells infected with VSV (MOI=0.1) were treated with 50 μM direct oral anticoagulants (DOACs) for 12 h. Antiviral effects quantified by RT-qPCR. Data normalized to ACTB and expressed as fold change relative to DMSO-treated control (set as 1). RIV: Rivaroxaban, BTM: Betrixaban maleate. (C) Left: RT-qPCR analysis of FXa mRNA levels in 2fTGH cells transfected with non-targeting control siRNA or FXa siRNA (100 nM). Right: RT-qPCR analysis of VSV-N mRNA levels in 2fTGH cells transfected with non-targeting control siRNA or FXa siRNA (100 nM) followed by VSV infection (MOI = 0.1, 12 h). Data normalized to ACTB and expressed as fold change relative to Scramble-treated (set as 1). (D) 2fTGH cells were transfected with 1 μg of FXa-mCherry or an empty plasmid for 48 h, followed by infection with VSV-GFP at an MOI of 0.1 for 12 h. RT-qPCR analysis of FXa mRNA levels and viral replication. Data normalized to ACTB and expressed as fold change relative to empty plasmid-treated (Mock, set as 1). Western blotting analysis of VSV-G protein expression. (E, F) HeLa cells were transfected with 1 μg of FXa-mCherry or an empty plasmid for 48 h, followed by infection with VSV-GFP at an MOI of 0.1 for 12 h. Quantification of the percentage of VSV-GFP positive cells in HeLa cells with FXa overexpression via fluorescence microscopy (E) and ImageJ (F) . Scale bar, 100 μm. The number of VSV-GFP-positive cells in the empty-vector transfection control group (Mock) was normalized to 100% to determine the infection rate. Data are presented as mean ± SEM, with n = 3. ***P < 0.001. ns, not significant.
Index in PubMed under a CC BY license. PMID: 40918260

Click image to see more details
The antiviral protective effects of BT treatment in vivo . (A) Schematic representation of a mouse model of VSV infection treated with BT in vivo . C57BL/6 mice were infected intraperitoneally (i.p.) with VSV (1 × 10 8 PFU per mouse), followed by daily i.p. injections of BT (10 mg/kg/day) or PBS (vehicle control) for three consecutive days. (B) Survival curves of VSV-infected mice treated with BT or PBS (n = 8 per group). Survival comparisons were performed using the log-rank (Mantel-Cox) test. (C) RT-qPCR analysis of the VSV-N mRNA levels in the blood tissues of VSV-infected mice treated with BT or not (n = 3 per group). Data normalized to ACTB and expressed as fold change relative to PBS-treated control (VSV alone, set as 1). (D) IFNB1 mRNA levels in the liver, lung, and spleen tissues harvested from C57BL/6J mice 24 h after a single i.p. injection of BT (10 mg/kg) or PBS were quantified by RT-qPCR (n = 3 per group). Data normalized to ACTB and expressed as fold change relative to PBS-treated control (Mock, set as 1). Data are presented as mean ± SEM, with n = 3. *P < 0.05; **P < 0.01; ***P < 0.001.
Index in PubMed under a CC BY license. PMID: 40918260

Click image to see more details
BT elicits antiviral immune response via TBK1/IRF3 signaling axis. (A) RT-qPCR analysis of ISG15 mRNA expression in 2fTGH cells pretreated with TBK1 inhibitor for 6 h, followed by treatment with BT (100 μM, 12 h). Data normalized to ACTB and expressed as fold change relative to DMSO-treated control (set as 1). (B) Luciferase activity in 2fTGH cells treated as described in (A) . Relative luciferase activity was expressed as fold change relative to the control (DMSO, set as 1.0). (C) IRF3 protein levels in IRF3 knockout (IRF3 –/– ) 2fTGH cells and WT cells. (D, E) The Luciferase reporter activity and gene expression of ISG15 in WT and IRF3 –/– 2fTGH cells after 16 h of BT (60 μM) or SeV (MOI = 0.1) treatment. Data normalized to ACTB and expressed as fold change relative to DMSO-treated control (set as 1). Relative luciferase activity was expressed as fold change relative to the control (DMSO, set as 1.0). (F) RT-qPCR analysis of Mx mRNA levels in WT and IRF3 –/– 2fTGH cells following treatment with BT (60 μM) for 16 h. Data normalized to ACTB and expressed as fold change relative to DMSO-treated control (set as 1). (G, H) RT-qPCR (G) and flow cytometry analysis (H) evaluating virus (VSV or VSV-GFP, MOI = 0.1) infection in WT and IRF3-depleted 2fTGH cells treated with BT (60 μM) for 12 h. Data normalized to ACTB and expressed as fold change relative to VSV-treated control (set as 1). Data are presented as mean ± SEM, with n = 3. **P < 0.01; ***P < 0.001. ns, not significant.
Index in PubMed under a CC BY license. PMID: 40918260
Specific Publications For Anti-VSV-G-Tag Rabbit Monoclonal Antibody (MT0017)
Loading publications
Recommended Resources
Here are featured tools and databases that you might find useful.
- Boster's Pathways Library
- Protein Databases
- Bioscience Research Protocol Resources
- Data Processing & Analysis Software
- Photo Editing Software
- Scientific Literature Resources
- Research Paper Management Tools
- Molecular Biology Software
- Primer Design Tools
- Bioinformatics Tools
- Phylogenetic Tree Analysis
Customer Reviews
Have you used Anti-VSV-G-Tag Rabbit Monoclonal Antibody?
Share your experimental results or join a short interview to earn up to $1,000 in product credits or other rewards.
0 Reviews For Anti-VSV-G-Tag Rabbit Monoclonal Antibody
Customer Q&As
Have a question?
Find answers in Q&As, reviews.
Can't find your answer?
Submit your question
