Click image to see more details
-

-
-
-
-
+6
Product Info Summary
| SKU: | PA1538 |
|---|---|
| Size: | 100 μg/vial |
| Reactive Species: | Human, Mouse, Rat |
| Host: | Rabbit |
| Application: | Flow Cytometry, IHC, WB |
Customers Who Bought This Also Bought

Product info
Product Name
Anti-BCAT1 Antibody Picoband®
SKU/Catalog Number
PA1538
BA2190 is an alternative SKU for this antibody, used in previous lots.
Size
100 μg/vial
Form
Lyophilized
Description
Boster Bio Anti-BCAT1 Antibody catalog # PA1538. Tested in Flow Cytometry, IHC, WB applications. This antibody reacts with Human, Mouse, Rat. The brand Picoband indicates this is a premium antibody that guarantees superior quality, high affinity, and strong signals with minimal background in Western blot applications. Only our best-performing antibodies are designated as Picoband, ensuring unmatched performance.
Storage & Handling
Store at -20˚C for one year from date of receipt. After reconstitution, at 4˚C for one month. It can also be aliquotted and stored frozen at -20˚C for six months. Avoid repeated freeze-thaw cycles.
Cite This Product
Anti-BCAT1 Antibody Picoband® (Boster Biological Technology, Pleasanton CA, USA, Catalog # PA1538)
Host
Rabbit
Contents
Each vial contains 4 mg Trehalose, 0.9 mg NaCl and 0.2 mg Na2HPO4.
Clonality
Polyclonal
Isotype
Rabbit IgG
Immunogen
A synthetic peptide corresponding to a sequence at the C-terminus of human BCAT1, different from the related mouse sequence by one amino acid, rat sequence by three amino acids.
Cross-reactivity
No cross-reactivity with other proteins
Reactive Species
PA1538 is reactive to BCAT1 in Human, Mouse, Rat
Observed Molecular Weight
43 kDa
Calculated molecular weight
43.0 kDa
Background of BCAT1
BCAT1, Branched-chain Aminotransferase1, is also know as BCT1. The BCAT1 gene is highly expressed early in embryogenesis, and during organogenesis its expression is localized to the neural tube, the somites, and the mesonephric tubules. The gene is also expressed in several MYC-based tumors. The BCAT1 gene is mapped to chromosome 12. Lack of the enzyme BCT can cause auxotroph, a kind of auxotrophic mutant in Chinese-hamster ovary cells that lacks the ability to grow if alpha-ketoisovaleric acid, alpha-ketoisocaproic acid, and alpha-keto-beta-methylvaleric acid are substituted for valine, leucine, and isoleucine in the culture medium.
Antibody Validation
Boster validates all antibodies on WB, IHC, ICC, Immunofluorescence, and ELISA with known positive control and negative samples to ensure specificity and high affinity, including thorough antibody incubations.
Application & Images
Applications
PA1538 is guaranteed for Flow Cytometry, IHC, WB Boster Guarantee
Recommend Dilution
| Application | Dilution | Species |
|---|---|---|
| Western blot | 0.1-0.5μg/ml | Human, Mouse, Rat |
| Immunohistochemistry (Paraffin-embedded Section) | 2-5ug/ml | Mouse, Rat |
| Flow Cytometry(Fixed) | 1-3 μg/1x106 cells | Human |
Tested application
Suggested blocking solution with 5% non-fat milk or BSA; (*)Recommended protein loading: 20-40 µg per lane
Use TE buffer pH 9.0 for antigen retrieval; (*) citrate buffer pH 6.0 is an alternative.
Validation Images & Assay Conditions
Click image to see more details
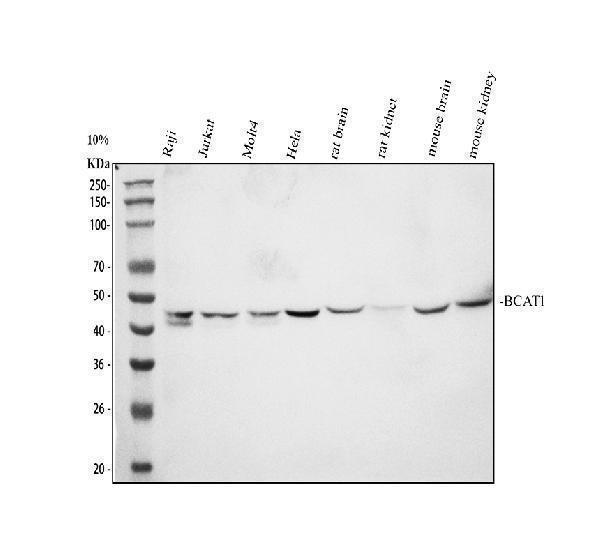
Western blot analysis of BCAT1 using anti-BCAT1 antibody (PA1538).
Electrophoresis was performed on a 10% SDS-PAGE gel at 80V (Stacking gel) / 120V (Resolving gel) for 2 hours. The sample well of each lane was loaded with 30 ug of sample under reducing conditions.
Lane 1: human Raji whole cell lysates,
Lane 2: human Jurkat whole cell lysates,
Lane 3: human MOLT-4 whole cell lysates,
Lane 4: human Hela whole cell lysates,
Lane 5: rat brain tissue lysates,
Lane 6: rat kidney tissue lysates,
Lane 7: mouse brain tissue lysates,
Lane 8: mouse kidney tissue lysates.
After electrophoresis, proteins were transferred to a nitrocellulose membrane at 150 mA for 50-90 minutes. Blocked the membrane with 5% non-fat milk/TBS for 1.5 hour at RT. The membrane was incubated with rabbit anti-BCAT1 antigen affinity purified polyclonal antibody (Catalog # PA1538) at 0.5 μg/mL overnight at 4°C, then washed with TBS-0.1%Tween 3 times with 5 minutes each and probed with a goat anti-rabbit IgG-HRP secondary antibody at a dilution of 1:5000 for 1.5 hour at RT. The signal is developed using an ECL Plus Western Blotting Substrate (Catalog # AR1196-200) with Tanon 5200 system. A specific band was detected for BCAT1 at approximately 43 kDa. The expected band size for BCAT1 is at 43 kDa.

Click image to see more details
IHC analysis of BCAT1 using anti-BCAT1 antibody (PA1538).
BCAT1 was detected in a paraffin-embedded section of mouse brain tissue. Heat mediated antigen retrieval was performed in EDTA buffer (pH 8.0, epitope retrieval solution). The tissue section was blocked with 10% goat serum. The tissue section was then incubated with 2 μg/ml rabbit anti-BCAT1 Antibody (PA1538) overnight at 4°C. Peroxidase Conjugated Goat Anti-rabbit IgG was used as secondary antibody and incubated for 30 minutes at 37°C. The tissue section was developed using HRP Conjugated Rabbit IgG Super Vision Assay Kit (Catalog # SV0002) with DAB as the chromogen.

Click image to see more details
IHC analysis of BCAT1 using anti-BCAT1 antibody (PA1538).
BCAT1 was detected in a paraffin-embedded section of rat brain tissue. Heat mediated antigen retrieval was performed in EDTA buffer (pH 8.0, epitope retrieval solution). The tissue section was blocked with 10% goat serum. The tissue section was then incubated with 2 μg/ml rabbit anti-BCAT1 Antibody (PA1538) overnight at 4°C. Peroxidase Conjugated Goat Anti-rabbit IgG was used as secondary antibody and incubated for 30 minutes at 37°C. The tissue section was developed using HRP Conjugated Rabbit IgG Super Vision Assay Kit (Catalog # SV0002) with DAB as the chromogen.

Click image to see more details
Flow Cytometry analysis of Jurkat cells using anti-BCAT1 antibody (PA1538).
Overlay histogram showing Jurkat cells stained with PA1538 (Blue line). To facilitate intracellular staining, cells were fixed with 4% paraformaldehyde and permeabilized with permeabilization buffer. The cells were blocked with 10% normal goat serum. And then incubated with rabbit anti-BCAT1 Antibody (PA1538, 1 μg/1x106 cells) for 30 min at 20°C. DyLight®488 conjugated goat anti-rabbit IgG (BA1127, 5-10 μg/1x106 cells) was used as secondary antibody for 30 minutes at 20°C. Isotype control antibody (Green line) was rabbit IgG (1 μg/1x106) used under the same conditions. Unlabelled sample without incubation with primary antibody and secondary antibody (Red line) was used as a blank control.

Click image to see more details
ZNF423 maintaines the stable expression of BCAT1 by binding the AU-rich elements (AREs) of the 3′-UTR of BCAT1 mRNA in hypoxic PASMCs. a The binding sites for ZNF423 in the 3′-UTR of BCAT1 mRNA. b The correlation between ZNF423 and BCAT1 mRNA was detected by real-time PCR after RNA immunoprecipitation (RIP) ( n = 3). c Reporter constructs containing luciferase, and the 3′-UTR of BCAT1 mRNA and mutated 3ʹ-UTR of BCAT1 mRNA were used to estimate the activity of various luciferase reporter genes ( n = 3). Nor normoxia, Hyp hypoxia, Con con083 control vector, 3′-UTR 3′-UTR luciferase reporter plasmid, 3′-UTR mut 3′-UTR ARE mutant luciferase reporter plasmid. Statistical analysis was performed with two-way ANOVA. All values are presented as the mean ± SEM. ** p < 0.01; *** p < 0.001.
Index in PubMed under a CC BY license. PMID: 32938905

Click image to see more details
Hypoxia leads to the transfer of ZNF423 from the nucleus to the cytoplasm, where it bound BCAT1 to promote autophagy activity. a Bioinformatics analysis of proteins associated with BCAT1. Upside: According to the JASPAR database and LASAGNA-Search 2.0 database, there was 28 genes that may bind to bcat1, and the binding ability of ZNF423, STAT1, Pou5f1, STAT3, SP1, SOX9, and TEAD1 was strong. Underside: RT-PCR analysis of the mRNA levels of ZNF423, STAT1, Pou5f1, STAT3, SP1, SOX9, and TEAD1 with rat β-actin serving as the standard in PASMCs under NOR or HYP for 24 h ( n = 5). b Western blot analysis of the expression of ZNF423 in PASMCs under NOR or HYP for 24 h ( n = 6). c ZNF423 protein levels were assayed in pulmonary arterial tissues of hypoxic model rats ( n = 4). d Coimmunoprecipitation of whole-cell lysates of PASMCs exposed to normoxia or hypoxia for 24 h with anti-ZNF423, followed by probing with anti-BCAT1 ( n = 3). e Western blot analysis of BCAT1 expression in PASMCs transfected with ZNF423 siRNA under NOR or HYP for 24 h ( n = 4). f PASMCs were exposed to HYP for 24 h, and the colocalization between BCAT1 and ZNF423 was determined by immunofluorescence. GFP-BCAT1 (green), ZNF423 (red), and DAPI (blue). Scale bar = 50 μm ( n = 3). g The translocation of ZNF423 between the nucleus and cytoplasm in PASMCs transfected with BCAT1 siRNA or gabapentin ( n = 3). h Western blot analysis of the expression of BECN1 and Atg5 in PASMCs transfected with ZNF423 siRNA under HYP for 24 h ( n = 4). i Autophagic flux of PASMCs cotransfected with eGFP-mRFP-LC3 plasmid and control siRNA or ZNF423 siRNA under HYP for 24 h. Scale bar = 50 μm ( n = 5). Nor normoxia, Hyp hypoxia, H + G hypoxia plus gabapentin, H + NC hypoxia plus control siRNA, H + SI hypoxia plus BCAT1 siRNA, H + si-ZNF423 hypoxia plus ZNF423 siRNA, IP immunoprecipitation, IB immunoblotting. Statistical analysis was performed with one-way ANOVA or the Student’s t test. All values are presented as the mean ± SEM. * p < 0.05; ** p < 0.01; *** p < 0.001.
Index in PubMed under a CC BY license. PMID: 32938905

Click image to see more details
BCAT1 regulates autophagy during hypoxia by activating ERs via the IRE1-XBP1-RIDD axis. a Western blot analysis of BECN1 and Atg5 in PASMCs cotransfected with BCAT1 and IRE1 siRNA ( n = 5). b Autophagic flux was monitored in PASMCs cotransfected with eGFP-mRFP-LC3 plasmid and control siRNA or IRE1 siRNA that were then exposed to HYP for 24 h. Scale bar = 50 μm ( n = 3). c , d RT-PCR analysis of the mRNA levels of XBP1-s, sparc, pmp2, and Scara3 with rat β-actin serving as the standard ( n = 5). e The formation of autophagosomes was detected, and autophagic activity was estimated in cells in which the expression of XBP1 was knocked down with XBP1 siRNA under HYP for 24 h. Scale bar = 50 µm ( n = 5). Nor normoxia, Hyp hypoxia, H + G hypoxia plus gabapentin, H + NC hypoxia plus control siRNA, H + SI hypoxia plus BCAT1 siRNA, H + SI-IRE1 hypoxia plus IRE1 siRNA, H + SI-XBP1 hypoxia plus XBP1 siRNA, H + Con hypoxia plus control vector, H + B hypoxia plus BCAT1 plasmid, H + Con+NC hypoxia plus control vector plus control siRNA, H + B + Si-IRE hypoxia plus BCAT1 plasmid plus IRE1 siRNA. Statistical analysis was performed with one-way ANOVA. All values are presented as the mean ± SEM. * p < 0.05; ** p < 0.01; *** p < 0.001.
Index in PubMed under a CC BY license. PMID: 32938905

Click image to see more details
BCAT1 regulates autophagy through the endoplasmic reticulum stress pathway. a Expression of BCAT1 and ER-Tracker Red staining in PASMCs exposed to NOR or HYP for 24 h. Scale bar = 50 μm ( n = 3). b Western blot analysis of PERK, IRE1, ATF6, and GRP78 protein expression in the ERs pathway in PASMCs treated with gabapentin ( n = 8). c Western blot analysis of IRE1, PERK, ATF6, and GRP78 expression in PASMCs transfected with BCAT1 siRNA ( n = 8). d Western blot analysis of BECN1 and Atg5 in PASMCs treated with the ERs pathway inhibitor 4-PBA and BCAT1 plasmid ( n = 8). e Coimmunoprecipitation of the whole-cell lysates of PASMCs exposed to normoxia or hypoxia for 24 h with anti-IRE1, followed by probing with anti-BCAT1 ( n = 3). Nor normoxia, Hyp hypoxia, H + G hypoxia plus gabapentin, H + NC hypoxia plus control siRNA, H + SI hypoxia plus BCAT1 siRNA, N + Con normoxia plus control vector, H + Con hypoxia plus control vector, H + B hypoxia plus BCAT1 plasmid, H + Con+4 hypoxia plus control vector plus 4-phenylbutyric acid, H + B + 4 hypoxia plus BCAT1 plasmid plus 4-phenylbutyric acid, IP immunoprecipitation, IB immunoblotting. Statistical analysis was performed with one-way ANOVA. All values are presented as the mean ± SEM. ** p < 0.01; *** p < 0.001.
Index in PubMed under a CC BY license. PMID: 32938905

Click image to see more details
Upregulation of BCAT1 expression induced by hypoxia leads to PASMC autophagy. a Western blot analysis of BECN1 and Atg5 protein expression in PASMCs treated with the inhibitor gabapentin (20 µM) ( n = 8). b Western blot analysis of BECN1 and Atg5 protein expression in PASMCs transfected with BCAT1 siRNA or BCAT1 plasmid ( n = 8). c , d Immunofluorescence staining for BECN1 and Atg5 in PASMCs. BECN1 and Atg5 (green), α-SMA (red), and DAPI (blue). Scale bar = 50 μm ( n = 3). e Western blot analysis of BECN1 and Atg5 expression in the pulmonary arterial tissues of hypoxia model rats treated with gabapentin ( n = 7). f Measurement of autophagic flux in PASMCs transfected with eGFP-mRFP-LC3 plasmid and exposed under NOR or HYP for 24 h treated with BCAT1 siRNA or the BCAT1 inhibitor gabapentin. Yellow and red dots indicate autolysosomes and autophagosomes, respectively. Scale bar = 50 μm ( n = 6). Nor normoxia, Hyp hypoxia, Mct monocrotaline, H + G hypoxia plus gabapentin, M + G monocrotaline plus gabapentin, H + NC hypoxia plus control siRNA, H + SI hypoxia plus BCAT1 siRNA, H + Con hypoxia plus control vector, H + B hypoxia plus BCAT1 plasmid. Statistical analysis was performed with one-way ANOVA. All values are presented as the mean ± SEM. * p < 0.05; ** p < 0.01; *** p < 0.001.
Index in PubMed under a CC BY license. PMID: 32938905

Click image to see more details
Hypoxia resultes in the increased expression of BCAT1. a Western blot analysis of BCAT1 expression in hypoxic PASMCs ( n = 8). b Subcellular distribution of BCAT1 in PASMCs determined by immunofluorescence analysis. Scale bars: 50 μm ( n = 3). c The cellular expression of BCAT1 in the smooth muscle layer of lung tissues from hypoxic model rats determined by immunofluorescence staining analysis. Scale bar = 100 μm ( n = 3). d BCAT1 protein levels in pulmonary arterial tissues of hypoxia model rats ( n = 8). e Time course of BCAT1 expression of PASMCs at 0, 6, 12, 24, 48, and 72 h after hypoxia treatment ( n = 6). Nor normoxia, Hyp hypoxia, Mct monocrotaline. Statistical analysis was performed with one-way ANOVA or the Student’s t test. All values are presented as the mean ± SEM. * p < 0.05; ** p < 0.01; *** p < 0.001; ns not significant.
Index in PubMed under a CC BY license. PMID: 32938905
Specific Publications For Anti-BCAT1 Antibody Picoband® (PA1538)
Loading publications
Recommended Resources
Here are featured tools and databases that you might find useful.
- Boster's Pathways Library
- Protein Databases
- Bioscience Research Protocol Resources
- Data Processing & Analysis Software
- Photo Editing Software
- Scientific Literature Resources
- Research Paper Management Tools
- Molecular Biology Software
- Primer Design Tools
- Bioinformatics Tools
- Phylogenetic Tree Analysis
Customer Reviews
Have you used Anti-BCAT1 Antibody Picoband®?
Share your experimental results or join a short interview to earn up to $1,000 in product credits or other rewards.
0 Reviews For Anti-BCAT1 Antibody Picoband®
Customer Q&As
Have a question?
Find answers in Q&As, reviews.
Can't find your answer?
Submit your question
1 Customer Q&As for Anti-BCAT1 Antibody Picoband®
Question
We are currently using anti-BCAT1 antibody PA1538 for human tissue, and we are content with the WB results. The species of reactivity given in the datasheet says human. Is it true that the antibody can work on feline tissues as well?
Verified Customer
Verified customer
Asked: 2019-09-17
Answer
The anti-BCAT1 antibody (PA1538) has not been validated for cross reactivity specifically with feline tissues, though there is a good chance of cross reactivity. We have an innovator award program that if you test this antibody and show it works in feline you can get your next antibody for free. Please contact me if I can help you with anything.
Boster Scientific Support
Answered: 2019-09-17
