Click image to see more details
-

-
-
-
-
+2
Product Info Summary
| SKU: | A00344-2 |
|---|---|
| Size: | 100 μg/vial |
| Reactive Species: | Mouse |
| Host: | Rabbit |
| Application: | ELISA, IHC, WB |
Customers Who Bought This Also Bought

Product info
Product Name
Anti-CD4 Antibody Picoband®
SKU/Catalog Number
A00344-2
Size
100 μg/vial
Form
Lyophilized
Description
Boster Bio Anti-CD4 Antibody Picoband® catalog # A00344-2. Tested in ELISA, IHC, WB applications. This antibody reacts with Mouse. The brand Picoband indicates this is a premium antibody that guarantees superior quality, high affinity, and strong signals with minimal background in Western blot applications. Only our best-performing antibodies are designated as Picoband, ensuring unmatched performance.
Storage & Handling
Store at -20˚C for one year from date of receipt. After reconstitution, at 4˚C for one month. It can also be aliquotted and stored frozen at -20˚C for six months. Avoid repeated freeze-thaw cycles.
Cite This Product
Anti-CD4 Antibody Picoband® (Boster Biological Technology, Pleasanton CA, USA, Catalog # A00344-2)
Host
Rabbit
Contents
Each vial contains 4 mg Trehalose, 0.9 mg NaCl and 0.2 mg Na2HPO4.
Clonality
Polyclonal
Isotype
Rabbit IgG
Immunogen
E.coli-derived rat CD4 recombinant protein (Position: K28-I457).
Cross-reactivity
No cross-reactivity with other proteins.
Reactive Species
A00344-2 is reactive to Cd4 in Mouse
Observed Molecular Weight
51 kDa
Calculated molecular weight
51.4 kDa
Background of Cd4
This gene encodes a membrane glycoprotein of T lymphocytes that interacts with major histocompatibility complex class II antigenes and is also a receptor for the human immunodeficiency virus. This gene is expressed not only in T lymphocytes, but also in B cells, macrophages, and granulocytes. It is also expressed in specific regions of the brain. The protein functions to initiate or augment the early phase of T-cell activation, and may function as an important mediator of indirect neuronal damage in infectious and immune-mediated diseases of the central nervous system. Multiple alternatively spliced transcript variants encoding different isoforms have been identified in this gene.
Antibody Validation
Boster validates all antibodies on WB, IHC, ICC, Immunofluorescence, and ELISA with known positive control and negative samples to ensure specificity and high affinity, including thorough antibody incubations.
Application & Images
Applications
A00344-2 is guaranteed for ELISA, IHC, WB Boster Guarantee
Recommend Dilution
| Application | Dilution | Species |
|---|---|---|
| Western blot | 0.25-0.5μg/ml | Mouse |
| Immunohistochemistry (Paraffin-embedded Section) | 2-5μg/ml | Mouse |
| ELISA | 0.1-0.5μg/ml | - |
Tested application
Suggested blocking solution with 5% non-fat milk or BSA; (*)Recommended protein loading: 20-40 µg per lane
Use TE buffer pH 9.0 for antigen retrieval; (*) citrate buffer pH 6.0 is an alternative.
Validation Images & Assay Conditions
Click image to see more details
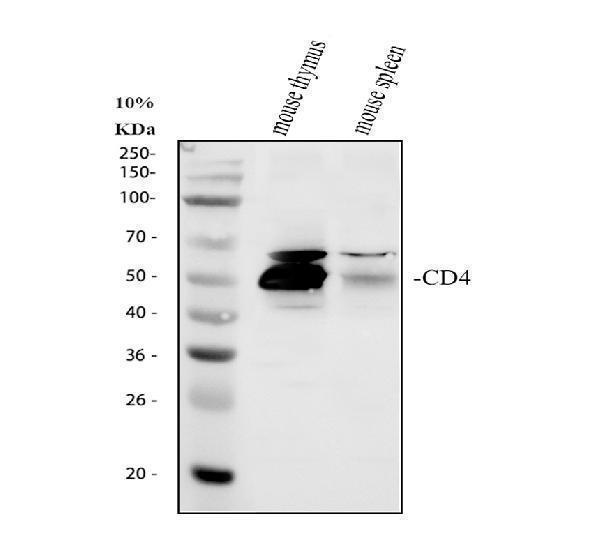
Western blot analysis of CD4 using anti-CD4 antibody (A00344-2).
Electrophoresis was performed on a 10% SDS-PAGE gel at 80V (Stacking gel) / 120V (Resolving gel) for 2 hours. The sample well of each lane was loaded with 30 ug of sample under reducing conditions.
Lane 1: mouse thymus tissue lysates,
Lane 2: mouse spleen tissue lysates.
After electrophoresis, proteins were transferred to a nitrocellulose membrane at 150 mA for 50-90 minutes. Blocked the membrane with 5% non-fat milk/TBS for 1.5 hour at RT. The membrane was incubated with rabbit anti-CD4 antigen affinity purified polyclonal antibody (A00344-2) at 0.5 μg/mL overnight at 4°C, then washed with TBS-0.1%Tween 3 times with 5 minutes each and probed with a goat anti-rabbit IgG-HRP secondary antibody (Catalog # BA1054) at a dilution of 1:5000 for 1.5 hour at RT. The signal is developed using an ECL Plus Western Blotting Substrate (Catalog # AR1196-200) with Tanon 5200 system. A specific band was detected for CD4 at approximately 51 kDa. The expected band size for CD4 is at 51 kDa.

Click image to see more details
IHC analysis of CD4 using anti-CD4 antibody (A00344-2).
CD4 was detected in a paraffin-embedded section of mouse spleen tissue. Heat mediated antigen retrieval was performed in EDTA buffer (pH 8.0, epitope retrieval solution). The tissue section was blocked with 10% goat serum. The tissue section was then incubated with 2 μg/ml rabbit anti-CD4 Antibody (A00344-2) overnight at 4°C. Peroxidase Conjugated Goat Anti-rabbit IgG was used as secondary antibody and incubated for 30 minutes at 37°C. The tissue section was developed using HRP Conjugated Rabbit IgG Super Vision Assay Kit (Catalog # SV0002) with DAB as the chromogen.

Click image to see more details
The effects of berberine on CD4 + and CD8 + T cell apoptosis, activation, and proliferation in vitro . (A) T cell activation assay. The percentages of (i) CD4 + CD44 + and (ii) CD8 + CD44 + T cells were determined by flow cytometry. (B) T cell proliferation assay. T cells from naïve C57BL/6 mice were labeled with CFSE and then co-stimulated with anti-CD3/CD28 Abs in the absence or presence of berberine. After 3 days of co-culture, (i) CD4 + and (ii) CD8 + T cell division was determined by flow cytometry. (C) (i) Supernatant levels of IFN-γ measured by ELISA, and (ii) mRNA expression of IFN-γ in T cells measured by qPCR. * p < 0.05, ** p < 0.01, *** p < 0.001 compared to the (Positive Control) PC group.
Index in PubMed under a CC BY license. PMID: 33732240

Click image to see more details
Berberine induces T cell apoptosis via the mitochondrial apoptosis pathway. (A) (i) KEGG functional categories of differentially expressed genes following berberine and saline treatment. The Y-axis represents the KEGG functional categories. (ii) KEGG analysis of the significantly altered signaling pathways in cell growth- and death-associated genes. The X-axis represents the rich ratio of the number of differentially expressed genes and the Y-axis represents the KEGG pathways. (iii) qPCR analysis of Bcl-2 and TNF-α mRNA expression in SPCs collected from heart transplant recipients treated with berberine or not. (B) T cell apoptosis assays in vivo . (i) SPCs and (ii) LNCs were collected at POD 7. The percentages of apoptotic CD4 + and CD8 + T cells were determined by flow cytometry (n = 3 mice/group). (C) T cell apoptosis assay in vitro . T cells from naïve C57BL/6 mice were co-stimulated with anti-CD3/CD28 Abs in the absence or presence of berberine. The percentages of apoptotic (i) CD4 + and (ii) CD8 + T cells were determined by flow cytometry. (D) Berberine activates the mitochondrial apoptosis pathway in vivo . (i) Relative protein expression of Bcl-2, Bax, cytochrome c, cleaved-caspase-3, and cleaved-PARP in SPC. (ii) β-actin was used as a loading control (n = 3 mice/group), and OD values (relative to β-actin) are presented as means ± SEMs. * p < 0.05, ** p < 0.01, *** p < 0.001 compared to the normal saline-treated group. (E) Berberine activates the mitochondrial apoptosis pathway in vitro . Relative protein expression of Bcl-2, Bax, cytochrome c, cleaved-caspase-3, and cleaved-PARP expression in CD3 + T cells. (ii) β-actin was used as a loading control; OD values (relative to β-actin) are presented as means ± SEMs. SPCs, spleen cells; LNCs, lymph node cells; POD, post-operative day. * p < 0.05, ** p < 0.01, *** p < 0.001 compared to the PC group.
Index in PubMed under a CC BY license. PMID: 33732240

Click image to see more details
Phenotypic and functional characteristics of allograft-infiltrating CD4 + or CD8 + T cells. Allografts were recovered at POD 7, and POD 100 syngeneic grafts are shown for comparison. (A) (i) Immunofluorescent staining of CD4 (red), KI67 (green), and 4′,6-diamidino-2-phenylindole (DAPI, blue) in grafts. (ii) Immunofluorescent staining of CD8 (red), KI67 (green), and DAPI in grafts (Scale bar = 200 μm; original magnification: ×200). (B) Proportion and absolute number of graft-infiltrating (i) CD4 + T cells and their expression of (ii) KI67, and proportion and absolute number of graft-infiltrating (iii) CD8 + T cells and their expression of (iv) KI67 (n = 3 mice/group). (C) Proportion of (i) IFN-γ and (ii) cleaved-caspase-3 in graft-infiltrating CD3 + T cells (n = 3 mice/group). (D) (i) Cleaved-caspase-3 and cleaved-PARP protein expression in grafts. Myocardial cell apoptosis co-immunofluorescence staining and expression of (ii) cleaved-caspase-3 and (iii) cleaved-PARP (n = 3 mice/group). (E) Relative mRNA expression of IFN-γ , IL-6, IL-10 , Foxp3 , and FasL in grafts measured by qPCR (n = 3 mice/group). SPCs, spleen cells; LNCs, lymph node cells; POD, post-operative day. * p < 0.05, ** p < 0.01, *** p < 0.001 compared to the normal saline-treated group.
Index in PubMed under a CC BY license. PMID: 33732240

Click image to see more details
Effect of berberine treatment on the T cell immune responses to cardiac allografts. (A) MLR responses. Recipient SPCs were isolated at POD 7 (responders) and mitomycin C-treated naïve BALB/c SPCs (stimulators) were co-cultured for 3 days (n = 3 mice/group). Total SPCs were isolated at PDO 7, and the absolute numbers of (B) SPCs were determined by flow cytometry. (C) The percentage of CD4 + Foxp3 + Treg cells was determined by flow cytometry. Syngeneic recipients are shown for comparison (n = 3 mice/group). (D) The spleens of recipient mice were harvested and weighed at POD 7 (n = 5 mice/group). (E) The absolute numbers of CD4 + and CD8 + T cells SPCs (n = 3 mice/group). (F) SPCs and (G) LNCs were isolated at POD 7, and the percentage of CD4 + and CD8 + T cells was determined by flow cytometry. Syngeneic recipients are shown for comparison (n = 3 mice/group). (H) CD44 + CD69 + T cell activation assays. SPCs were isolated at POD 7, and the percentages of (i) CD4 + CD44 + CD69 + and (ii) CD8 + CD44 + CD69 + T cells were determined by flow cytometry (n = 3 mice/group). (I) LNCs were isolated at POD 7, and the percentages of (i) CD4 + CD44 + CD69 + and (ii) CD8 + CD44 + CD69 + T cells were determined by flow cytometry (n = 3 mice/group). (J) Serum plasma levels of proinflammatory cytokines. Peripheral blood was collected at POD 7, and (i) IFN-γ, (ii) IL-6, and (iii) TNF-α plasma levels were measured by ELISA (n = 3 mice/group). SPCs, spleen cells; LNCs, lymph node cells; MLR, mixed lymphocyte reaction; POD, post-operative day. * p < 0.05, ** p < 0.01, *** p < 0.001 compared to the normal saline-treated group.
Index in PubMed under a CC BY license. PMID: 33732240
Specific Publications For Anti-CD4 Antibody Picoband® (A00344-2)
Loading publications
Recommended Resources
Here are featured tools and databases that you might find useful.
- Boster's Pathways Library
- Protein Databases
- Bioscience Research Protocol Resources
- Data Processing & Analysis Software
- Photo Editing Software
- Scientific Literature Resources
- Research Paper Management Tools
- Molecular Biology Software
- Primer Design Tools
- Bioinformatics Tools
- Phylogenetic Tree Analysis
Customer Reviews
Have you used Anti-CD4 Antibody Picoband®?
Share your experimental results or join a short interview to earn up to $1,000 in product credits or other rewards.
0 Reviews For Anti-CD4 Antibody Picoband®
Customer Q&As
Have a question?
Find answers in Q&As, reviews.
Can't find your answer?
Submit your question
1 Customer Q&As for Anti-CD4 Antibody Picoband®
Question
Was human PBMC used for A00344-2? If yes, should human be added as a reactive species?
Verified customer
Asked: 2021-01-22
Answer
For the Anti-CD4 Antibody Picoband™ (A00344-2), mouse PBMC cell was used.
Boster Scientific Support
Answered: 2021-01-25
