Click image to see more details
-

-
-
-
-
+14
Product Info Summary
| SKU: | M00422 |
|---|---|
| Size: | 100 μl |
| Reactive Species: | Human, Mouse, Rat |
| Host: | Rabbit |
| Application: | IHC, WB |
Customers Who Bought This Also Bought

Product info
Product Name
Anti-FAP1 Rabbit Monoclonal Antibody
SKU/Catalog Number
M00422
BM5121 is an alternative SKU for this antibody, used in previous lots.
Size
100 μl
Form
Liquid
Description
Boster Bio Anti-FAP1 Rabbit Monoclonal Antibody catalog # M00422. Tested in WB, IHC applications. This antibody reacts with Human, Mouse, Rat.
Storage & Handling
Store at -20°C for one year. For short term storage and frequent use, store at 4°C for up to one month. Avoid repeated freeze-thaw cycles.
Cite This Product
Anti-FAP1 Rabbit Monoclonal Antibody (Boster Biological Technology, Pleasanton CA, USA, Catalog # M00422)
Host
Rabbit
Contents
Rabbit IgG in stabilizing components, phosphate buffered saline, pH 7.4, 150mM NaCl, 0.02% sodium azide and 50% glycerol.
*This antibody is supplied in a stabilized formulation.
Compatibility with conjugation reactions depends on the chemistry of the conjugation method used.
For conjugation methods that are not compatible with the stabilizing components present in this formulation, a carrier-free antibody format is required.
Clonality
Monoclonal
Clone Number
AbF22
Isotype
Rabbit IgG
Immunogen
A synthesized peptide derived from human FAP1
Reactive Species
M00422 is reactive to FAP in Human, Mouse, Rat
Observed Molecular Weight
95 kDa
Calculated molecular weight
87.7 kDa
Antibody Validation
Boster validates all antibodies on WB, IHC, ICC, Immunofluorescence, and ELISA with known positive control and negative samples to ensure specificity and high affinity, including thorough antibody incubations.
Application & Images
Applications
M00422 is guaranteed for IHC, WB Boster Guarantee
Recommend Dilution
WB 1:500-2000
IHC 1:50-200
Validation Images & Assay Conditions
Click image to see more details
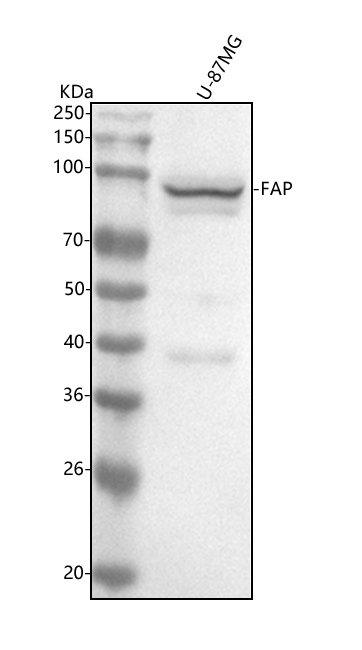
Western blot analysis of FAP1 using anti-FAP1 antibody (M00422).
Electrophoresis was performed on a 5-20% SDS-PAGE gel at 70V (Stacking gel) / 90V (Resolving gel) for 2-3 hours. The sample well of each lane was loaded with 30 ug of sample under reducing conditions.
Lane 1: human U-87MG whole cell lysates.
After electrophoresis, proteins were transferred to a nitrocellulose membrane at 150 mA for 50-90 minutes. Blocked the membrane with 5% non-fat milk/TBS for 1.5 hour at RT. The membrane was incubated with rabbit anti-FAP1 antigen affinity purified monoclonal antibody (Catalog # M00422) at 1:500 overnight at 4°C, then washed with TBS-0.1%Tween 3 times with 5 minutes each and probed with a goat anti-rabbit IgG-HRP secondary antibody at a dilution of 1:500 for 1.5 hour at RT. The signal is developed using an Enhanced Chemiluminescent detection (ECL) kit (Catalog # EK1002) with Tanon 5200 system. A specific band was detected for FAP1 at approximately 95 kDa. The expected band size for FAP1 is at 86 kDa.

Click image to see more details
All lanes use the Antibody at 1:1K dilution for 1 hour at room temperature.

Click image to see more details
All lanes use the Antibody at 1:1K dilution for 1 hour at room temperature.

Click image to see more details
IHC analysis of FAP1 using anti-FAP1 antibody (M01394-4). FAP1 was detected in a paraffin-embedded section of human liver cancer tissue. Heat mediated antigen retrieval was performed in EDTA buffer (pH 8.0, epitope retrieval solution). The tissue section was blocked with 10% goat serum. The tissue section was then incubated with 1:200 rabbit anti-FAP1 Antibody (M01394-4) overnight at 4°C. Two-step IHC kit was used as secondary antibody and incubated for 30 minutes at 37°C. The tissue section was developed using HRP Conjugated Rabbit IgG Super Vision Assay Kit (Catalog # SV0002) with DAB as the chromogen.

Click image to see more details
Detailed characterization of monocytes/macrophages in HPSCC. a UMAP plot of monocyte/macrophage cells colored by cell type. b Frequency (left) and proportion (right) of four major mononuclear/macrophage cell types in tumor and normal tissue samples. c Heatmap showing signature DEGs between mononuclear/macrophage cell types. d Bubble heatmap showing marker genes across mononuclear/macrophage cell types. Dot size indicates fraction of expressing cells, colored according to expression normalized to z-score. e Dot plot of representative M1, M2, angiogenic, and phagocytic signatures in monocyte/macrophage clusters [Z-score normalized log 2 (count + 1)]. f Differential pathways enriched in C1QC + and SPP1 + TAMs according to GSVA. Two-sided unpaired limma-moderated t -test. g Absolute infiltration proportion of SPP1 + TAMs compared between normal ( n = 43) and tumor ( n = 43) tissues in the TCGA-HNSC cohort. h Kaplan–Meier curve of OS in the TCGA-HNSC cohort stratified by optimal cut-off point for SPP1 expression and SPP1 + TAM infiltration. i Pseudotime trajectory analysis of mononuclear/macrophage cells. Each dot represents one cell, colored according to its cluster label. Inlet plot showed each cell with a pseudotime score from dark blue (early state) to light blue (terminal). Jitter plot showing expression changes in macrophage differentiation-associated genes over pseudotime. j Correlation of mCAF signature with SPP1 + TAMs based on TCGA-HNSC data. Each dot represents a patient (Pearson’s correlations). k Kaplan–Meier OS analyses of four subgroups in the TCGA-HNSC cohort, stratified by infiltration of both mCAFs and SPP1 + TAMs. l Dot plot of predicted ligand – receptor interactions between mCAFs and SPP1 + TAMs in tumor samples. m Representative images showing mIHC staining of panCK, FAP, and SPP1 in HPSCC tumor samples, in individual and merged channels. Scale bar = 20 μm. Significance in ( h ) and ( k ) was determined with two-sided log-rank tests
Index in PubMed under a CC BY license. PMID: 37853464

Click image to see more details
Representative multiplexed IHC staining of SMARCA2 deficiency while preserving SMARCA4 expression samples (n=2) and SMARCA2 High & SMARCA2 High sample (n=1) stained for panel A: Pan-CK, α-SMA, CD31, and CD206; panel B: Pan-CK, FAP, SPP1, CD8, and CD4.
Index in PubMed under a CC BY license. PMID: 40453096

Click image to see more details
Fibroblast subsets in HPSCC tumor and adjacent normal tissues. a UMAP plot of fibroblast cells colored by cell and sample type. b Heatmap showing signature DEGs among four fibroblast subsets. c Violin plots showing marker gene expression in fibroblast subsets. d Bubble heatmap showing marker gene expression in Elastic Fbs. Dot size indicates fraction of expressing cells, colored according to expression normalized based on z-scores. e Representative images showing mIHC staining of panCK, FAP, ⍶-SMA, and PLA2G2A in HPSCC samples, in individual and merged channels. Scale bar represents 50 μm. f Absolute infiltration proportion of mCAFs comparing normal ( n = 43) and tumor tissues ( n = 43) in the TCGA-HNSC cohort. g Kaplan–Meier curve of the OS in the TCGA-HNSC cohort stratified by the optimal cut-off for FAP expression and mCAF infiltration. h Representative images of the IHC staining of HPSCC tumor samples with a high and low FAP expression. i Comparing OS (Kaplan–Meier curves) among patients with HPSCC who either lowly or highly express FAP. j FaDu or SNU1076 cells were incubated for 48 h with normal and CM of NFs and CAFs; E-cadherin, N-cadherin, vimentin, Twist, and GADPH expression was evaluated using immunoblotting. Cropped blots are used here and the full-length gel images are available in Additional file (Fig. S7). k FaDu or SNU1076 cell invasion in CM relative to complete growth medium measured after 48 h. Photographs are representative of randomly chosen fields. l Representative images showing wound healing of FaDu or SNU1076 cells in CM of NFs and CAFs relative to complete growth medium, at 0, 12, 24, 48, and 72 h after wound infliction. Significance in ( g ) and ( i ) was assessed with two-sided log-rank tests. In ( j – l ), data are shown as mean ± SEM, with n = 3 paracancerous tissues and n = 4 tumor tissue columns. Differences were determined using unpaired t -tests (* P < 0.05; ** P < 0.01; *** P < 0.001)
Index in PubMed under a CC BY license. PMID: 37853464

Click image to see more details
Gene expression levels in fibroblasts. The mRNA expression levels of E-cadherin , α-SMA , FAP , and Cav-1 in the fibroblasts were detected by quantitative real-time PCR. Compared with HKF control, * P < 0.05; compared with HKF + EXO co-culture, # P < 0.05; and compared with HKF + siRNA negative control-EXO co-culture, & P < 0.05.
Index in PubMed under a CC BY license. PMID: 38045487

Click image to see more details
Pan-cancer analysis of FAP + CAF and DAB2 + TAM. (A and B) Stacking plot showing the proportion of FAP + CAF and DAB2 + TAM in different sample types. (C) Gene expression analysis of FAP and DAB2 shows their expression of tumor and normal samples in different cancers, the association between gene expression and patient survival, and the correlation between FAP and DAB2 expression. (D) Circular plots showing the proportion of cancer types with different FAP and DAB2 gene expression patterns, UP indicates the proportion of cancer types in which the gene is significantly up-regulated in cancer, DOWN indicates the proportion of cancer types in which the gene is significantly down-regulated in cancer, and NS indicates the proportion of cancer types in which there is no significant difference in the expression of the gene in cancer and paracancer. (E) Spatial feature plot showing the expression of selected genes in HCC immunotherapy ST slides. (F) Spatial feature plot showing the expression of selected genes in skin cutaneous melanoma (SKCM) and breast invasive carcinoma (BRCA) ST slides. (G) Stacking plot shows the proportion of TCGA-LIHC samples in TIDE-predicted immunotherapy-responsive (R) and non-responsive (NR) samples based on the FAP and DAB2 expression groupings; quad plot shows the significance assessment of the consistency of the four grouping clusters based on the submap method. (H) Box plot comparing the difference between FAP + CAF and DAB2 + TAM scores in the response and non-response groups in the immunotherapy cohort Imvigor210. (I) Stacking plot showing the proportion of FAP + CAF and DAB2 + TAM in the response and non-response groups in our integrated pan-cancer immunotherapy scRNA-seq cohort.
Index in PubMed under a CC BY license. PMID: 39239526

Click image to see more details
Immunohistochemical evaluation of FAP and DAB2. (A) Immunohistochemical staining image shows FAP + CAF and DAB2 + TAM around the tumor core. (B) KM curves show the high FAP or DAB2 average optical density (AOD) group with shorter OS. (C) KM curves show the high FAP and DAB2 AOD group had shortest overall survival. (D) Heatmap showing the distribution of clinical indicators in the sample sorted by FAP AOD.
Index in PubMed under a CC BY license. PMID: 39239526

Click image to see more details
Spatial co-localization of TAM with FAP + CAF. (A) UMAP shows the distribution of monocyte/macrophage subtypes. (B) Bar plot shows the relative proportions of macrophage subtypes in HCC and ICC samples (left); paired dot plot shows the relative proportions of DAB2 + / SPP1 + TAMs in tumor and adjacent liver paired samples (right). *, P < 0.05; **, P < 0.01; ***, P < 0.001; ****, P < 0.0001. (C) Distribution of DAB2 + TAMs and FAP + CAF in HCC boundary slides, and SPP1 + TAM and FAP + CAF in ICC boundary slides based on CellTrek deconvolution (left); heatmap shows the Kullback-Leibler (KL) divergence of FAP + CAF with different macrophage subtypes in ST slides, with the higher KL divergence representing the greater degree of co-localization of the two cell types (right). (D) Pie plots showing the relative proportions of different macrophage subtypes in the ST slides. (E) Unbiased clustering of ST spots and definition of cell types of each cluster (left); dot plot showing the expression of select marker genes of each cluster (right). (F) Multi-plex immunofluorescence images showing the aggregation of FAP + CAF with DAB2 + TAM at the tumor border in HCC and FAP + CAF with SPP1 + TAM at the tumor border and core in ICC. The scale bar is 200 μm and 100 μm.
Index in PubMed under a CC BY license. PMID: 39239526

Click image to see more details
Cellular communication between TAM and FAP + CAF. (A) The combined heatmap shows the results after NicheNet analysis of TAM and FAP + CAF. The first part of the combined figure shows the Pearson coefficient of the macrophage ligand, and the high coefficient suggests that the ligand has a high ability to regulate the FAP + CAF target genes, the second part shows the expression of the ligand in different subtypes of macrophage, and the third part shows the comparison of the expression of the ligand in HCC and ICC, and the fourth part shows the regulated potential of the target genes. (B) Bar plot shows GO biology terms enriched for all targeted genes, PDGFB target genes, and ADM target genes. (C) Dot plot showing the expression of PDGFB receptors LRP1 , PDGFRB and PDGFRA in fibroblasts. (D) Spatial dot plot showing the spatial expression of PDGFB in DAB2 + TAM and PDGFRB in FAP + CAF. (E) KM curves showing the association of quantified ligand-receptor score (LRscore) with patient OS in five independent bulk RNA-seq cohorts.
Index in PubMed under a CC BY license. PMID: 39239526

Click image to see more details
Spatial distribution of FAP + CAF. (A) Bar plot shows the proportion of fibroblast subtypes that were deconvoluted by CellTrek onto hepatocellular carcinoma (HCC) spatial transcriptome sections. (B) Spatial feature plot showing the expression of FAP in tumor and paracancerous samples from four HCC patients. (C and D) Distribution of fibroblast subtypes in HCC and intrahepatic cholangiocarcinoma (ICC) border slides based on CellTrek deconvolution. The pie charts show the relative proportion of each cell subtype in the border region. (E and F) Spatial feature plot showing the expression of selected genes in HCC and ICC border samples.
Index in PubMed under a CC BY license. PMID: 39239526

Click image to see more details
Association of FAP + CAF with clinical features and differentiation origins. (A) Forest plot showing the proportion of FAP + CAF in the single-cell discovery cohort was significantly associated with patient survival by Cox analysis. (B) KM curve shows that the high ratio of FAP + CAF group based on the best cutoff grouping had shorter overall survival; barplot shows that the FAP + CAF proportion was significantly higher in different liver cancer samples compared to adjacent liver (AL); boxplot shows the differences in FAP + CAF proportion among different clinical characteristic groups. *, P < 0.05; **, P < 0.01; ***, P < 0.001; ****, P < 0.0001. (C) UMAP shows prognostic-associated cells and their tissue-type origins identified by the Scissor algorithm. (D) KM curves show poorer survival of patients with a high proportion of Scissor + cells in the single-cell discovery cohort. (E) Bar plot showing the proportion of Scissor + cells in different tissue types. (F) Pie plot showing the percentage of different fibroblast subtypes in Scissor-related cells. (G) KM curves showing the high FAP + CAF score group usually predicted worse overall survival in the five liver cancer bulk transcriptome cohorts. (H) Fibroblast differentiation trajectories showing the distribution of cell type, sample type, Scissor type and state.
Index in PubMed under a CC BY license. PMID: 39239526

Click image to see more details
Identification of key cancer-associated fibroblasts. (A) UMAP shows the cellular clustering of major cell types in the discovery cohort and the corresponding cell numbers. (B) Heatmap showing the cell preference of different major cell types in peripheral blood (PB), adjacent liver (AL), intrahepatic cholangiocarcinoma (ICC), hepatocellular carcinoma (HCC), combined hepatocellular and cholangiocarcinoma (CHC), and secondary liver cancer (SLC). (C) Volcano plot showing the difference in the proportion of major cell types in HCC (n = 82) versus AL (n = 14). (D) UMAP shows the distribution of fibroblast subtypes in the discovery cohort. (E) Stacking plot shows the percentage of fibroblast subtypes in the five tissue types. (F) Dot plot shows top5 highly expressed genes for each fibroblast subtypes. (G) Volcano plot comparing the relative abundance of HCC/ICC versus AL fibroblast subtypes. (H) Heatmap showing the Ucell enrichment scores of key biological entries of fibroblasts in different subtypes. (I) UMAP shows the identification of fibroblasts from an integrated validated single-cell cohort (left); box plot shows the significantly higher relative abundance of fibroblast in AL, HCC and ICC (median); stacking plot shows the progressively higher proportion of FAP + CAF in HCC and ICC compared to AL (right). (J) Immunohistochemically stained pathology sections and box plot showed progressively higher FAP expression and average optical density (AOD) in AL (n = 8), HCC (n = 8) and ICC (n = 10) samples.
Index in PubMed under a CC BY license. PMID: 39239526

Click image to see more details
Fibrovascular niches within the stromal compartment of AM. a UMAP plot illustrating the landscape of all stromal cells color-coded by their associated subclusters. b Feature plots displaying classical marker genes used for the annotation of these subclusters. c UMAP plot showing the separation of stromal cells based on LN + AM and LN - AM, accompanied by a bar plot indicating the proportion of these subclusters in LN + AM and LN - AM. Source data are provided in the Source Data file. d Heatmap presenting the cluster-specific genes of these subclusters. Source data are provided in the Source Data file. e GSVA analysis of selected hallmark pathways in these subclusters. f RNA velocity analysis demonstrating the evolutionary trajectory of these subclusters. g Spatial feature plot showing the scores of endothelial cells and fibroblasts in tissue sections using ST-seq data. Scale bar, 1000 μm. h Scatter plot showing the correlation between endothelial ( x -axis) and fibroblast ( y -axis) cells, stratified by LN + AM and LN − AM. The correlation is evaluated using the two-sided Spearman correlation coefficient. The gray band represents the 95% confidence interval of the regression line. Source data are provided in the Source Data file. i Representative image of fibrovascular niches detected by anti-FAP and anti-CD31 in AM sections using the multiplex IHC assay, and violin plot showing the number of fibrovascular niches in LN − AM ( n = 73) and LN + AM ( n = 28). The box center lines, bounds of the box, and whiskers indicate medians, first and third quartiles, and minimum and maximum values within 1.5× IQR of the box limits, respectively. Significance was determined using a two-sided Mann–Whitney U -test (* P -value < 0.05; P = 0.03). Scale bar, 150 μm. The experiment was repeated once with similar results. Source data are provided in the Source Data file.
Index in PubMed under a CC BY license. PMID: 38065972

Click image to see more details
Protein expression levels in fibroblasts. The protein expression levels of E-cadherin, α-SMA, FAP, and Cav-1 in the fibroblasts were detected by Western blot analysis. Representative and quantitative Western blot results were shown. Compared with HKF control, * P < 0.05; compared with HKF + EXO co-culture, # P < 0.05; and compared with HKF + siRNA negative control-EXO co-culture, & P < 0.05.
Index in PubMed under a CC BY license. PMID: 38045487

Click image to see more details
(A) Kaplan-Meier survival curves generated for four subgroups of LUAD patients stratified by the expression of SMARCA2 and SMARCA4 (median cutoff), and P-values were calculated by log-rank test. (B) The volcano plot of differential gene expressions in SMARCA2 Low versus SMARCA2 High . The two vertical dashed lines represent absolute foldchange>1.5 in gene expression, and the horizontal dashed line denotes adjusted P-value cutoff 0.05. (C) GO-biological process (BP) and (D) GSEA enrichment analyses of DEGs in SMARCA2 Low and SMARCA2 High . (E) Heatmap showing the infiltration of cell subpopulations for four subgroups of LUAD patients stratified by the expression of SMARCA2 and SMARCA4 (median cutoff) using multiple algorithms including CIBERSORT, MCP-counter, EPIC, ESTIMATE, quantiseq, and TIMER. Statistical significance was determined by Kruskal-Wallis’s test. (F) The scatterplot showing the correlation between the protein levels of SMARCA2 and SMARCA4 and FAP, SPP1, ACTA2, CD3D, CD8A, and CD4. Correlation analysis was created with Pearson’s correlation.
Index in PubMed under a CC BY license. PMID: 40453096
Specific Publications For Anti-FAP1 Rabbit Monoclonal Antibody (M00422)
Loading publications
Recommended Resources
Here are featured tools and databases that you might find useful.
- Boster's Pathways Library
- Protein Databases
- Bioscience Research Protocol Resources
- Data Processing & Analysis Software
- Photo Editing Software
- Scientific Literature Resources
- Research Paper Management Tools
- Molecular Biology Software
- Primer Design Tools
- Bioinformatics Tools
- Phylogenetic Tree Analysis
Customer Reviews
Have you used Anti-FAP1 Rabbit Monoclonal Antibody?
Share your experimental results or join a short interview to earn up to $1,000 in product credits or other rewards.
1 Reviews For Anti-FAP1 Rabbit Monoclonal Antibody
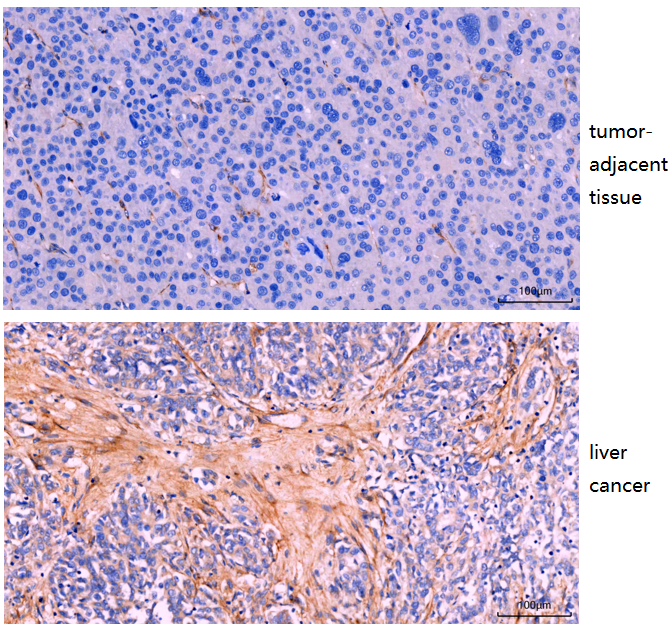
The Anti-FAP antibody (M00422) showed clear and specific IHC staining in human hepatocellular carcinoma, with low expression in adjacent normal tissue and strong expression in tumor stroma.
Excellent
| SKU | M00422 |
|---|---|
| Application | Immunohistochemistry |
| Sample | human liver cancer |
| Sample Processing Description | Collected clinical surgical human hepatocellular carcinoma and adjacent peritumoral tissues were fixed in formalin and embedded in paraffin. |
| Other Reagents | Goat serum, DAB Chromogenic Solution |
| Primary Antibody | FAP1 Rabbit Monoclonal Antibody |
| Primary Incubation | 1:200, overnight at 4 ℃ |
| Secondary Antibody | Two-step IHC kit (Immunohistochemistry kit |
| Secondary Incubation | 30 min at 37℃ |
| Detection | Imaging system:Leica DM2500 |
| Results Summary | FAP (fibroblast activation protein) expression is mainly associated with stromal cells in the tumor microenvironment and is very low in normal human tissues. Its role in hepatocellular carcinoma (HCC) is complex, but overall it functions as an important pro-tumor factor. High FAP expression is associated with poor prognosis. It can remodel the extracellular matrix, promote tumor invasion and metastasis, and suppress anti-tumor immunity. In this study, FAP showed low expression in peritumoral tissues (close to normal tissue) and high expression in the tumor stroma of HCC. |
Fei Long, Zhongnan Hospital of Wuhan University
Verified customer
Submitted 2026-02-12
Customer Q&As
Have a question?
Find answers in Q&As, reviews.
Can't find your answer?
Submit your question
5 Customer Q&As for Anti-FAP1 Rabbit Monoclonal Antibody
Question
We are currently using anti-FAP1 Rabbit Monoclonal antibody M00422 for human tissue, and we are satisfied with the IHC results. The species of reactivity given in the datasheet says human. Is it possible that the antibody can work on pig tissues as well?
Verified Customer
Verified customer
Asked: 2020-03-19
Answer
The anti-FAP1 Rabbit Monoclonal antibody (M00422) has not been validated for cross reactivity specifically with pig tissues, but there is a good chance of cross reactivity. We have an innovator award program that if you test this antibody and show it works in pig you can get your next antibody for free. Please contact me if I can help you with anything.
Boster Scientific Support
Answered: 2020-03-19
Question
My team were content with the WB result of your anti-FAP1 Rabbit Monoclonal antibody. However we have seen positive staining in fibroblast isoform 2: cytoplasm using this antibody. Is that expected? Could you tell me where is FAP supposed to be expressed?
Verified Customer
Verified customer
Asked: 2019-10-11
Answer
According to literature, fibroblast does express FAP. Generally FAP expresses in prolyl endopeptidase fap: cell surface, antiplasmin-cleaving enzyme fap, soluble, isoform 2: cytoplasm. Regarding which tissues have FAP expression, here are a few articles citing expression in various tissues:
Fibroblast, Pubmed ID: 7911242
Melanoma, Pubmed ID: 9065413, 9247085, 10644713
Placenta, Pubmed ID: 15489334
Plasma, Pubmed ID: 16335952
Boster Scientific Support
Answered: 2019-10-11
Question
Can M00422 antibody be used for IHC-P application?
Verified customer
Asked: 2019-07-05
Answer
The anti-FAP1 Rabbit Monoclonal Antibody (M00422) can be used for IHC-P application on human.
Boster Scientific Support
Answered: 2019-07-08
Question
We ordered your anti-FAP1 Rabbit Monoclonal antibody for WB on melanoma in a previous project. I am using human, and We intend to use the antibody for IHC next. I am looking for examining melanoma as well as placenta in our next experiment. Could you please give me some suggestion on which antibody would work the best for IHC?
Verified Customer
Verified customer
Asked: 2018-05-17
Answer
I have checked the website and datasheets of our anti-FAP1 Rabbit Monoclonal antibody and it seems that M00422 has been validated on human in both WB and IHC. Thus M00422 should work for your application. Our Boster satisfaction guarantee will cover this product for IHC in human even if the specific tissue type has not been validated. We do have a comprehensive range of products for IHC detection and you can check out our website bosterbio.com to find out more information about them.
Boster Scientific Support
Answered: 2018-05-17
Question
We have observed staining in human placenta. Any tips? Is anti-FAP1 Rabbit Monoclonal antibody supposed to stain placenta positively?
Verified Customer
Verified customer
Asked: 2017-05-25
Answer
From what I have seen in literature placenta does express FAP. From what I have seen in Uniprot.org, FAP is expressed in body of uterus, fibroblast, melanoma, placenta, plasma, among other tissues. Regarding which tissues have FAP expression, here are a few articles citing expression in various tissues:
Fibroblast, Pubmed ID: 7911242
Melanoma, Pubmed ID: 9065413, 9247085, 10644713
Placenta, Pubmed ID: 15489334
Plasma, Pubmed ID: 16335952
Boster Scientific Support
Answered: 2017-05-25
