Click image to see more details
-

-
-
-
-
+12
Product Info Summary
| SKU: | A00533 |
|---|---|
| Size: | 100 μg/vial |
| Reactive Species: | Mouse, Rat |
| Host: | Rabbit |
| Application: | WB, ELISA (Cap) |
Customers Who Bought This Also Bought

Product info
Product Name
Anti-GRO alpha/Cxcl1 Antibody Picoband®
SKU/Catalog Number
A00533
Size
100 μg/vial
Form
Lyophilized
Description
Boster Bio Anti-GRO alpha/Cxcl1 Antibody Picoband® catalog # A00533. Tested in ELISA, WB applications. This antibody reacts with Mouse, Rat. The brand Picoband indicates this is a premium antibody that guarantees superior quality, high affinity, and strong signals with minimal background in Western blot applications. Only our best-performing antibodies are designated as Picoband, ensuring unmatched performance.
Storage & Handling
Store at -20˚C for one year from date of receipt. After reconstitution, at 4˚C for one month. It can also be aliquotted and stored frozen at -20˚C for six months. Avoid repeated freeze-thaw cycles.
Cite This Product
Anti-GRO alpha/Cxcl1 Antibody Picoband® (Boster Biological Technology, Pleasanton CA, USA, Catalog # A00533)
Host
Rabbit
Contents
Each vial contains 4mg Trehalose, 0.9mg NaCl, 0.2mg Na2HPO4, 0.05mg NaN3.
Clonality
Polyclonal
Isotype
Rabbit IgG
Immunogen
E. coli-derived rat GRO alpha recombinant protein (Position: A25-K96).
Cross-reactivity
No cross-reactivity with other proteins.
Reactive Species
A00533 is reactive to Cxcl1 in Mouse, Rat
Observed Molecular Weight
11 kDa
Calculated molecular weight
10.2 kDa
Background of Cxcl1
This gene encodes a member of the calcium dependent lectin superfamily of type II transmembrane receptors. Expression of the encoded protein is induced upon activation of T lymphocytes, and may play a role in proliferation. Furthermore, the protein may act to transmit signals in natural killer cells and platelets.
Antibody Validation
Boster validates all antibodies on WB, IHC, ICC, Immunofluorescence, and ELISA with known positive control and negative samples to ensure specificity and high affinity, including thorough antibody incubations.
Application & Images
Applications
A00533 is guaranteed for WB, ELISA (Cap) Boster Guarantee
Recommend Dilution
| Application | Dilution | Species |
|---|---|---|
| Western blot | 0.1-0.5μg/ml | |
| ELISA (Cap) | 1-5μg/ml |
Validation Images & Assay Conditions
Click image to see more details
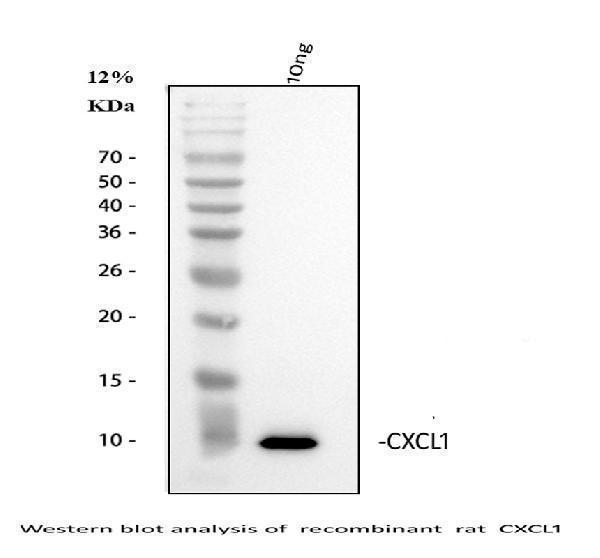
Western blot analysis of GRO alpha using anti-GRO alpha antibody (A00533).
Electrophoresis was performed on a 5-20% SDS-PAGE gel at 70V (Stacking gel) / 90V (Resolving gel) for 2-3 hours.
Lane 1: recombinant rat CXCL1 protein 10 ng.
After electrophoresis, proteins were transferred to a nitrocellulose membrane at 150 mA for 50-90 minutes. Blocked the membrane with 5% non-fat milk/TBS for 1.5 hour at RT. The membrane was incubated with rabbit anti-GRO alpha antigen affinity purified polyclonal antibody (Catalog # A00533) at 0.5 μg/mL overnight at 4°C, then washed with TBS-0.1%Tween 3 times with 5 minutes each and probed with a goat anti-rabbit IgG-HRP secondary antibody at a dilution of 1:5000 for 1.5 hour at RT. The signal is developed using an Enhanced Chemiluminescent detection (ECL) kit (Catalog # EK1002) with Tanon 5200 system. A specific band was detected for GRO alpha at approximately 11 kDa.

Click image to see more details
Experimental time flow. Pain threshold measurement, using a series of von Frey hairs with logarithmically increasing stiffness (0.02–2.56 g, Stoelting), was performed day − 2 and day − 1 prior to, as well as on day 14, day 21, day 28, and day 35 upon surgery (intraprostatic injection of 1% carrageenan (20 μl), day 0). The effects of intrathecal injection of different reagents on pain threshold were measured on day 14 or 35 after surgery. Some of sham and CP/CPPS mice were sacrificed for spinal cord slices for immunostaining on day 14. Others were sacrificed for prostate sampling for histology examination (H&E), spinal cord slices for immunostaining, spinal cord dorsal horn structures isolation for CXCL1 measurement by ELISA, and for pERK and ERK expression measurement by Western blot on day 35
Index in PubMed under a CC BY license. PMID: 31653262

Click image to see more details
Prostatitis induced CXCL1 expression in spinal cord dorsal horn and contributed to mechanical allodynia. a ELISA analysis showing CXCL1 expression was increased in spinal cord dorsal horn 5 weeks after carrageenan injection. * P < 0.05, vs. control (con, saline-treated group), Student’s t test. n = 4 mice per group. b ELISA analysis shows decreased CXCL1 release in the CSF in the carrageenan-injected group at 3 h after the intrathecal injection of CBX (5 μg). * P < 0.05, vs. control (con, saline-treated group); # P < 0.05, vs. the vehicle group. One-way ANOVA, followed by post hoc Bonferroni test. n = 4 mice/group. c Prostatitis-induced mechanical allodynia in the lower abdominal area were partially reversed by intrathecal injection of the CXCL1 neutralizing antibody (5 μg) at 5 weeks after carrageenan injection. d Prostatitis-induced mechanical allodynia in the lower abdominal area was partially reversed by intrathecal injection of the CXCR2 antagonist SB225002 (20 μg) at 5 weeks after carrageenan injection. BL, baseline. * P < 0.05, vs. Carr 5w, two-way ANOVA, followed by post-hoc Bonferroni test. n = 6 mice/group. All data are expressed as mean ± S.E.M. Arrows indicate drug injection
Index in PubMed under a CC BY license. PMID: 31653262

Click image to see more details
The number of MCs and percentage of MCs degranulation in CLN or skin from PbANKA-infected mice with C48/80 or DSCG treatment. (A,B) MCs were evaluated by toluidine blue staining in CLN (magnification, x400) or skin (magnification, x400) from the uninfected mice treated with saline (a), C48/80 (d), or DSCG (g), and the infected mice treated with saline (b), C48/80 (e), or DSCG (h) at 4 days p.i, respectively; infected mice treated with saline (c), C48/80 (f), or DSCG (i) at 9 days p.i., respectively; Intact MCs (arrowheads); Degranulated MCs (arrows). (C) The density of MCs in CLN or skin tissue were analyzed from different groups by using Student's t -test. * P < 0.05 and ** P < 0.01 vs. the Naive mice, # P < 0.05 and ## P < 0.01 vs. the infected controls at 4 days p.i., & P < 0.05 and && P < 0.01 vs. the infected controls at 9 days p.i.; (D) the level of degranulated MCs in CLN or skin tissue were analyzed from different groups by using Student's t -test. § P < 0.05 and §§ P < 0.01 vs. the Naive mice, $ P < 0.05 and $$ P < 0.01 vs. the C48/80 group, P < 0.05 and P < 0.01 vs. the DSCG group. There were four to six mice per group, and the data were representative of three experiments.
Index in PubMed under a CC BY license. PMID: 31552201

Click image to see more details
The changes of vascular permeability in liver or lung from PbANKA-infected mice with C48/80 or DSCG treatment. Mice were infected i.p. with 10 6 iRBCs, and treated with saline, C48/80 or DSCG. At 4 and 9 days p.i., different group of mice ( n = 4–6/group) were injected 100 μl of 1.0% Evans blue dye via tail veins, and the degree of vascular permeability in liver or lung was expressed as ng/mg of tissue weight. The experiment was repeated three times, and data were presented as means ± SD. * P < 0.05 and ** P < 0.01 vs. the Naive mice, # P < 0.05 and ## P < 0.01 vs. the infected controls at 4 days p.i., & P < 0.05 and && P < 0.01 vs. the infected controls at 9 days p.i. by using Student's t -test.
Index in PubMed under a CC BY license. PMID: 31552201

Click image to see more details
The changes of vascular permeability in brain from ECM mice caused by PbANKA infection with C48/80 or DSCG treatment. ECM mice were randomly selected from PbANKA-infected mice treated with saline (Pb group), C48/80 (Pb+C48/80 group), or DSCG (Pb+DSCG group). Different group of ECM mice ( n = 4–6/group) were injected 100 μl of 1.0% Evans blue dye via tail veins, (A) representative optical image of the brain was captured, and (B) the degree of vascular permeability in brain was expressed as ng/mg of tissue weight. The experiment was repeated three times, and data were presented as means ± SD. * P < 0.05 and ** P < 0.01 vs. ECM mice in Pb group. The statistical analysis of vascular permeability in brain of ECM mice was performed by Student's t -test.
Index in PubMed under a CC BY license. PMID: 31552201

Click image to see more details
Histopathological examination in CLN or liver tissue from PbANKA-infected mice with C48/80 or DSCG treatment. (A,B) Infected mice i.p. inoculated with 10 6 iRBCs from different groups were killed at 4 and 9 days p.i., and histopathology in CLN or liver was evaluated by H&E staining (magnification, x400). Naive mice (a); infected mice treated with saline at 4 days p.i. (b) and 9 days p.i. (c); uninfected mice treated with C48/80 (d); infected mice with C48/80 treatment at 4 days p.i. (e) and 9 days p.i. (f); uninfected mice treated with DSCG (g); infected mice with DSCG treatment at 4 days p.i. (h); and 9 days p.i. (i); Hyperplasia of germinal center (arrows); Inflammatory foci (arrowheads); (C) Liver damage was determined by measuring inflammatory foci counts per field, as well as the protein levels of AST and ALT in sera. There were four mice per group. The experiment was repeated three times, and the data were represented as mean ± SD. Statistically significant differences in liver histopathological score for comparison with the infected controls at 4 days p.i. ( # P < 0.05; and ## P < 0.01) and 9 days p.i. ( & P < 0.05; and && P < 0.01) by using Kruskal-Wallis rank sum test. Statistically significant differences in protein levels of AST or ALT in sera for comparison with Naive mice (* P < 0.05; and ** P < 0.01), with the infected controls at 4 days p.i. ( $ P < 0.05; and $$ P < 0.01) and 9 days p.i. ( P < 0.05; and P < 0.01) using Student's t -test.
Index in PubMed under a CC BY license. PMID: 31552201

Click image to see more details
The changes of leukocyte number from PbANKA-infected mice with C48/80 or DSCG treatment. Mice were infected i.p. with 10 6 iRBCs, and treated with saline, C48/80 or DSCG. At 4 and 9 days p.i., blood from different group of mice ( n = 4–6/group) was analyzed for the kind and numbers of leukocyte using hemocytometer. The experiment was repeated three times, and data were presented as means ± SD. * P < 0.05 and ** P < 0.01 vs. the Naive mice, # P < 0.05 and ## P < 0.01 vs. the infected controls at 4 days p.i., & P < 0.05 and && P < 0.01 vs. the infected controls at 9 days p.i. by using Student's t -test.
Index in PubMed under a CC BY license. PMID: 31552201

Click image to see more details
The changes of CCL2, CXCL1, MMP-9, and IgE in sera from PbANKA-infected mice with C48/80 or DSCG treatment. Mice were infected i.p. with 10 6 iRBCs, and treated with saline, C48/80 or DSCG. At 4 and 9 days p.i., sera were collected from different group of mice ( n = 4–6/group) and assessed for CCL2, CXCL1, MMP-9, and IgE by ELISA assay. The experiment was repeated three times, and data were presented as means ± SD. * P < 0.05 and ** P < 0.01 vs. the Naive mice, # P < 0.05 and ## P < 0.01 vs. the infected controls at 4 days p.i., & P < 0.05 and && P < 0.01 vs. the infected controls at 9 days p.i. by using Student's t -test.
Index in PubMed under a CC BY license. PMID: 31552201

Click image to see more details
Cytokine and chemokine receptor mRNA expressions in CLN or skin from PbANKA-infected mice with C48/80 or DSCG treatment using qPCR method. (A) mRNA levels of TNF-α, IFN-γ, IL-4, IL-10, CCR2, and CXCR2 in CLN tissue; (B) mRNA levels of TNF-α, IFN-γ, IL-4, IL-10, CCR2, and CXCR2 in skin tissue. There were 4 to 6 mice per group. The data were representative of three experiments, and presented as means ± SD. * P < 0.05 and ** P < 0.01 vs. the Naive mice, # P < 0.05 and ## P < 0.01 vs. the infected controls at 4 days p.i., & P < 0.05 and && P < 0.01 vs. the infected controls at 9 days p.i. by using Student's t -test.
Index in PubMed under a CC BY license. PMID: 31552201

Click image to see more details
The density of MCs tryptase-CCL2, -CXCL1, and -MMP-9 in CLN or skin from PbANKA-infected mice with C48/80 or DSCG treatment by immunofluorescence staining. (A,B) MCs tryptase-CCL2, -CXCL1, and -MMP-9 were evaluated in CLN or skin from uninfected control mice (Naive group), infected mice treated with saline (Pb group), C48/80 (Pb+C48/80 group), or DSCG (Pb+DSCG group) at 9 days p.i. Immunofluorescence positive signals would appear as yellow fluorescence once MCs tryptase and CCL2 (or CXCL1, MMP-9) were superimposed in one vision (magnification, x400). MCs were seen to release CCL2, CXCL1, or MMP-9 when CCL2, CXCL1, or MMP-9 was found outside the MCs cell membrane (arrows). (C,D) The density of MCs with CCL2, -CXCL1, or -MMP-9 outside cell membrane in CLN or skin tissue were analyzed from the uninfected control mice, infected mice treated with C48/80 or DSCG at 9 days p.i. The experiment was repeated three times, and data were presented as means ± SD. * P < 0.05 and ** P < 0.01 vs. the Naive mice, & P < 0.05 and && P < 0.01 vs. the infected controls at 9 days p.i. by using Student's t -test.
Index in PubMed under a CC BY license. PMID: 31552201

Click image to see more details
RM-1 cell inoculation induces CXCL1 upregulation in spinal astrocytes. (A) Real-time PCR results show the increase of CXCL1 mRNA expression in the spinal cord after inoculation. CXCL1 mRNA upregulation was gradually increased from 7 days to 21 days. * P <0.05 vs . sham control. n = 4 mice per group. (B-F) Immunostaining shows the CXCL1-IR was increased in the spinal cord at 7 days (D) , 14 days (E) , and 21 days (F) . *** P <0.001 vs . naive. n = 4 mice per group. (G-I) Double staining shows CXCL1 was colocalized with astrocytic marker, GFAP (G) , but not with microglial marker CD11b (H) or neuronal marker NeuN (I) .
Index in PubMed under a CC BY license. PMID: 24580964

Click image to see more details
Intrathecal injection of CXCL1 neutralizing antibody attenuates bone cancer pain. CXCL1 neutralizing antibody at a lower dose (4 μg) had mild effect on RM-1 cell inoculation-induced pain hypersensitivity (A, B) , whereas the neutralizing antibody at a higher dose (8 μg) reversed inoculation-induced mechanical allodynia (A) and heat hyperalgesia (B) for more than 6 h. * P <0.05, ** P <0.01, *** P <0.001 vs . control serum. n = 6 mice per group.
Index in PubMed under a CC BY license. PMID: 24580964

Click image to see more details
TNF-α induces NFκB-dependent CXCL1 increase in cultured astrocytes. (A-D) CXCL1 was expressed in control astrocytes (A) and increased at 1 h after TNF-α incubation (B) . Double staining of CXCL1 (B) with GFAP (C) shows the expression of CXCL1 by astrocytes (D) . (E) ELISA results show TNF-α-induced CXCL1 upregulation was decreased by pretreatment with NFκB inhibitor, BAY11-7082. *** P <0.001 vs . control. # P <0.05, ### P <0.001 vs . TNF-α treatment. (F) Quantitative PCR shows TNF-α-induced CXCL1 mRNA increase was decreased by BAY11-7082. *** P <0.001 vs . control. ## P <0.01, ### P <0.001 vs. TNF-α treatment.
Index in PubMed under a CC BY license. PMID: 24580964

Click image to see more details
NFκB inhibitor attenuated RM-1 cell inoculation-induced pain hypersensitivity and upregulation of CXCL1 in the spinal cord. (A, B) Intrathecal injection of NFκB inhibitor, BAY11-7082 at the dose of 0.4 μg had no effect on mechanical allodynia or heat hyperalgesia, whereas at the dose of 4 μg attenuated mechanical allodynia (A) and heat hyperalgesia (B) at 1 h and 3 h. * P <0.05, ** P <0.01, *** P <0.001 vs. vehicle. One-way ANOVA followed by Newman-Keuls test. (C, D) Immunostaining of CXCL1 in the spinal cord in vehicle and BAY11-7082-treated animals. (E) The CXCL1-IF intensity was decreased by BAY11-7082. *** P <0.001 vs . vehicle. n = 4 mice per group.
Index in PubMed under a CC BY license. PMID: 24580964

Click image to see more details
Sandwich ELISA - Recombinant rat GRO alpha/Cxcl1 protein standard curve.
Use in combination with reagents from Rat GRO alpha/Cxcl1 ELISA Kit EZ-Set (DIY Antibody Pairs) (EZ0724).
Specific Publications For Anti-GRO alpha/Cxcl1 Antibody Picoband® (A00533)
Loading publications
Recommended Resources
Here are featured tools and databases that you might find useful.
- Boster's Pathways Library
- Protein Databases
- Bioscience Research Protocol Resources
- Data Processing & Analysis Software
- Photo Editing Software
- Scientific Literature Resources
- Research Paper Management Tools
- Molecular Biology Software
- Primer Design Tools
- Bioinformatics Tools
- Phylogenetic Tree Analysis
Customer Reviews
Have you used Anti-GRO alpha/Cxcl1 Antibody Picoband®?
Share your experimental results or join a short interview to earn up to $1,000 in product credits or other rewards.
0 Reviews For Anti-GRO alpha/Cxcl1 Antibody Picoband®
Customer Q&As
Have a question?
Find answers in Q&As, reviews.
Can't find your answer?
Submit your question
