Click image to see more details
-

-
-
-
-
+8
Product Info Summary
| SKU: | M01543-1 |
|---|---|
| Size: | 100 μl |
| Reactive Species: | Human, Mouse, Rat |
| Host: | Rabbit |
| Application: | Flow Cytometry, IP, IF, IHC, ICC, WB |
Customers Who Bought This Also Bought

Product info
Product Name
Anti-MAP1LC3A/Lc3A Rabbit Monoclonal Antibody
SKU/Catalog Number
M01543-1
BM4367 is an alternative SKU for this antibody, used in previous lots.
Size
100 μl
Form
Liquid
Description
Boster Bio Anti-MAP1LC3A/Lc3A Rabbit Monoclonal Antibody catalog # M01543-1. Tested in WB, IHC, ICC/IF, IP, Flow Cytometry applications. This antibody reacts with Human, Mouse, Rat.
Storage & Handling
Store at -20°C for one year. For short term storage and frequent use, store at 4°C for up to one month. Avoid repeated freeze-thaw cycles.
Cite This Product
Anti-MAP1LC3A/Lc3A Rabbit Monoclonal Antibody (Boster Biological Technology, Pleasanton CA, USA, Catalog # M01543-1)
Host
Rabbit
Contents
Rabbit IgG in stabilizing components, phosphate buffered saline, pH 7.4, 150mM NaCl, 0.02% sodium azide and 50% glycerol.
*This antibody is supplied in a stabilized formulation.
Compatibility with conjugation reactions depends on the chemistry of the conjugation method used.
For conjugation methods that are not compatible with the stabilizing components present in this formulation, a carrier-free antibody format is required.
Clonality
Monoclonal
Clone Number
EOD-13
Isotype
Rabbit IgG
Immunogen
A synthesized peptide derived from human MAP1LC3A
Reactive Species
M01543-1 is reactive to MAP1LC3A in Human, Mouse, Rat
Observed Molecular Weight
18 kDa
Calculated molecular weight
14.3 kDa
Antibody Validation
Boster validates all antibodies on WB, IHC, ICC, Immunofluorescence, and ELISA with known positive control and negative samples to ensure specificity and high affinity, including thorough antibody incubations.
Application & Images
Applications
M01543-1 is guaranteed for Flow Cytometry, IP, IF, IHC, ICC, WB Boster Guarantee
Recommend Dilution
WB 1:500-2000
IHC 1:50-200
ICC/IF 1:50-200
IP 1:50
FC 1:50
Tested application
Suggested blocking solution with 5% non-fat milk or BSA; (*)Recommended protein loading: 20-40 µg per lane
Use TE buffer pH 9.0 for antigen retrieval; (*) citrate buffer pH 6.0 is an alternative.
Validation Images & Assay Conditions
Click image to see more details
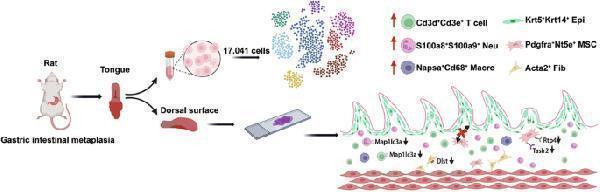
Characteristics of the tongue dorsum mucosal cell landscape in the rats with gastric intestinal metaplasia. The abundances of T cells, neutrophils, and macrophages were upregulated, and the autophagy marker gene Map1lc3a in T cells and neutrophils was downregulated, which indicated an actively inflammatory immune response. Downregulation of cuprotosis marker gene Dlst in fibroblasts suggested potential damage to the mucosal barrier. Meanwhile, the expression of bitter receptor Rtp4 and sweet receptor Tas1r2 in mesenchymal stem cells was downregulated. The cell communication ability was reduced, especially between mesenchymal stem cells and epithelial cells. In a word, the abnormal status of tongue dorsum mucosa may accompany the development of gastric intestinal metaplasia.
Index in PubMed under a CC BY license. PMID: 40090940

Click image to see more details
Characterization of cell death in the tongue dorsal mucosal tissue of GIM rats. Based on the cell-death-related marker genes, differential analysis was conducted between the control and GIM groups. A Differential analysis of apoptosis-related genes. B Differential analysis of pyroptosis-related genes. C Differential analysis of autophagy-related genes. D Differential analysis of ferroptosis-related genes. E Differential analysis of necroptosis-related genes. F Differential analysis of cuproptosis-related genes. G Immunofluorescence staining of Mapllc3a and Gpx4 expression in tongue dorsal mucosal tissue (magnification: ×20, scale bar: 50 μm). Data with error bars are shown as mean ± standard deviation. * P < 0.05, ** P < 0.01, *** P < 0.001, and **** P < 0.0001 as determined by independent t -tests.
Index in PubMed under a CC BY license. PMID: 40090940

Click image to see more details
XAG induces HCC cell autophagy. Cells were co-cultured with 10 and 20 μM of XAG or vehicle for 48 h. a Effect of XAG on the development of acidic vesicle organelles (AVO) in Bel 7402 and SMMC 7721 cells was examined by Acridine orange (AO) staining. Red plot represents AVO. b Western blotting demonstrated expression of autophagy-related proteins, including LC3B-I, LC3B-II, p62/SQSTM1, Beclin-1, and Atg5. GAPDH was used as control group as well. ** p <0.01. c Bel 7402 and SMMC 7721 cells were infected with an adenovirus expression of mRFP-GFP-LC3. Effect of XAG on the formation of autolysosome was observed under a fluorescence microscope, with 400× magnification. mRFP was used to label and track the LC3B-II in HCC cells, decrease of GFP indicates the fusion of lysosome and autophagosome, as well as formation of autolysosome. Yellow puncta and red puncta imply to autophagosome and autolysosome, respectively. Results represent independent experiments in triplicate
Index in PubMed under a CC BY license. PMID: 30621754

Click image to see more details
p-JNK is required for the autophagy-induced by XAG in HCC cells. Cells were pre-treated with or without JNK inhibitor, SP600125 (20 μM), for 6 h, then were co-cultured with 20 μM of XAG for 48 h. a Expression levels of LC3B-II, p62/SQSTM1, Beclin-1, and Atg5 in HCC cells were analyzed by Western blotting, and GAPDH was severed as control group. ** p <0.01. b Flow cytometry was performed to quantify the apoptotic cell ratio. ** p <0.01. c The expression levels of Bax, Bcl-2, and cleaved caspase-3 in HCC cells were analyzed by Western blotting. GAPDH was served as control group as well. ** p <0.01
Index in PubMed under a CC BY license. PMID: 30621754

Click image to see more details
Apoptosis-inducing effect of XAG on HCC cells was abrogated by autophagy mediated by triggering ERS signaling pathway. a Bel 7402 and SMMC 7721 cells were co-cultured with 10 and 20 μM of XAG or vehicle. Western blotting analysis detected the expression of ERS-related proteins, including CHOP, GRP78, ATF-6, p-eIF2α, IRE1α, and cleaved caspase-12. GAPDH was used as control group. ** p <0.01. b After cells were pre-treated with or without 2.5 mM of TUDCA (as ERS inhibitor), then co-cultured with 20 μM of XAG for 48 h. The expression levels of LC3B-II, p62/SQSTM1, Beclin 1, Atg5 were analyzed by Western blotting, and GAPDH was used as control group. ** p <0.01. (c) After cells were transfected with shRNA targeting CHOP, then were treated with or without 20 μM of XAG for 48 h. Expression of autophagy-associated proteins (LC3B-II, p62/SQSTM1, Beclin-1, and Atg5) was detected by Western blotting, and GAPDH was used as control group. ** p <0.01. d After cells were pre-treated with or without 2.5 mM of TUDCA (an ERS inhibitor), then were co-cultured with 20 μM of XAG for 48 h. Cell apoptotic ratio in each treatment group was quantified by flow cytometry. ** p <0.01. e After cells were pre-treated with or without 2.5 mM of TUDCA, then were co-cultured with 20 μM of XAG for 48 h. The expression of Bax, Bcl-2, and cleaved caspase-3 was analyzed by Western blotting, and GAPDH was used as control group. ** p <0.01. f After cells were transfected with shRNA targeting CHOP, then were treated with or without 20 μM of XAG for 48 h. Cell apoptotic ratio was quantified by flow cytometry. ** p <0.01. g After cells were transfected with shRNA targeting CHOP, then were treated with or without 20 μM of XAG for 48 h. The expression levels of Bax, Bcl-2, and cleaved caspase-3 were analyzed by Western blotting, and GAPDH was used as control group. ** p <0.01
Index in PubMed under a CC BY license. PMID: 30621754

Click image to see more details
XAG suppresses tumor growth in HCC xenograft model. a Mice were respectively given vehicle (0.9% sodium chloride plus 1% DMSO) orally, and injected intraperitoneally with 40 or 80 mg/kg XAG, tumor volume and body weight (e) were measured every 3 days for 24 days. ** p <0.01. b After tumor was isolated from mice, the weight of tumor tissues was measured. ** p <0.01. c TUNEL staining measured cell apoptosis in tumor tissues. ** p <0.01. d IHC detected the expression levels of Ki-67, cleaved caspase-3, Beclin 1, CHOP, GRP78, p-JNK, p-c-jun in tumor tissues. LC3 expression in tumor tissues was detected by Immunofluorescence. ** p <0.01. f The levels of ALT, AST, and urea nitrogen in tumor tissues were detected using all-automatic biochemical analyzer. ** p <0.01. g HE staining examined the histopathologic characteristics of lung, liver, spleen, kindey, heart in each treatment groups
Index in PubMed under a CC BY license. PMID: 30621754

Click image to see more details
Western blot analysis of MAP1LC3A using anti-MAP1LC3A antibody (M01543-1).
Electrophoresis was performed on a 5-20% SDS-PAGE gel at 70V (Stacking gel) / 90V (Resolving gel) for 2-3 hours. The sample well of each lane was loaded with 30 ug of sample under reducing conditions.
Lane 1: human Hela whole cell lysates,
Lane 2: human SH-SY5Y whole cell lysates,
Lane 3: human U251 whole cell lysates,
Lane 4: human SiHa whole cell lysates,
Lane 5: rat brain tissue lysates,
Lane 6: rat heart tissue lysates,
Lane 7: mouse brain tissue lysates,
Lane 8: mouse heart tissue lysates.
After electrophoresis, proteins were transferred to a nitrocellulose membrane at 150 mA for 50-90 minutes. Blocked the membrane with 5% non-fat milk/TBS for 1.5 hour at RT. The membrane was incubated with rabbit anti-MAP1LC3A antigen affinity purified monoclonal antibody (Catalog # M01543-1) at 1:500 overnight at 4°C, then washed with TBS-0.1%Tween 3 times with 5 minutes each and probed with a goat anti-rabbit IgG-HRP secondary antibody at a dilution of 1:500 for 1.5 hour at RT. The signal is developed using an Enhanced Chemiluminescent detection (ECL) kit (Catalog # EK1002) with Tanon 5200 system. A specific band was detected for MAP1LC3A at approximately 18 kDa. The expected band size for MAP1LC3A is at 14 kDa.

Click image to see more details
Immunohistochemical analysis of paraffin-embedded human stomach, using MAP1LC3A Antibody.

Click image to see more details
Immunofluorescent analysis using the Antibody at 1:50 dilution.

Click image to see more details
Immunofluorescent analysis using the Antibody at 1:150 dilution.

Click image to see more details
Immunofluorescent analysis using the Antibody at 1:500 dilution.

Click image to see more details
Immunofluorescent analysis of Hela cells, using MAP1LC3A Antibody .
Specific Publications For Anti-MAP1LC3A/Lc3A Rabbit Monoclonal Antibody (M01543-1)
Loading publications
Recommended Resources
Here are featured tools and databases that you might find useful.
- Boster's Pathways Library
- Protein Databases
- Bioscience Research Protocol Resources
- Data Processing & Analysis Software
- Photo Editing Software
- Scientific Literature Resources
- Research Paper Management Tools
- Molecular Biology Software
- Primer Design Tools
- Bioinformatics Tools
- Phylogenetic Tree Analysis
Customer Reviews
Have you used Anti-MAP1LC3A/Lc3A Rabbit Monoclonal Antibody?
Share your experimental results or join a short interview to earn up to $1,000 in product credits or other rewards.
0 Reviews For Anti-MAP1LC3A/Lc3A Rabbit Monoclonal Antibody
Customer Q&As
Have a question?
Find answers in Q&As, reviews.
Can't find your answer?
Submit your question
