



Click image to see more details
-

-
-
-
-
+3
Product Info Summary
| SKU: | M01823 |
|---|---|
| Size: | 100 μl |
| Reactive Species: | Human |
| Host: | Rabbit |
| Application: | IP, IF, IHC, ICC, WB |
Customers Who Bought This Also Bought

Product info
Product Name
Anti-Midkine MDK Rabbit Monoclonal Antibody
SKU/Catalog Number
M01823
BM4392 is an alternative SKU for this antibody, used in previous lots.
Size
100 μl
Form
Liquid
Description
Boster Bio Anti-Midkine MDK Rabbit Monoclonal Antibody catalog # M01823. Tested in WB, IHC, ICC/IF, IP applications. This antibody reacts with Human.
Storage & Handling
Store at -20°C for one year. For short term storage and frequent use, store at 4°C for up to one month. Avoid repeated freeze-thaw cycles.
Cite This Product
Anti-Midkine MDK Rabbit Monoclonal Antibody (Boster Biological Technology, Pleasanton CA, USA, Catalog # M01823)
Host
Rabbit
Contents
Rabbit IgG in stabilizing components, phosphate buffered saline, pH 7.4, 150mM NaCl, 0.02% sodium azide and 50% glycerol.
*This antibody is supplied in a stabilized formulation.
Compatibility with conjugation reactions depends on the chemistry of the conjugation method used.
For conjugation methods that are not compatible with the stabilizing components present in this formulation, a carrier-free antibody format is required.
Clonality
Monoclonal
Clone Number
EBI-13
Isotype
Rabbit IgG
Immunogen
A synthesized peptide derived from human Midkine
Reactive Species
M01823 is reactive to MDK in Human
Observed Molecular Weight
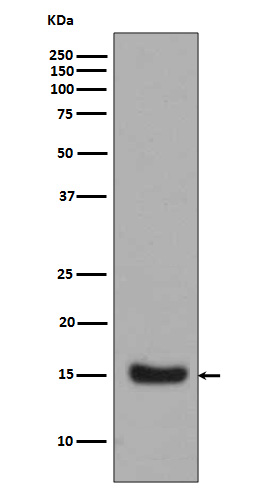
16 kDa
Calculated molecular weight
15.6 kDa
Antibody Validation
Boster validates all antibodies on WB, IHC, ICC, Immunofluorescence, and ELISA with known positive control and negative samples to ensure specificity and high affinity, including thorough antibody incubations.
Application & Images
Applications
M01823 is guaranteed for IP, IF, IHC, ICC, WB Boster Guarantee
Recommend Dilution
WB 1:500-2000
IHC 1:50-200
ICC/IF 1:50-200
IP 1:30
Tested application
Use TE buffer pH 9.0 for antigen retrieval; (*) citrate buffer pH 6.0 is an alternative.
Validation Images & Assay Conditions
Click image to see more details
Western blot analysis of Midkine expression in Midkine Recombinant protein.
Click image to see more details
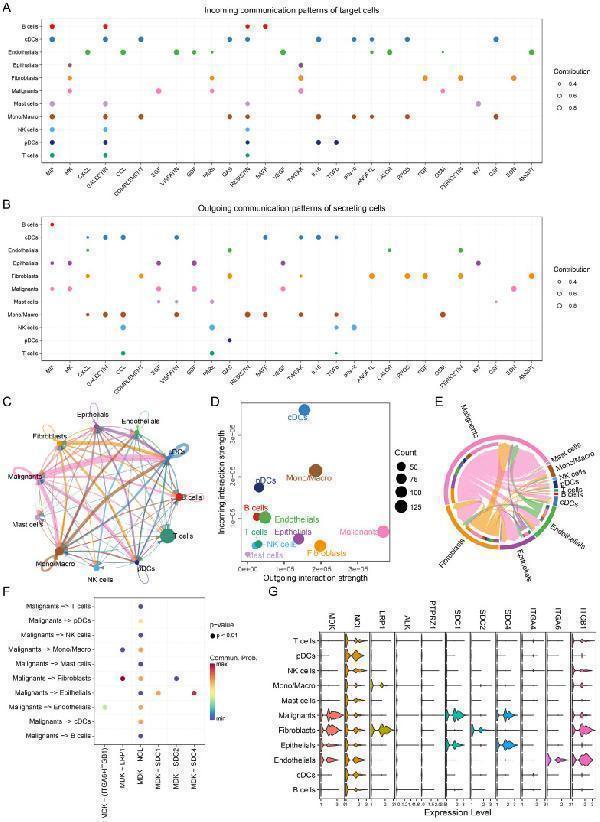
Single-cell communication networks. (A) Incoming communication patterns of target cells, showing pathways to which each cell type responds. (B) Outgoing communication patterns of secreting cells, illustrating the pathways through which cells send signals, MIF, MK and CXCL pathway exhibit high activity. (C) Network diagram showing the strength of intercellular communication, with connections between various cell types. (D) Scatter plot comparing outgoing and incoming communication strengths across cell populations, with bubble size indicating the number of interactions, malignant cells have higher strength of intercellular communication. (E) Chord diagram depicting communication via the MK pathway between different cell types. (F) Ligand-receptor interaction probabilities within the MK pathway between malignant and other cell types. Dot size represents significance (P-value), and color represents communication probability highlighting the MDK-NCL signaling pathway. (G) Violin plots of MK pathway gene expression levels across cell types, showing gene activity variations, MDK has advancer expression level in malignant cells.
Index in PubMed under a CC BY license. PMID: 40396179
Click image to see more details
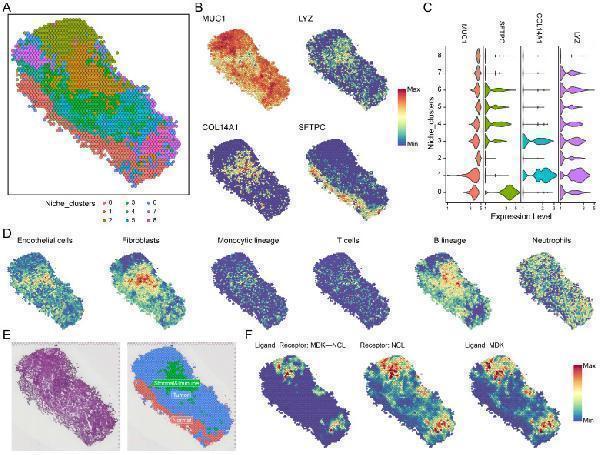
Spatial transcriptomics and MDK-NCL signal communication. (A) Niche clustering in spatial transcriptomics samples, identifying distinct ecological zones. (B) Spatial expression of representative markers in key regions: MUC1 (tumor region), LYZ (immune region), COL14A1 (stromal region), and SFTPC (normal region). (C) Violin plots displaying the expression of MUC1, LYZ, COL14A1, and SFTPC across different niches. (D) MCPcounter analysis showing the infiltration of six cell types (e.g., endothelial cells, fibroblasts, immune lineages) across spatial regions. (E) Spatial niche classification, distinguishing tumor, immune-stromal, and normal regions. (F) MDK-NCL ligand-receptor interaction analysis, spatially mapping MDK ligands, NCL receptors, and their binding regions.
Index in PubMed under a CC BY license. PMID: 40396179
Click image to see more details
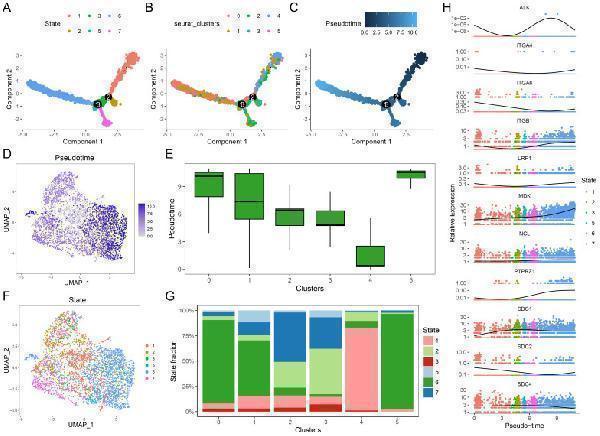
Single-cell pseudotime analysis. (A) Pseudotime trajectory analysis showing the 6 differentiation states of cells. (B) Subtype classification of malignant cells along the pseudotime trajectory. (C) Pseudotime scores mapped along the differentiation trajectory. (D) UMAP plot visualizing pseudotime scores across individual cells. (E) Box plots comparing pseudotime scores across different malignant cell clusters, cluster 0, 1, and 5 had higher pseudotime scores. (F) UMAP plot of differentiation states, with colors representing distinct states. (G) Stacked bar plots showing the proportion of differentiation states within each malignant cell cluster, cluster 0, 1, and 5 have larger proportion of state 6. (H) Expression dynamics of MK pathway genes (e.g., MDK, NCL, ITG genes) along the pseudotime trajectory, highlighting gene expression changes during differentiation, MDK and NCL express more in the later time.
Index in PubMed under a CC BY license. PMID: 40396179
Click image to see more details
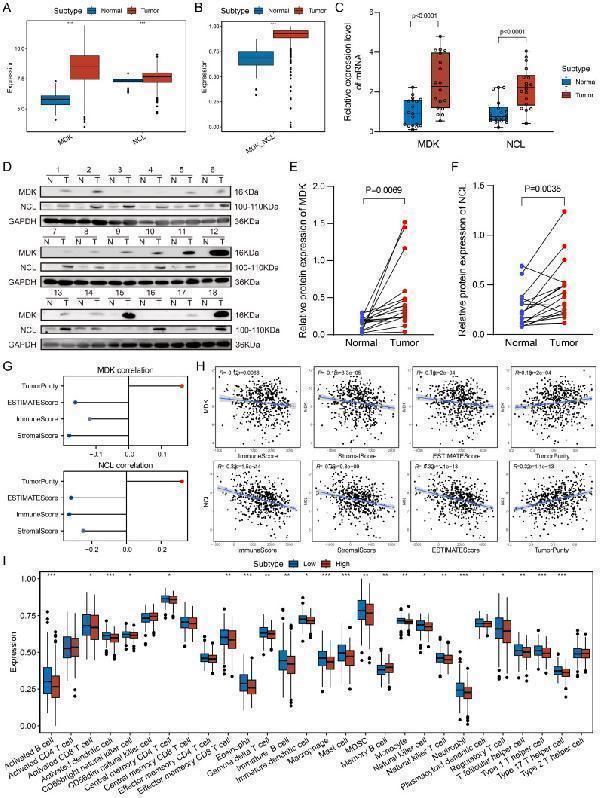
Association of MDK-NCL with the immune microenvironment. (A) Boxplot shows the expression levels of MDK and NCL genes in tumor and control groups, it exhibit higher activity in tumor group. (B) MDK-NCL enrichment scores in tumor and control groups. (C) Relative mRNA expression levels of MDK and NCL in tumor and control groups from in-house data. (D) Relative protein expression levels of MDK and NCL in tumor and control groups from in-house data. (E) Comparison of MDK protein expression levels between tumor and control groups. (F) Comparison of NCL protein expression levels between tumor and control groups. (G) Correlation of MDK and NCL expression with ImmuneScore, StromalScore, ESTIMATEScore, and TumorPurity. (H) Scatter plots depicting the relationship between MDK and NCL expression and immune-related scores (ImmuneScore, StromalScore, ESTIMATEScore) as well as TumorPurity. (I) Comparison of immune cell infiltration scores across high and low MDK-NCL expression groups for 28 immune cell types. *P < 0.05, **P < 0.01, ***P < 0.001.
Index in PubMed under a CC BY license. PMID: 40396179
Click image to see more details
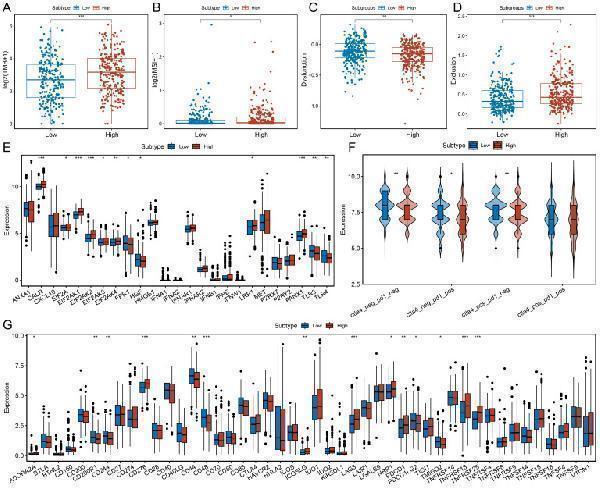
Association of MDK-NCL with immunotherapy response. (A) Comparison of tumor mutation burden (TMB) between high and low MDK-NCL expression groups. (B) Comparison of microsatellite instability (MSI) between high and low MDK-NCL groups. (C) Comparison of dysfunction scores between high and low MDK-NCL groups. (D) Comparison of exclusion scores between high and low MDK-NCL groups. (E) Expression of immunogenic cell death (ICD)-related genes in high and low MDK-NCL groups. (F) Expression levels of CTLA4 and PD1 in high and low MDK-NCL groups. (G) Comparison of immune checkpoint gene expression between high and low MDK-NCL expression groups. *P < 0.05, **P < 0.01, ***P < 0.001.
Index in PubMed under a CC BY license. PMID: 40396179
Click image to see more details
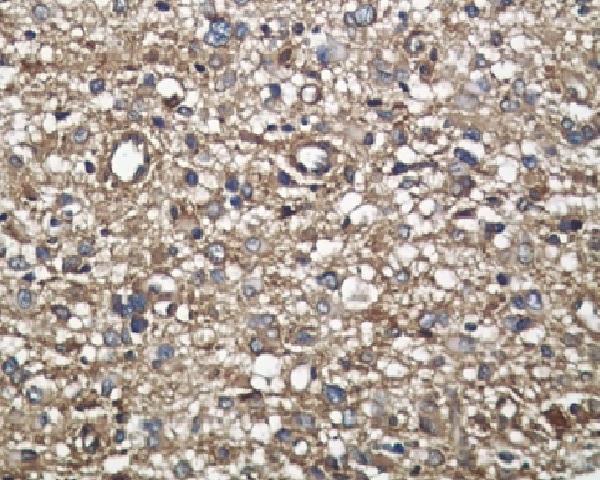
Immunohistochemical analysis of paraffin-embedded human liver carcinoma, using Midkine Antibody .
Specific Publications For Anti-Midkine MDK Rabbit Monoclonal Antibody (M01823)
Loading publications
Recommended Resources
Here are featured tools and databases that you might find useful.
- Boster's Pathways Library
- Protein Databases
- Bioscience Research Protocol Resources
- Data Processing & Analysis Software
- Photo Editing Software
- Scientific Literature Resources
- Research Paper Management Tools
- Molecular Biology Software
- Primer Design Tools
- Bioinformatics Tools
- Phylogenetic Tree Analysis
Customer Reviews
Have you used Anti-Midkine MDK Rabbit Monoclonal Antibody?
Share your experimental results or join a short interview to earn up to $1,000 in product credits or other rewards.
0 Reviews For Anti-Midkine MDK Rabbit Monoclonal Antibody
Customer Q&As
Have a question?
Find answers in Q&As, reviews.
Can't find your answer?
Submit your question

