Product Info Summary
| SKU: | A00024-2 |
|---|---|
| Size: | 100 μg/vial |
| Reactive Species: | Human, Mouse, Rat |
| Host: | Rabbit |
| Application: | ELISA, Flow Cytometry, IF, ICC, WB |
Customers Who Bought This Also Bought
Product info
Product Name
Anti-AKT1,2,3 Antibody Picoband®
SKU/Catalog Number
A00024-2
Size
100 μg/vial
Form
Lyophilized
Description
Boster Bio Anti-AKT1,2,3 Antibody Picoband® catalog # A00024-2. Tested in ELISA, Flow Cytometry, IF, ICC, WB applications. This antibody reacts with Human, Mouse, Rat. The brand Picoband indicates this is a premium antibody that guarantees superior quality, high affinity, and strong signals with minimal background in Western blot applications. Only our best-performing antibodies are designated as Picoband, ensuring unmatched performance.
Storage & Handling
At -20°C for one year from date of receipt. After reconstitution, at 4°C for one month. It can also be aliquotted and stored frozen at -20°C for six months. Avoid repeated freezing and thawing.
Cite This Product
Anti-AKT1,2,3 Antibody Picoband® (Boster Biological Technology, Pleasanton CA, USA, Catalog # A00024-2)
Host
Rabbit
Contents
Each vial contains 4 mg Trehalose, 0.9 mg NaCl, 0.2 mg Na2HPO4.
Clonality
Polyclonal
Isotype
Rabbit IgG
Immunogen
E.coli-derived human AKT1,2,3 recombinant protein (Position: E17-A477).
Cross-reactivity
No cross-reactivity with other proteins.
Reactive Species
A00024-2 is reactive to AKT1,2,3 in Human, Mouse, Rat
Observed Molecular Weight
60 kDa
Background of AKT1,2,3
RAC-alpha serine/threonine-protein kinase is an enzyme that in humans is encoded by the AKT1 gene. This gene encodes one of the three members of the human AKT serine-threonine protein kinase family which are often referred to as protein kinase B alpha, beta, and gamma. These highly similar AKT proteins all have an N-terminal pleckstrin homology domain, a serine/threonine-specific kinase domain and a C-terminal regulatory domain. These proteins are phosphorylated by phosphoinositide 3-kinase (PI3K). AKT/PI3K forms a key component of many signalling pathways that involve the binding of membrane-bound ligands such as receptor tyrosine kinases, G-protein coupled receptors, and integrin-linked kinase. These AKT proteins therefore regulate a wide variety of cellular functions including cell proliferation, survival, metabolism, and angiogenesis in both normal and malignant cells. AKT proteins are recruited to the cell membrane by phosphatidylinositol 3,4,5-trisphosphate (PIP3) after phosphorylation of phosphatidylinositol 4,5-bisphosphate (PIP2) by PI3K. Subsequent phosphorylation of both threonine residue 308 and serine residue 473 is required for full activation of the AKT1 protein encoded by this gene. Phosphorylation of additional residues also occurs, for example, in response to insulin growth factor-1 and epidermal growth factor. Protein phosphatases act as negative regulators of AKT proteins by dephosphorylating AKT or PIP3. The PI3K/AKT signalling pathway is crucial for tumor cell survival. Survival factors can suppress apoptosis in a transcription-independent manner by activating AKT1 which then phosphorylates and inactivates components of the apoptotic machinery. AKT proteins also participate in the mammalian target of rapamycin (mTOR) signalling pathway which controls the assembly of the eukaryotic translation initiation factor 4F (eIF4E) complex and this pathway, in addition to responding to extracellular signals from growth factors and cytokines, is disregulated in many cancers. Mutations in this gene are associated with multiple types of cancer and excessive tissue growth including Proteus syndrome and Cowden syndrome 6, and breast, colorectal, and ovarian cancers. Multiple alternatively spliced transcript variants have been found for this gene.
Antibody Validation
Boster validates all antibodies on WB, IHC, ICC, Immunofluorescence, and ELISA with known positive control and negative samples to ensure specificity and high affinity, including thorough antibody incubations.
Application & Images
Applications
A00024-2 is guaranteed for ELISA, Flow Cytometry, IF, ICC, WB Boster Guarantee
Recommend Dilution
| Application | Dilution | Species |
|---|---|---|
| Western blot | 0.25-0.5 μg/ml | Human, Mouse, Rat |
| Immunocytochemistry/Immunofluorescence | 5 μg/ml | Human |
| Flow Cytometry (Fixed) | 1-3 μg/1x106 cells | Human |
| ELISA | 0.1-0.5 μg/ml | - |
Tested application
Suggested blocking solution with 5% non-fat milk or BSA; (*)Recommended protein loading: 20-40 µg per lane
Validation Images & Assay Conditions
Click image to see more details
Western blot analysis of AKT1,2,3 using anti-AKT1,2,3 antibody (A00024-2).
Electrophoresis was performed on a 5-20% SDS-PAGE gel at 70V (Stacking gel) / 90V (Resolving gel) for 2-3 hours. The sample well of each lane was loaded with 30 ug of sample under reducing conditions.
Lane 1: human A549 whole cell lysates,
Lane 2: human Hela whole cell lysates,
Lane 3: human HepG2 whole cell lysates,
Lane 4: human Raji whole cell lysates,
Lane 5: rat brain tissue lysates,
Lane 6: rat PC-12 whole cell lysates,
Lane 7: mouse brain tissue lysates,
Lane 8: mouse RAW264.7 whole cell lysates.
After electrophoresis, proteins were transferred to a nitrocellulose membrane at 150 mA for 50-90 minutes. Blocked the membrane with 5% non-fat milk/TBS for 1.5 hour at RT. The membrane was incubated with rabbit anti-AKT1,2,3 antigen affinity purified polyclonal antibody (Catalog # A00024-2) at 0.5 μg/mL overnight at 4°C, then washed with TBS-0.1%Tween 3 times with 5 minutes each and probed with a goat anti-rabbit IgG-HRP secondary antibody at a dilution of 1:5000 for 1.5 hour at RT. The signal is developed using an Enhanced Chemiluminescent detection (ECL) kit (Catalog # EK1002) with Tanon 5200 system. A specific band was detected for AKT1,2,3 at approximately 60 kDa. The expected band size for AKT1,2,3 is at 60 kDa.
Click image to see more details
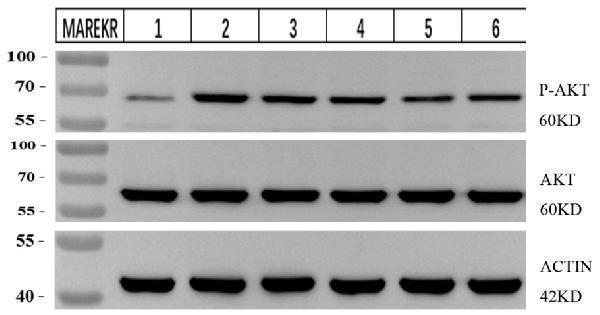
Western blot analysis of AKT1,2,3 using anti-AKT1,2,3 antibody (A00024-2).
Electrophoresis was performed on a 5-20% SDS-PAGE gel at 70V (Stacking gel) / 90V (Resolving gel) for 2-3 hours. The sample well of each lane was loaded with 30 ug of sample under reducing conditions.
Lane 1: human 4T1 whole cell lysates,
Lane 2: LPS-stimulated 4T1 whole cell lysates,
Lane 3: Low-dose drug treatment 4T1 whole cell lysates,
Lane 4: Medium-dose drug treatment 4T1 whole cell lysates,
Lane 5: High-dose drug treatment 4T1 whole cell lysates,
Lane 6: Positive control drug treatment 4T1 whole cell lysates.
After electrophoresis, proteins were transferred to a nitrocellulose membrane at 150 mA for 50-90 minutes. Blocked the membrane with 5% non-fat milk/TBS for 1.5 hour at RT. The membrane was incubated with rabbit anti-AKT1,2,3 antigen affinity purified polyclonal antibody (Catalog # A00024-2) at 1:10000 overnight at 4°C, then washed with TBS-0.1%Tween 3 times with 5 minutes each and probed with a goat anti-rabbit IgG-HRP secondary antibody at a dilution of 1:10000 for 1 hour at RT. The signal is developed using an Enhanced Chemiluminescent detection (ECL) kit (Catalog # EK1002) with ChemiDoc MP system. A specific band was detected for AKT1,2,3 at approximately 60 kDa. The expected band size for AKT1,2,3 is at 60 kDa.
Click image to see more details
IF analysis of AKT1,2,3 using anti-AKT1,2,3 antibody (A00024-2).
AKT1,2,3 was detected in an immunocytochemical section of MCF-7 cells. Enzyme antigen retrieval was performed using IHC enzyme antigen retrieval reagent (AR0022) for 15 mins. The cells were blocked with 10% goat serum. And then incubated with 5 μg/mL rabbit anti-AKT1,2,3 Antibody (A00024-2) overnight at 4°C. DyLight®488 Conjugated Goat Anti-Rabbit IgG (BA1127) was used as secondary antibody at 1:100 dilution and incubated for 30 minutes at 37°C. The section was counterstained with DAPI. Visualize using a fluorescence microscope and filter sets appropriate for the label used.
Click image to see more details
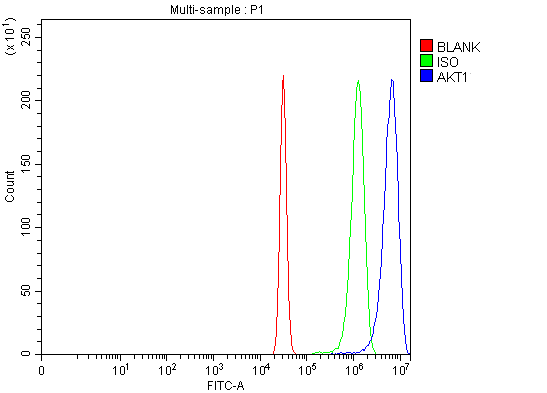
Flow Cytometry analysis of Hela cells using anti-AKT1,2,3 antibody (A00024-2).
Overlay histogram showing Hela cells stained with A00024-2 (Blue line). To facilitate intracellular staining, cells were fixed with 4% paraformaldehyde and permeabilized with permeabilization buffer. The cells were blocked with 10% normal goat serum. And then incubated with rabbit anti-AKT1,2,3 Antibody (A00024-2, 1 μg/1x106 cells) for 30 min at 20°C. DyLight®488 conjugated goat anti-rabbit IgG (BA1127, 5-10 μg/1x106 cells) was used as secondary antibody for 30 minutes at 20°C. Isotype control antibody (Green line) was rabbit IgG (1 μg/1x106) used under the same conditions. Unlabelled sample without incubation with primary antibody and secondary antibody (Red line) was used as a blank control.
Click image to see more details
HPA, RAGE and PI3K/AKT pathway correlate with AGEs-induced macrophage migration. Cells were cultured with AGEs for 24 h with or without pre-treatment with LY294002, anti-HPA or RAGE antibody for 1 h. The migration was measured by transwell assays. Results were normalized to the number of macrophages that migrated in control group. The results represent the mean of six culture wells (mean ± SEM). *p < 0.05 compared to control and #p <0.05 compared to AGEs. All of the experiments were performed independently in triplicate.
Index in PubMed under a CC BY license. PMID: 23442498
Click image to see more details
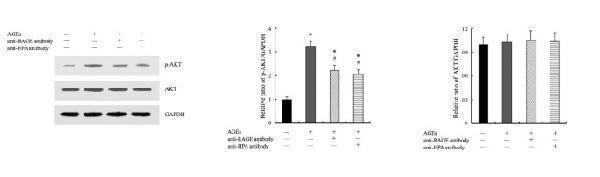
The expression of AKT protein in AGEs-induced macrophages. Cells were cultured with AGEs or pretreated with antibody against RAGE or HPA for 1 h before exposed to AGEs for 24 h. AKT and p-AKT protein expression is determined by Western blot analysis using anti-AKT and p-AKT antibody. The results represent the mean of six culture wells (mean ± SEM). * P < 0.05 compared to control and # P <0.05 compared to AGEs. All of the experiments were performed independently in triplicate.
Index in PubMed under a CC BY license. PMID: 23442498
Click image to see more details
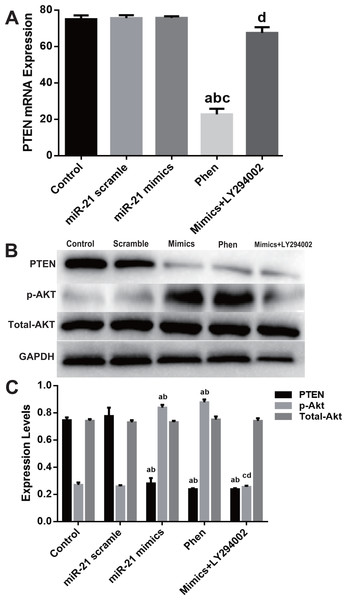
Expression change of PTEN/PI3K/Akt pathway in the process of miR-21 mimics induced proliferation in c-kit + CSCs. Cultured CSCs were treated with miR-21 mimics for 48 h before the subsequent procedures. To test the contribution of PTEN/PI3K/Akt signaling to miR-21 mimics’s pro-proliferation effects in c-kit + CSCs, PTEN and PI3K were inhibited with Phen or LY294002 respectively. (A) RT-PCR was carried out to detect miR-21 mimics’s effects on PTEN expression at the mRNA level, which showed no change between Control, miR-21 scramble, miR-21 mimics and miR-21 mimics+ LY294002 group, while Phen resulted in a significant down-regulation of PTEN compared with the other groups. (B–C) Western blot was carried out to detect miR-21 mimics’s effects on PTEN protein expression, which showed that miR-21 mimics significantly down-regulated PTEN protein in miR-21 mimics group compared with the scramble group. In addition, both Phen treatment and miR-21 mimics incubation increased p-Akt level, while PI3K inhibitor LY294002 decreased p-Akt level dramatically ( P < 0.05). a, P < 0.05 compared with Control; b, P < 0.05 compared with miR-21 scramble group; c, P < 0.05 compared with miR-21 mimics group; d, P < 0.05 compared with Phen group. n = 3 in each group. p-Akt = phosphor-Akt. Download full-size image DOI:
Index in PubMed under a CC BY license. PMID: 28168101
Click image to see more details
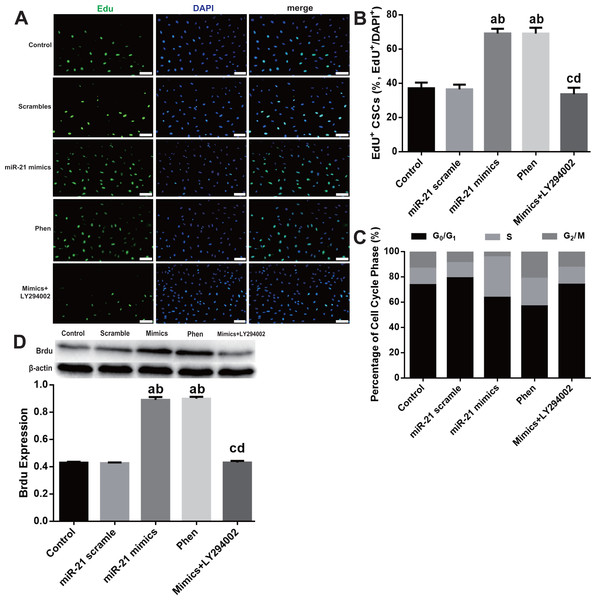
PTEN/PI3K/Akt pathway’s contribution in miR-21 induced proliferation in c-kit + CSCs. Cultured c-kit + CSCs were treated with miR-21 mimics for 48 h before subjected to EdU immunofluorescence (A–B), flow cytometry (C) or Western blot (D). To test the contribution of PTEN/PI3K/Akt signaling, PTEN and PI3K were inhibited with Phen or LY294002 respectively. (A) c-kit + CSCs were double stained by EdU (green) and DAPI (blue), and observed under a fluorescence microscope (Olympus). Bar = 50 µm. DAPI = propidium iodide. (B) The statistics of EdU positive CSCs from immunofluorescence in (A). n = 6 in each group. (C) Flow cytometry was employed to detect cell cycle profiles in CSCs underwent different treatments miR-21 mimics or Phen increased the proportion of S phase CSCs compared with Control or scramble treated groups. n = 3. (D) PTEN/PI3K/Akt pathway’s influences on BrdU expression, which was detected with immune blotting. Just like miR-21 mimics’ effect on BrdU, when PTEN was inhibited by Phen, there was notably increase of BrdU compared with Normal or Scramble group. When PI3K was inhibited by LY294002, there was notably decrease of BrdU in mimics+LY294002 group compared with mimics group in CSCs. n = 3 in each group. a, P < 0.05 compared with Control; b, P < 0.05 compared with Scramble; c, P < 0.05 compared with miR-21 mimics group; d, P < 0.05 compared with Phen group. Download full-size image DOI:
Index in PubMed under a CC BY license. PMID: 28168101
Click image to see more details
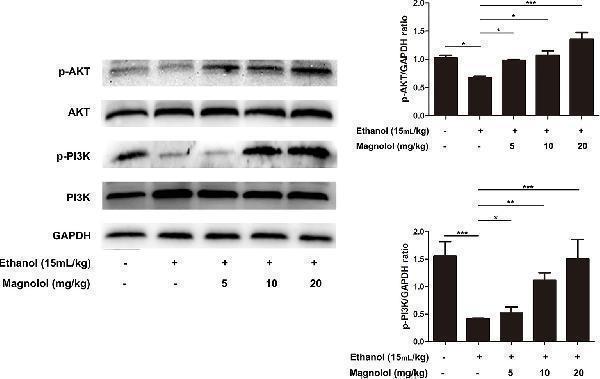
Effects of magnolol on mice alcohol-induced liver damage in the AKT/PI3K signaling pathway. Liver tissues were extracted for protein analysis by western blotting. AKT and PI3K, proteins expression were detected. The levels of AKT and PI3K were compared with GAPDH. The data were demonstrated as means ± SD. (*P < 0.05, **P < 0.01, ***P < 0.001).
Index in PubMed under a CC BY license. PMID: 31920652
Specific Publications For Anti-AKT1,2,3 Antibody Picoband® (A00024-2)
Loading publications
Recommended Resources
Here are featured tools and databases that you might find useful.
- Boster's Pathways Library
- Protein Databases
- Bioscience Research Protocol Resources
- Data Processing & Analysis Software
- Photo Editing Software
- Scientific Literature Resources
- Research Paper Management Tools
- Molecular Biology Software
- Primer Design Tools
- Bioinformatics Tools
- Phylogenetic Tree Analysis
Customer Reviews
Have you used Anti-AKT1,2,3 Antibody Picoband®?
Share your experimental results or join a short interview to earn up to $1,000 in product credits or other rewards.
1 Reviews For Anti-AKT1,2,3 Antibody Picoband®
Boster antibodies have good quality and high cost-effectiveness, and will be my preferred brand in the future.
Excellent

| SKU | A00024-2 |
|---|---|
| Application | Western Blot |
| Sample | mouse 4T1 cells |
| Sample Processing Description | normal 4T1 cells, LPS-stimulated 4T1 cells, cells treated with low, medium, or high doses of the drug, and cells treated with a positive control drug. |
| Other Reagents | RIPA lysis buffer, Protease inhibitor, Electrophoresis buffer, Transfer buffer, Blocking buffer |
| Primary Antibody | Phospho-AKT1 (S124) Rabbit Monoclonal Antibody |
| Primary Incubation | 1:2500, overnight at 4 ℃ |
| Secondary Antibody | HRP Goat Anti-Rabbit IgG |
| Secondary Incubation | 1:10000, 1 hour in room temperature |
| Detection | Substrate: ECL, Imaging system:ChemiDoc MP |
| Results Summary | With equal loading amounts, the total AKT protein levels were similar across all groups. However, the levels of phosphorylated AKT1 showed significant changes: the blank group had the lowest, the model group the highest, and in the drug-treated groups, phosphorylation levels decreased sequentially from low, medium, to high dose. The positive control group was comparable to the high-dose group. |
Bolan Guan, Harbin Medical University
Verified customer
Submitted 2025-11-28
Customer Q&As
Have a question?
Find answers in Q&As, reviews.
Can't find your answer?
Submit your question