
Click image to see more details
-

-
-
-
-
+27
Product Info Summary
| SKU: | M01072-1 |
|---|---|
| Size: | 100 μl |
| Reactive Species: | Human, Mouse, Rat |
| Host: | Rabbit |
| Application: | Flow Cytometry, IF, IHC, ICC, WB |
Customers Who Bought This Also Bought

Product info
Product Name
Anti-alpha smooth muscle Actin ACTA2 Rabbit Monoclonal Antibody
SKU/Catalog Number
M01072-1
BM3902 is an alternative SKU for this antibody, used in previous lots.
Size
100 μl
Form
Liquid
Description
Boster Bio Anti-alpha smooth muscle Actin ACTA2 Rabbit Monoclonal Antibody catalog # M01072-1. Tested in WB, IHC, ICC/IF, Flow Cytometry applications. This antibody reacts with Human, Mouse, Rat.
Storage & Handling
Store at -20°C for one year. For short term storage and frequent use, store at 4°C for up to one month. Avoid repeated freeze-thaw cycles.
Cite This Product
Anti-alpha smooth muscle Actin ACTA2 Rabbit Monoclonal Antibody (Boster Biological Technology, Pleasanton CA, USA, Catalog # M01072-1)
Host
Rabbit
Contents
Rabbit IgG in stabilizing components, phosphate buffered saline, pH 7.4, 150mM NaCl, 0.02% sodium azide and 50% glycerol.
*This antibody is supplied in a stabilized formulation.
Compatibility with conjugation reactions depends on the chemistry of the conjugation method used.
For conjugation methods that are not compatible with the stabilizing components present in this formulation, a carrier-free antibody format is required.
Clonality
Monoclonal
Clone Number
EO-1
Isotype
Rabbit IgG
Immunogen
A synthesized peptide derived from human alpha smooth muscle Actin
Reactive Species
M01072-1 is reactive to ACTA2 in Human, Mouse, Rat
Observed Molecular Weight
42 kDa
Calculated molecular weight
42.0 kDa
Antibody Validation
Boster validates all antibodies on WB, IHC, ICC, Immunofluorescence, and ELISA with known positive control and negative samples to ensure specificity and high affinity, including thorough antibody incubations.
Application & Images
Applications
M01072-1 is guaranteed for Flow Cytometry, IF, IHC, ICC, WB Boster Guarantee
Recommend Dilution
WB 1:1000-5000
IHC 1:50-200
ICC/IF 1:50-200
FC 1:20
Tested application
Suggested blocking solution with 5% non-fat milk or BSA; (*)Recommended protein loading: 20-40 µg per lane
Use TE buffer pH 9.0 for antigen retrieval; (*) citrate buffer pH 6.0 is an alternative.
Validation Images & Assay Conditions
Click image to see more details
Western blot analysis of ACTA2 using anti-ACTA2 antibody (M01072-1).
Electrophoresis was performed on a 5-20% SDS-PAGE gel at 70V (Stacking gel) / 90V (Resolving gel) for 2-3 hours. The sample well of each lane was loaded with 30 ug of sample under reducing conditions.
Lane 1: human A549 whole cell lysates,
Lane 2: human Hela whole cell lysates,
Lane 3: human 293T whole cell lysates,
Lane 4: human HepG2 whole cell lysates,
Lane 5: human Caco-2 whole cell lysates,
Lane 6: human SH-SY5Y whole cell lysates,
Lane 7: human U251 whole cell lysates,
Lane 8: human MCF-7 whole cell lysates.
After electrophoresis, proteins were transferred to a nitrocellulose membrane at 150 mA for 50-90 minutes. Blocked the membrane with 5% non-fat milk/TBS for 1.5 hour at RT. The membrane was incubated with rabbit anti-ACTA2 antigen affinity purified monoclonal antibody (Catalog # M01072-1) at 1:1000 overnight at 4°C, then washed with TBS-0.1%Tween 3 times with 5 minutes each and probed with a goat anti-rabbit IgG-HRP secondary antibody at a dilution of 1:5000 for 1.5 hour at RT. The signal is developed using an Enhanced Chemiluminescent detection (ECL) kit (Catalog # EK1002) with Tanon 5200 system. A specific band was detected for ACTA2 at approximately 42 kDa. The expected band size for ACTA2 is at 42 kDa.

Click image to see more details
Western blot analysis of ACTA2 using anti-ACTA2 antibody (M01072-1).
Electrophoresis was performed on a 5-20% SDS-PAGE gel at 70V (Stacking gel) / 90V (Resolving gel) for 2-3 hours. The sample well of each lane was loaded with 30 ug of sample under reducing conditions.
Lane 1: rat heart tissue lysates,
Lane 2: rat lung tissue lysates,
Lane 3: rat brain tissue lysates,
Lane 4: mouse heart tissue lysates,
Lane 5: mouse lung tissue lysates,
Lane 6: mouse brain tissue lysates.
After electrophoresis, proteins were transferred to a nitrocellulose membrane at 150 mA for 50-90 minutes. Blocked the membrane with 5% non-fat milk/TBS for 1.5 hour at RT. The membrane was incubated with rabbit anti-ACTA2 antigen affinity purified monoclonal antibody (Catalog # M01072-1) at 1:1000 overnight at 4°C, then washed with TBS-0.1%Tween 3 times with 5 minutes each and probed with a goat anti-rabbit IgG-HRP secondary antibody at a dilution of 1:5000 for 1.5 hour at RT. The signal is developed using an Enhanced Chemiluminescent detection (ECL) kit (Catalog # EK1002) with Tanon 5200 system. A specific band was detected for ACTA2 at approximately 42 kDa. The expected band size for ACTA2 is at 42 kDa.

Click image to see more details
Western blot analysis of ACTA2 using anti-ACTA2 antibody (M01072-1).
Electrophoresis was performed on a 5-20% SDS-PAGE gel at 70V (Stacking gel) / 90V (Resolving gel) for 2-3 hours. The sample well of each lane was loaded with 30 ug of sample under reducing conditions.
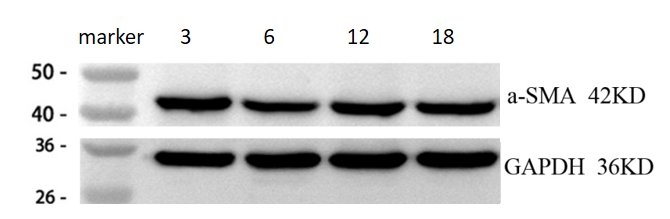
Lane 1: cardiac tissue lysayes from 3-month-old mouse,
Lane 2: cardiac tissue lysayes from 6-month-old mouse,
Lane 3: cardiac tissue lysayes from 12-month-old mouse,
Lane 4: cardiac tissue lysayes from 18-month-old mouse.
After electrophoresis, proteins were transferred to a nitrocellulose membrane at 150 mA for 50-90 minutes. Blocked the membrane with 5% non-fat milk/TBS for 1.5 hour at RT. The membrane was incubated with rabbit anti-ACTA2 antigen affinity purified monoclonal antibody (Catalog # M01072-1) at 1:2000 overnight at 4°C, then washed with TBS-0.1%Tween 3 times with 5 minutes each and probed with a goat anti-rabbit IgG-HRP secondary antibody at a dilution of 1:1000 for 1.5 hour at RT. The signal is developed using an Enhanced Chemiluminescent detection (ECL) kit (Catalog # EK1002) withChemiDoc MP system. A specific band was detected for ACTA2 at approximately 42 kDa. The expected band size for ACTA2 is at 42 kDa.

Click image to see more details
Immunohistochemical analysis of paraffin-embedded human colon, using alpha smooth muscle Actin Antibody.

Click image to see more details
(H) The protein expression of α-SMA, COL1α1, vimentin, fibronectin, E-cadherin, and HIF-1α in LX-2 cells was analyzed using western blotting.
(I) Immunofluorescence double staining of α-SMA and HIF-1α in TGF-β1-stimulated and DMSO or AZD8055-treated LX-2 cells transducted with LV-control-shRNA or LV-4EBP1-shRNA (×400 magnification).
(L and M) (L) The apoptosis of LX-2 cells determined using flow cytometry and (M) percentages of apoptotic cells (early and late apoptotic cells). NC, LV-control-shRNA; KD, LV-4EBP1-shRNA. Values are the mean ± SD (unpaired two-sample Student’s t test). ∗∗p < 0.01, ∗∗∗p < 0.001, and ∗∗∗∗p < 0.0001; ns, not significant. α-SMA, alpha-smooth muscle actin; DAPI, 4′,6-diamidino-2-phenylindole; GAPDH, glyceraldehyde-3-phosphate dehydrogenase; HIF-1α, hypoxia inducible factor 1 subunit alpha; LV, lentivirus; PI, propidium iodide; TGF-β1, transforming growth factor beta 1.
Index in iScience under a CC BY license. DOI: 10.1016/j.isci.2025.113412

Click image to see more details
(A) Illustration of AAV transduction and BDL administration in mouse models. (B) Images of H&E, Masson’s trichrome, Sirius red, and IHC of α-SMA and vimentin staining of representative liver sections (×200 magnification). (C) Representative Masson and Sirius red staining of liver tissues and positive content (%) of α-SMA. and vimentin staining (n = 5).
(D and E) Serum (D) ALT, AST, TBIL, DBIL, and (E) TGF-β1, IL-6 in each group. (F) The protein expression of α-SMA, COL1α1, vimentin, fibronectin, E-cadherin, 4EBP1, FLAG, and HIF-1α in liver tissues was analyzed using western blotting. (G) Immunofluorescence double staining of α-SMA and HIF-1α in the liver sections of mice (×100 magnification). The arrowheads represent colocalization of staining. (H) Relative quantification of α-SMA, HIF-1α, and colocalization of α-SMA and HIF-1α. EV, AAV2/8-scramble; OE, AAV2/8-4ebp1-4A-3xflag. Values are the mean ± SD (unpaired two-sample Student’s t test). ∗∗p < 0.01, ∗∗∗p < 0.001, and ∗∗∗∗p < 0.0001; ns, not significant. α-SMA, alpha-smooth muscle actin; AAV, adeno-associated virus; ALT, alanine aminotransferase; AST, aspartate aminotransferase; BDL, bile duct ligation; DAPI, 4′,6-diamidino-2-phenylindole; DBIL, direct bilirubin; GAPDH, glyceraldehyde-3-phosphate dehydrogenase; H&E, hematoxylin-eosin; HIF-1α, hypoxia inducible factor 1 subunit alpha; IL-6, Interleukin 6; TBIL, total bilirubin; TGF-β1, transforming growth factor beta 1.
Index in iScience under a CC BY license. DOI: 10.1016/j.isci.2025.113412

Click image to see more details
Immunofluorescent analysis of A431 cells, using alpha smooth muscle Actin Antibody .

Click image to see more details
(A) Illustration of adeno-associated virus,AAV transduction and CCl4 administration in mice models. (B and C) RT-qPCR analysis of 4ebp1-4A levels and (C) western blotting analysis of FLAG-tagged protein levels with saline, AAV2/8-scramble, or AAV2/8-4ebp1-4A-3xflag administration. (D) Images of H&E, Masson’s trichrome, Sirius red, and IHC of α-SMA and vimentin staining of representative liver sections (×200 magnification). (E) Representative Masson and Sirius red staining of liver tissues and positive content (%) of α-SMA. and vimentin staining (n = 5). (F and G) Serum (F) ALT, AST and (G) TGF-β1, IL-6 in each group. (H) The protein expression of α-SMA, COL1α1, vimentin, fibronectin, E-cadherin, 4EBP1, FLAG, and HIF-1α in liver tissues analyzed using western blotting. (I)Immunofluorescence double staining of α-SMA and HIF-1α in the liver sections of mice (×100 magnification). The arrow heads represent colocalization of staining.
(J) Relative quantification of α-SMA, HIF-1α, and colocalization of α-SMA and HIF-1α. EV, AAV2/8-scramble; OE, AAV2/8-4ebp1-4A-3xflag. Values are the mean ± SD (unpaired two-sample Student’s t test). ∗p < 0.05, ∗∗p < 0.01, ∗∗∗p < 0.001, and ∗∗∗∗p < 0.0001; ns, not significant. α-SMA, alpha-smooth muscle actin; AAV, adeno-associated virus; ALT, alanine aminotransferase; AST, aspartate aminotransferase; DAPI, 4′,6-diamidino-2-phenylindole; GAPDH, glyceraldehyde-3-phosphate dehydrogenase; H&E, hematoxylin and eosin; HIF-1α, hypoxia inducible factor 1 subunit alpha; IL-6, interleukin 6; RT-qPCR, quantitative reverse transcription polymerase chain reaction; TGF-β1, transforming growth factor beta 1.
Index in iScience under a CC BY license. DOI: 10.1016/j.isci.2025.113412

Click image to see more details
QG promotes ferroptosis of HSCs and inhibits HSCs activation through MARCHF8 mediated ubiquitination of GPX4. (A-C) Primary mouse HSCs were divided into control + shNC, control + shMARCHF8, QG + shNC, and QG + shMARCHF8 groups. A MFI of intracellular C-AM was determined by flow cytometry. B Lipid ROS was detected by flow cytometry. C LDH activity was detected. * P < 0.05, ** P < 0.01, *** P < 0.001. D–E TGF-β1-treated primary mouse HSCs were divided into control + shNC, control + shMARCHF8, QG + shNC, and QG + shMARCHF8 groups. D Positive expression of α-SMA was detected by immunofluorescence staining (scale bar, 40 μm). E The mRNA levels of ACTA2, LAMA1, COLlA1, and FN1 were detected by qRT-PCR. * P < 0.05, ** P < 0.01 vs shNC + Control. # P < 0.05 vs shMARCHF8 + Control Full size image
Index in PubMed under a CC BY license. PMID: 40524220

Click image to see more details
QG inhibits TGF-β1-induced HSC activation and promotes HSC death in vitro. A The positive expressions of α-SMA and desmin in liver tissues of control, QG, CCl 4 , CCl 4 + QG group mice or NCD, NCD + QG, HFHCD, HFHCD + QG group mice were detected by immunohistochemical staining (scale bar, 100 μm). B–C Primary mouse HSCs or LX-2 cells were divided into control, TGF-β1, TGF-β1 + QG-L, TGF-β1 + QG-M, and TGF-β1 + QG-H groups. B Positive expression of α-SMA was detected by immunofluorescence staining (scale bar, 40 μm). C The mRNA levels of ACTA2, LAMA1, COLlA1, and FN1 were detected by qRT-PCR. * P < 0.05, ** P < 0.01, *** P < 0.001 vs control; # P < 0.05, ## P < 0.01 vs TGF-β1. D Primary mouse HSCs or LX-2 cells were divided into control and QG groups. The LDH activity was detected. * P < 0.05 vs control Full size image
Index in PubMed under a CC BY license. PMID: 40524220

Click image to see more details
Enhanced expression of α-SMA, CTGF and Col1 by TGF-β1 . RT-qPCR revealing the enhanced transcription of α-SMA ( A ), CTGF ( B ) and Col1A1 mRNAs ( C ) in PSCs and HP-1 cells by TGF-β1 but not PDGF; Western blot showing the increased expression of α-SMA, CTGF and Col1 proteins in PSCs and HP-2 cells consistent with their mRNA expression ( D ).
Index in PubMed under a CC BY license. PMID: 31929747

Click image to see more details
Fer-1 ameliorated MCT-induced haemodynamics, RV hypertrophy and pulmonary vascular remodelling in rats. ( A ) Representative RV pressure curves in the sham, sham + Fer-1, MCT, and MCT + Fer-1 groups. The MCT + Fer-1 group was pretreated with Fer-1 (2 mg/kg/d). ( B ) Bar graph comparing RVSPs in the different groups of rats. ( C ) Fer-1 pretreatment reduced the RV/LV + S ratio of MCT-induced rats. ( D ) Representative image of haematoxylin–eosin (HE) staining showing the expression of α-SMA to compare arteriole wall thickness in the sham, sham + Fer-1, MCT, and MCT + Fer-1 pretreatment groups. ( E ) Quantification of arteriole percent medial thickness. ( F ) The percentage of muscularization is shown by staining for α-SMA. The data represent the means ± SD. # P > 0.05 versus the sham group, * P < 0.05 versus the sham group, ** P < 0.05 versus the MCT group. n = 8–12/group.
Index in PubMed under a CC BY license. PMID: 35197507

Click image to see more details
PDGFRB somatic mutation induce phenotypic modulation in SMCs. Immunostaining reveals the expression levels of smooth muscle markers (a-SMA and SM22a) and inflammatory markers (VCAM1, ICAM1, MMP1 and MMP9) in HBVSMCs transfected with different viruses (Control: vector; Wild Type: PDGFRB; Y562D: PDGFRB Y562D ) ( a ). The relative density of immunoblot bands about markers shown in ( A ) were display ( B ) (normalized to those in cells transfected with vector viruses). RT-qPCR ( C ) of SMCs markers (α-SMA and SM22α) and inflammatory markers (VCAM-1, ICAM1, MMP-9 and MMP-1) in HBVSMCs underwent different treatments. Student's t-test and Benjamini–Hochberg correction are employed to assess the statistical significance. Edu assay exhibit the proliferation ability of HBVSMCs under different treatment conditions ( D ). Statistical analysis of the proportion of Edu-positive cells in the different groups from 5 different fields of each group at × 200 magnification. Tukey's multiple comparisons test is used for statistical differences ( E ). Scratch assay displays migratory ability of HBVSMCs underwent different treatment ( F ). Statistical analysis of the rate of wound healing (reduced area at 4H /area at 0H) in the different groups from 9 different fields of each group at × 200 magnification. Tukey's multiple comparisons test is utilized to evaluate the statistical significance. * p adj < 0.05, ** p adj < 0.01, *** p adj < 0.001, **** p adj < 0.0001 ( G ). The above experiments are all repeated three times
Index in PubMed under a CC BY license. PMID: 38741091

Click image to see more details
Single-cell transcriptional profiling of intracranial fusiform aneurysmal cells ( A - K ) and multi-color immunofluorescence (mIF) of smooth muscle cells (SMCs) markers and inflammatory markers between intracranial fusiform aneurysms (IFAs) and normal cerebral arteries (NCAs) ( L - M ). T-SNE visualization of intracranial fusiform aneurysmal cells type. Colored according to cell type ( A ). Visualization of specific gene expression patterns related to cell subsets identified in ( A ) using a bubble plot ( B ). T-SNE visualization of VSMC cell clusters. Colored according to clusters ( C ). Visualization of structural protein and inflammation-related genes expression patterns within the subsets of smooth muscle cells identified in ( C ) using a bubble plot ( D ). The violin plots show the expression differences of structural protein genes and inflammatory genes between the contraction subgroup (VSMC5) and the inflammatory subgroup (VSMC6) ( E ). The volcano plot specifically shows the gene expression differences between the two cell groups ( F ). The petal plot displays the GO enrichment analysis results of differential genes between the VSMC5 and VSMC6 ( G ). The bar graph shows the KEGG enrichment analysis results of differential genes between these two cell subsets ( H ). The GSEA enrichment analysis results of differential genes between the two groups. The enrichment results of differential genes related to signaling pathways ( I ). The enrichment results of differential genes related to structural protein genes ( J ). The enrichment results of differential genes related to the process of inflammatory factor secretion ( K ). α-SMA (green, SMCs marker), MMP-9 (blue, inflammatory marker) and ICAM-1 (red, inflammatory marker) in FIAs and NCAs are detected using mIF. Scale bar, 100 μm ( L ). Statistical analysis of mean fluorescence intensity about SMCs marker (α-SMA) and inflammatory markers (ICAM-1 and MMP-9) between NCAs ( n = 4) and FIAs ( n = 5). 'n' represented the number of samples. Three random fields were selected for statistical analysis in each sample, and the average value represented the detection value of this marker in this sample. The Student's t-test is utilized to examine the statistical differences among each marker. ns, no significant; ** p < 0.01, *** p < 0.01 (M). n values indicate number of independent experiments performed
Index in PubMed under a CC BY license. PMID: 38741091

Click image to see more details
Macrophage removal alleviated succinate-induced kidney interstitial fibrosis. A F4/80 immunohistochemistry staining showed clodronate liposomes effectively removed kidney interstitial macrophages of mice. B Clodronate liposomes markedly prevented succinate-mediated upregulation of M2-related profibrotic factors in the kidney. *** P < 0.001, versus control group; &&& P < 0.001, versus succinate group, n = 10 in the control group, n = 9 in succinate group and n = 7 in clodronate liposomes group. C Masson and Sirius Red staining ( D ) revealed succinate-induced interstitial fibrosis was alleviated by clodronate liposomes. *** P < 0.001, versus control group; &&& P < 0.001, versus succinate group, n = 10 in control group, n = 9 in succinate group and n = 7 in clodronate liposomes group. E The elevation of protein levels of renal fibronectin and α-SMA was revised by clodronate liposomes. *** P < 0.001, versus control group; &&& P < 0.001, & P < 0.05, versus succinate group, n = 10 in control group, n = 9 in succinate group and n = 7 in clodronate liposomes group
Index in PubMed under a CC BY license. PMID: 38291510

Click image to see more details
Succinate induced renal interstitial fibrosis in mice. Male C57 BL/6 mice were fed with special water (containing 4% succinate) for 12w. A Masson and Sirius red. B staining showed succinate induced renal interstitial fibrosis in mice.*** P < 0.001 versus control group, n = 5. C Immunoblotting showed succinate increased renal protein levels of fibronectin and α-SMA. *** P < 0.001 versus control group, n = 5
Index in PubMed under a CC BY license. PMID: 38291510

Click image to see more details
Effects of DBT on the expression of α-SMA, FN1, p-SMAD3 and TGF-β1 in rat lung tissue. α-SMA protein expression after (A) 28 and (B) 42 days of DBT administration. FN1 protein expression after (C) 28 and (D) 42 days of DBT administration; n = 4. (E) TGF-β1 and (F) p-SMAD3, n = 5. TGF-β1 protein expression after (G) 28 and (H) 42 days of DBT administration; n = 4 (G, H) , * P < 0.05 or ** P < 0.01; N.S. , not statistically significant, compared with the silica group.
Index in PubMed under a CC BY license. PMID: 40206091

Click image to see more details
Overexpression of TRIB3 activates lung fibroblasts. (A) Representative images and quantification of the invasion experiment results for mouse lung fibroblasts with or without TRIB3 overexpression. Scale bars, 100 μm. (B) mRNA expression of fibrosis genes in mouse lung fibroblasts with or without TRIB3 overexpression. (C) Representative images and quantification of α-SMA immunostaining in mouse lung fibroblasts with or without TRIB3 overexpression. Scale bars, 50 μm. Data are representative of 3 independent experiments. Data represent means ± SEM Statistical significance: * p < 0.05, ** p < 0.01 or *** p < 0.001.
Index in PubMed under a CC BY license. PMID: 35668944

Click image to see more details
Conditioned medium of macrophages following succinate treatment triggered renal fibroblast proliferation and activation. 500 μM succinate was used to stimulate RAW 264.7 cells for 48 h, and the conditioned medium was collected, centrifuged, and incubated with NRK-49F. A The results of the CCK8 assay and EdU staining displayed that the conditioned medium of the succinate group enhanced NRK-49F proliferation. *** P < 0.001, versus control group, n = 6 in CCK8 and n = 3 in EdU staining, biologically repeated 3 times. B Protein levels of fibronectin and α-SMA were increased by the conditioned medium of the succinate group. *** P < 0.001, versus control group, n = 3, biologically repeated 3 times
Index in PubMed under a CC BY license. PMID: 38291510

Click image to see more details
Key characteristics of the immortalized HP-1 human PSC cell line. Phase contrast microscopy in HP-1 cells after seeding for 12 h ( A ); Double-immunofluorescence labelling using antibodies for SV40 antigen and GFAP, green, localization of SV40 antigen, red, localization of GFAP (B); Immunofluorescence showing the presence of α-SMA ( C ); Double-immunofluorescence labelling for vimentin and desmin. Green, localization of vimentin (D), red, localization of desmin (E), yellow, colocalization of vimentin and desmin (F). (Original magnification × 200 in A ; × 400 in B-F ).
Index in PubMed under a CC BY license. PMID: 31929747

Click image to see more details
SUCNR1 was required for the effects of succinate on M2 polarization, upregulation of profibrotic factors, and paracrine actions on fibroblasts. RAW 264.7 was transfected with SUCNR1 siRNA for 36 h, and 500 μM succinate was stimulated for 24 h. A SUCNR1 mRNA levels were significantly reduced by SUCNR1 siRNA. &&& P < 0.001, versus succinate group, n = 3, biologically repeated 3 times. B Knockdown of SUCNR1 inhibited the downregulation of proinflammatory M1 cytokines (iNOS and IL6) and upregulation of anti-inflammatory M2 cytokines (Arg1, Fizz1, Mgl2, IL10) ( C ) induced by succinate. *** P < 0.001, versus the control group, &&& P < 0.001, versus the succinate group, n = 3, biologically repeated 3 times. D The elevated profibrotic factors were also restored by SUCNR1 siRNA. *** P < 0.001, versus the control group, &&& P < 0.001, versus the succinate group, n = 3, biologically repeated 3 times. E The proliferative effects of the conditioned medium in the succinate group were abolished by SUCNR1 siRNA. *** P < 0.001, versus the control group, &&& P < 0.001, versus the succinate group, n = 6, biologically repeated 3 times. F The enhanced protein expressions of fibronectin and α-SMA were reduced by SUCNR1 siRNA. *** P < 0.001, versus the control group, &&& P < 0.001, versus the succinate group, n = 3, biologically repeated 3 times
Index in PubMed under a CC BY license. PMID: 38291510

Click image to see more details
GRP78 is upregulated in hypoxic rat PASMCs. A. The purity of PASMCs was identified by αSMA immunofluorescence staining (magnification, × 200). B. GRP78 protein expression in PASMCs treated with different oxygen concentrations. C. GRP78 protein expression in PASMCs treated with the indicated times of hypoxia. D. Immunofluorescence staining of GRP78 visually verified ERS changes under hypoxia and normoxia. Data are shown as the mean ± SEM; n = 3. *P < 0.05, **P < 0.01. *compared with the normoxia group or 0 h time point; 0 h was considered to be a control point, which was compared with all of the other time points.
Index in PubMed under a CC BY license. PMID: 30899368

Click image to see more details
CTGF neutralizing antibody inhibited the stimulation of fibroblasts by macrophage-conditioned medium. A CTGF antibody prevented the proliferative effects of CM on NRK-49F, indicated by the results of the CCK8 assay. *** P < 0.001, versus control group, n = 6 in CCK8, biologically repeated 3 times. B Also, the CTGF antibody suppressed the activation effects of CM on NRK-49F, as indicated by the results of the protein quantitative analysis of fibronectin and α-SMA. *** P < 0.001, versus control group, &&& P < 0.001, versus the succinate group, n = 3, biologically repeated 3 times
Index in PubMed under a CC BY license. PMID: 38291510

Click image to see more details
QG promotes ferroptosis of HSCs and inhibits HSC activation in vitro. A, B Primary mouse HSCs or Hpys were divided into control and QG groups. A MFI of intracellular C-AM was determined by flow cytometry. B Lipid ROS were detected by flow cytometry. ** P < 0.01 vs control. C Primary mouse HSCs were divided into control, QG, QG + Fer-1, QG + zVAD, and QG + Nec-1 groups. LDH activity was detected. ** P < 0.01 vs control or QG. D–F Mouse primary HSCs were divided into control, TGF-β1, TGF-β1 + QG, and TGF-β1 + QG + Fer-1 groups. The QG-induced ferroptosis was confirmed by utilizing FerroOrange staining ( D ) and BODIPY C11 staining ( E ). F The mRNA levels of ACTA2, LAMA1, COLlA1 and FN1 were detected by qRT-PCR. ** P < 0.01, *** P < 0.001 vs control; ## P < 0.01, ### P < 0.001 vs TGF-β1; & P < 0.05 vs TGF-β1 + QG Full size image
Index in PubMed under a CC BY license. PMID: 40524220

Click image to see more details
TRAF6 expression in lung fibroblasts is negatively correlated with PF progression. (A) Western blot analysis of TRAF6 expression in the lungs of mice following BLM induction. (B) Correlation analysis between TRAF6 expression in the lungs of PF mice and respiratory system compliance (Crs) in mice. Each point represents the value of one mouse. Spearman’s rank correlation test was employed to determine statistical significance. (C) Correlation analysis between TRAF6 expression and Acta2 expression in the lungs of PF mice. Each point represents the value of one mouse. Spearman’s rank correlation test was employed to determine statistical significance. (D) Western blot analysis of TRAF6 expression in lung fibroblasts isolated from the lungs of mice following BLM induction. (E) Masson staining was performed to evaluate fibrotic changes in the indicated mice (Group 1: BLM + Lenti-Ctrl, Group 2: BLM + Lenti-Traf6; n = 5 per group). Scale bars, 100 μm. Crs (F) and hydroxyproline content in the right lung (G) were assessed to evaluate pulmonary fibrosis and lung function (Group 1: BLM + Lenti-Ctrl, Group 2: BLM + Lenti-Traf6; n = 5 per group). Data are representative of 3 independent experiments. Data represent means ± SEM Statistical significance: * p < 0.05 or ** p < 0.01.
Index in PubMed under a CC BY license. PMID: 35668944

Click image to see more details
(A) Images of H&E, Masson’s trichrome, Sirius red, and immunohistochemistry of α-SMA, vimentin, and p-4EBP1 staining of representative liver sections (×200 magnification). (B) Representative Masson and Sirius red staining of liver tissues and positive content (%) of α-SMA, vimentin, and p-4EBP1 staining (n = 5). (C) The protein expression of α-SMA, COL1α1, vimentin, p-4EBP1, and 4EBP1 in liver tissues was analyzed using western blotting. (D) The protein expression of α-SMA, vimentin, p-4EBP1, and 4EBP1 in TGF-β1-activated LX-2 cells for 0, 6, 12, 24, and 48 h. (E and F) Immunofluorescence double staining of α-SMA and p-4EBP1 in TGF-β1-stimulated LX-2 cells for 0, 6, 12, 24, and 48 h (×400 magnification). Values are the mean ± SD (unpaired two-sample Student’s t test). ∗p < 0.05, ∗∗p < 0.01, ∗∗∗p < 0.001, and ∗∗∗∗p < 0.0001. α-SMA, alpha-smooth muscle actin; BDL, bile duct ligation; DAPI, 4′,6-diamidino-2-phenylindole; GAPDH, glyceraldehyde-3-phosphate dehydrogenase; H&E, hematoxylin and eosin; TGF-β1, transforming growth factor β1.
Index in iScience under a CC BY license. DOI: 10.1016/j.isci.2025.113412

Click image to see more details
(H) Relative quantification of α-SMA, cleaved caspase-3, and colocalization of α-SMA and cleaved caspase-3. EV, AAV2/8-scramble; OE, AAV2/8-4ebp1-4A-3xflag. Values are the mean ± SD (unpaired two-sample Student’s t test). ∗∗p < 0.01, ∗∗∗p < 0.001, and ∗∗∗∗p < 0.0001. α-SMA, alpha-smooth muscle actin; AAV, adeno-associated virus; BDL, bile duct ligation; BP, biological process; CC, cellular component; DAPI, 4′,6-diamidino-2-phenylindole; ECM, extracellular matrix; LV, lentivirus; MF, molecular function.
Index in iScience under a CC BY license. DOI: 10.1016/j.isci.2025.113412

Click image to see more details
Overexpression of TRAF6 suppresses fibroblast activation. (A) IHC staining showing the expression of α-SMA in lung tissues. Representative data and quantified results are shown (Group 1: BLM + Lenti- Ctrl , Group 2: BLM + Lenti- Traf6 ; n = 5 per group). Scale bar, 100 μm. (B) mRNA expression of fibrosis genes in mouse PF lung fibroblasts with or without TRAF6 overexpression. (C) Representative images and quantification of the invasion experiment results for mouse PF lung fibroblasts with or without TRAF6 overexpression. Scale bars, 100 μm. (D) Representative images and quantification of α-SMA immunostaining in mouse PF fibroblasts with or without TRAF6 overexpression. Scale bars, 50 μm. Data are representative of 3 independent experiments. Data represent means ± SEM Statistical significance: * p < 0.05, ** p < 0.01 or *** p < 0.001.
Index in PubMed under a CC BY license. PMID: 35668944

Click image to see more details
(I) The protein expression of α-SMA, COL1α1, vimentin, fibronectin, E-cadherin, 4EBP1, FLAG, and HIF-1α in LX-2 cells analyzed using western blotting.
(J) Immunofluorescence double staining of α-SMA and HIF-1α in vehicle or TGF-β1-stimulated LX-2 cells transducted with LV-empty or LV-4EBP1-4A-3xflag (×400 magnification).
(M and N) (M) The apoptosis of vehicle or TGF-β1-stimulated LX-2 cells transducted with LV-empty or LV-4EBP1-4A-3xflag determined using flow cytometry and (N) percentages of apoptotic cells (early and late apoptotic cells). EV, LV-empty; OE, LV-4EBP1-4A-3xflag. Values are the mean ± SD (unpaired two-sample Student’s t test). ∗p < 0.05, ∗∗p < 0.01, ∗∗∗p < 0.001, and ∗∗∗∗p < 0.0001; ns, not significant. α-SMA, alpha-smooth muscle actin; DAPI, 4′,6-diamidino-2-phenylindole; GAPDH, glyceraldehyde-3-phosphate dehydrogenase; HIF-1α, hypoxia inducible factor 1 subunit alpha; LV, lentivirus; PI, propidium iodide; RT-qPCR, quantitative reverse transcription polymerase chain reaction; TGF-β1, transforming growth factor beta 1.
Index in iScience under a CC BY license. DOI: 10.1016/j.isci.2025.113412

Click image to see more details
Therapeutic potentials of Pg-Fe-hMSC in both monocellular and multicellular humanized fibrotic models. a Schematic illustration and representative image of EpCAM immunostaining in primary human lung epithelial cells (hLECs). Scale bar, 50 μm. b Mitochondrial transfer rates from the indicated hMSC to the primary hLEC ( n = 3 biologically independent cells). c Relative intracellular ROS levels ( n = 3 biologically independent cells), d TGF- β expression levels ( n = 4 biologically independent cells), and e Viability of BLM-treated hLEC after the indicated treatment using different engineered hMSCs ( n = 3 biologically independent cells). f Schematic illustration showing the preparation of the 3D multicellular human fibrotic model. g Representative immunostaining images showing the expression of α -smooth muscle actin ( α -SMA), vimentin, collagen-I, and Ki-67 in the healthy and fibrotic multicellular human spheroid models. Blue fluorescent signals indicate the cell nuclei and green signals indicate the biomarkers. Scale bar, 20 μm. h Mitochondrial transfer rates of different engineered hMSC in fibrotic human lung spheroids ( n = 3 biologically independent experiments). i Relative intracellular ROS levels ( n = 3 biologically independent experiments) and j TGF- β expression levels of fibrotic human lung spheroids after the indicated treatment using different engineered hMSCs ( n = 4 biologically independent experiments). k Viability of fibrotic human lung spheroids after the indicated treatment using different engineered hMSCs ( n = 3 biologically independent experiments). Data are presented as means ± SD. Statistical significance was analyzed using ordinary one-way ANOVA. ECs epithelial cells.
Index in PubMed under a CC BY license. PMID: 37723135

Click image to see more details
TRIB3 activates lung fibroblasts by reducing TRAF6 expression. (A) Transwell assay for the evaluation of invasion of TRIB3-silenced PF lung fibroblasts with or without TRAF6 knockdown. (B) mRNA expression of fibrosis genes in TRIB3-silenced PF lung fibroblasts with or without TRAF6 knockdown. (C) Representative images of α-SMA immunostaining in TRIB3-silenced PF lung fibroblasts with or without TRAF6 knockdown. Scale bars, 50 μm. (D) mRNA expression of Wnt3a in TRIB3-silenced PF lung fibroblasts with or without TRAF6 knockdown. (E) mRNA expression of the β-catenin target genes in TRIB3-silenced PF lung fibroblasts with or without TRAF6 knockdown. (F) Wnt-reporter luciferase activity in TRIB3-silenced PF lung fibroblasts with or without TRAF6 knockdown. Data are representative of 3 independent experiments. Data represent means ± SEM Statistical significance: * p < 0.05, ** p < 0.01 or *** p < 0.001.
Index in PubMed under a CC BY license. PMID: 35668944
Specific Publications For Anti-alpha smooth muscle Actin ACTA2 Rabbit Monoclonal Antibody (M01072-1)
Loading publications
Recommended Resources
Here are featured tools and databases that you might find useful.
- Boster's Pathways Library
- Protein Databases
- Bioscience Research Protocol Resources
- Data Processing & Analysis Software
- Photo Editing Software
- Scientific Literature Resources
- Research Paper Management Tools
- Molecular Biology Software
- Primer Design Tools
- Bioinformatics Tools
- Phylogenetic Tree Analysis
Customer Reviews
Have you used Anti-alpha smooth muscle Actin ACTA2 Rabbit Monoclonal Antibody?
Share your experimental results or join a short interview to earn up to $1,000 in product credits or other rewards.
1 Reviews For Anti-alpha smooth muscle Actin ACTA2 Rabbit Monoclonal Antibody
The Anti-α-SMA antibody (Cat# BM3902) shows clear and specific bands with low background in WB analysis of mouse heart tissues across different ages, with results consistent with expected trends.
Excellent
| SKU | M01072-1 |
|---|---|
| Application | Western Blot |
| Sample | mouse cardiac tissue |
| Sample Processing Description | Mouse cardiac tissues were collected from 3-, 6-, 12-, and 18-month-old mice, and total protein was extracted. |
| Other Reagents | RIPA lysis buffer, Protease inhibitor, Running buffer, Transfer buffer, Blocking buffer |
| Primary Antibody | alpha smooth muscle Actin ACTA2 Rabbit Monoclonal Antibody |
| Primary Incubation | 1:2000, overnight at 4 ℃ |
| Secondary Antibody | HRP Conjugated AffiniPure Goat Anti-Rabbit IgG (H+L) (BA1054) |
| Secondary Incubation | 1:10000, 1 h at RT |
| Detection |
Substrate: ECL substrate Imaging system: ChemiDoc MP |
| Results Summary | This experiment aimed to investigate the changes in α-SMA expression in mouse cardiac tissues from 3-, 6-, 12-, and 18-month-old mice (representing young, middle-aged, and aged stages). The results show that α-SMA levels are generally similar across different ages, with a slight but not significant increase as age progresses. |
Huanping Qian, Ningxia Medical University
Verified customer
Submitted 2026-03-24
Customer Q&As
Have a question?
Find answers in Q&As, reviews.
Can't find your answer?
Submit your question
