Click image to see more details
-

-
-
-
-
+19
Product Info Summary
| SKU: | A00542 |
|---|---|
| Size: | 100 μg/vial |
| Reactive Species: | Human, Mouse, Rat |
| Host: | Rabbit |
| Application: | ELISA, Flow Cytometry, IF, ICC, WB |
Customers Who Bought This Also Bought

Product info
Product Name
Anti-Androgen Receptor/AR Antibody Picoband®
SKU/Catalog Number
A00542
Size
100 μg/vial
Form
Lyophilized
Description
Boster Bio Anti-Androgen Receptor/AR Antibody Picoband® catalog # A00542. Tested in ELISA, Flow Cytometry, IF, ICC, WB applications. This antibody reacts with Human, Mouse, Rat. The brand Picoband indicates this is a premium antibody that guarantees superior quality, high affinity, and strong signals with minimal background in Western blot applications. Only our best-performing antibodies are designated as Picoband, ensuring unmatched performance.
Storage & Handling
Store at -20˚C for one year from date of receipt. After reconstitution, at 4˚C for one month. It can also be aliquotted and stored frozen at -20˚C for six months. Avoid repeated freeze-thaw cycles.
Cite This Product
Anti-Androgen Receptor/AR Antibody Picoband® (Boster Biological Technology, Pleasanton CA, USA, Catalog # A00542)
Host
Rabbit
Contents
Each vial contains 4mg Trehalose, 0.9mg NaCl, 0.2mg Na2HPO4, 0.05mg NaN3.
Clonality
Polyclonal
Isotype
Rabbit IgG
Immunogen
E.coli-derived human Androgen Receptor/AR recombinant protein (Position: A629-Q920).
Cross-reactivity
No cross-reactivity with other proteins.
Reactive Species
A00542 is reactive to AR in Human, Mouse, Rat
Observed Molecular Weight
120 kDa
Calculated molecular weight
99.2 kDa
Background of AR
The AR (androgen receptor) gene is more than 90 kb long and codes for a protein that has 3 major functional domains: the N-terminal domain, DNA-binding domain, and androgen-binding domain. The AR gene is mapped to Xq12. The protein functions as a steroid-hormone activated transcription factor. Upon binding the hormone ligand, the receptor dissociates from accessory proteins, translocates into the nucleus, dimerizes, and then stimulates transcription of androgen responsive genes. This gene contains 2 polymorphic trinucleotide repeat segments that encode polyglutamine and polyglycine tracts in the N-terminal transactivation domain of its protein. Expansion of the polyglutamine tract causes spinal bulbar muscular atrophy (Kennedy disease). Mutations in this gene are also associated with complete androgen insensitivity (CAIS). Two alternatively spliced variants encoding distinct isoforms have been described.
Antibody Validation
Boster validates all antibodies on WB, IHC, ICC, Immunofluorescence, and ELISA with known positive control and negative samples to ensure specificity and high affinity, including thorough antibody incubations.
Application & Images
Applications
A00542 is guaranteed for ELISA, Flow Cytometry, IF, ICC, WB Boster Guarantee
Recommend Dilution
| Application | Dilution | Species |
|---|---|---|
| Western blot | 0.1-0.25μg/ml | Human |
| Immunocytochemistry/Immunofluorescence | 5μg/ml | Human |
| Flow Cytometry (Fixed) | 1-3μg/1x106 cells | Human, Mouse, Rat |
| ELISA | 0.1-0.5μg/ml | - |
Tested application
Suggested blocking solution with 5% non-fat milk or BSA; (*)Recommended protein loading: 20-40 µg per lane
Validation Images & Assay Conditions
Click image to see more details
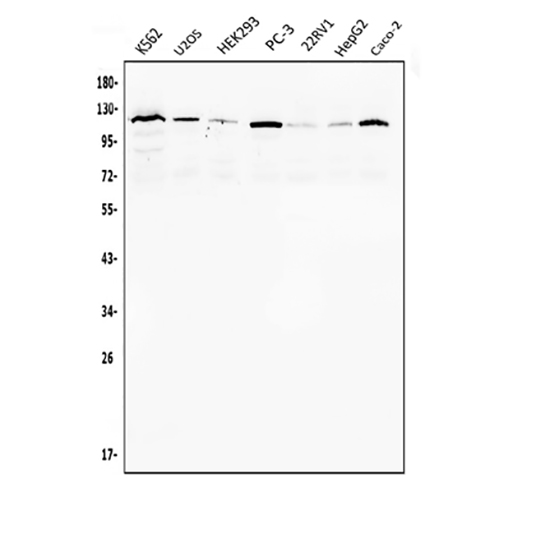
Western blot analysis of Androgen Receptor/AR using anti-Androgen Receptor/AR antibody (A00542).
Electrophoresis was performed on a 5-20% SDS-PAGE gel at 70V (Stacking gel) / 90V (Resolving gel) for 2-3 hours. The sample well of each lane was loaded with 50ug of sample under reducing conditions.
Lane 1: human K562 whole cell lysates,
Lane 2: human U20S whole cell lysates,
Lane 3: human HEK293 whole cell lysates,
Lane 4: human PC-3 whole cell lysates,
Lane 5: human 22RV1 whole cell lysates,
Lane 6: human HepG2 whole cell lysates,
Lane 7: human CACO-2 whole cell lysates.
After Electrophoresis, proteins were transferred to a Nitrocellulose membrane at 150mA for 50-90 minutes. Blocked the membrane with 5% Non-fat Milk/ TBS for 1.5 hour at RT. The membrane was incubated with rabbit anti-Androgen Receptor/AR antigen affinity purified polyclonal antibody (Catalog # A00542) at 0.25 μg/mL overnight at 4°C, then washed with TBS-0.1%Tween 3 times with 5 minutes each and probed with a goat anti-rabbit IgG-HRP secondary antibody at a dilution of 1:5000 for 1.5 hour at RT. The signal is developed using an Enhanced Chemiluminescent detection (ECL) kit (Catalog # EK1002) with Tanon 5200 system. A specific band was detected for Androgen Receptor/AR at approximately 120KD. The expected band size for Androgen Receptor/AR is at 120KD.

Click image to see more details
Immuno-expression of AR (A:3.5yr.) and ERβ (B: 0.1yr., C: 3.5yr.
and D: 8yr.) in testes. Scale bar = 50 μm.
Index in PubMed under a CC BY license. PMID: 31966281

Click image to see more details
Immunohistochemical analysis of dorsolateral prostate E-cadherin, Vimtein, ERα and AR expression in aged rats. The expression of vimentin, ERα and AR increased, and the expression of E-cadherin decreased in BPA-treated groups. ( a – p ) Representative sections of comparable regions are shown for vehicle control rats ( a , e , i , m ), and animals exposed to BPA (10 μg/kg/day) ( b , f , j , n ), BPA (30 μg /kg/day) ( c , g , k , o ), and BPA (90 μg/kg/day) ( d , h , l , p ) (scale bar: 50 μm, ×400). BPA: bisphenol A; AR: androgen receptor; ERα:estrogen receptor-α.
Index in PubMed under a CC BY license. PMID: 29323181

Click image to see more details
IF analysis of Androgen Receptor/AR using anti-Androgen Receptor/AR antibody (A00542).
Androgen Receptor/AR was detected in immunocytochemical section of T47D cells. Enzyme antigen retrieval was performed using IHC enzyme antigen retrieval reagent (AR0022) for 15 mins. The cells were blocked with 10% goat serum. And then incubated with 5μg/mL rabbit anti-Androgen Receptor/AR Antibody (A00542) overnight at 4°C. DyLight®488 Conjugated Goat Anti-Rabbit IgG (BA1127) was used as secondary antibody at 1:100 dilution and incubated for 30 minutes at 37°C. The section was counterstained with DAPI. Visualize using a fluorescence microscope and filter sets appropriate for the label used.

Click image to see more details
Immunohistochemical analysis of PCNA in DLP. Representative sections of comparable regions were shown for vehicle control rats ( a ), and animals exposed to BPA (10 μg/kg/day) ( b ), BPA (30 μg/kg/day) ( c ), and BPA (90 μg/kg/day), ( d ) (scale bar: 20 μm, ×400).
Index in PubMed under a CC BY license. PMID: 29323181

Click image to see more details
Flow Cytometry analysis of A549 cells using anti-Androgen Receptor/AR antibody (A00542).
Overlay histogram showing A549 cells stained with A00542 (Blue line).To facilitate intracellular staining, cells were fixed with 4% paraformaldehyde and permeabilized with permeabilization buffer. The cells were blocked with 10% normal goat serum. And then incubated with rabbit anti-Androgen Receptor/AR Antibody (A00542, 1μg/1x106 cells) for 30 min at 20°C. DyLight®488 conjugated goat anti-rabbit IgG (BA1127, 5-10μg/1x106 cells) was used as secondary antibody for 30 minutes at 20°C. Isotype control antibody (Green line) was rabbit IgG (1μg/1x106) used under the same conditions. Unlabelled sample without incubation with primary antibody and secondary antibody (Red line) was used as a blank control.

Click image to see more details
Flow Cytometry analysis of C6 cells using anti-Androgen Receptor/AR antibody (A00542).
Overlay histogram showing C6 cells stained with A00542 (Blue line).To facilitate intracellular staining, cells were fixed with 4% paraformaldehyde and permeabilized with permeabilization buffer. The cells were blocked with 10% normal goat serum. And then incubated with rabbit anti-Androgen Receptor/AR Antibody (A00542, 1μg/1x106 cells) for 30 min at 20°C. DyLight®488 conjugated goat anti-rabbit IgG (BA1127, 5-10μg/1x106 cells) was used as secondary antibody for 30 minutes at 20°C. Isotype control antibody (Green line) was rabbit IgG (1μg/1x106) used under the same conditions. Unlabelled sample without incubation with primary antibody and secondary antibody (Red line) was used as a blank control.

Click image to see more details
Flow Cytometry analysis of RAW264.7 cells using anti-Androgen Receptor/AR antibody (A00542).
Overlay histogram showing RAW264.7 cells stained with A00542 (Blue line).To facilitate intracellular staining, cells were fixed with 4% paraformaldehyde and permeabilized with permeabilization buffer. The cells were blocked with 10% normal goat serum. And then incubated with rabbit anti-Androgen Receptor/AR Antibody (A00542, 1μg/1x106 cells) for 30 min at 20°C. DyLight®488 conjugated goat anti-rabbit IgG (BA1127, 5-10μg/1x106 cells) was used as secondary antibody for 30 minutes at 20°C. Isotype control antibody (Green line) was rabbit IgG (1μg/1x106) used under the same conditions. Unlabelled sample without incubation with primary antibody and secondary antibody (Red line) was used as a blank control.

Click image to see more details
Immunoexpression of testosterone (A: 0.1yr, B: 3.5yr and C: 8yr)
and estradiol (D: 0.1yr, E: 3.5yr and F: 8yr) in testes from birth to adulthood. Upper
insert on panel A: negative control. Black arrows represent spermatozoa. Scale bar =
50 μm.
Index in PubMed under a CC BY license. PMID: 31966281

Click image to see more details
Sirtuin 6 plays a key role in AR-induced mitochondrial dysfunction and tubular cell apoptosis in vitro. A – D Representative western blot ( A ) and graphical representations of ( B ) Bax, ( C ) cleaved caspase-3 and ( D ) PGC-1α protein expression levels are shown. * P < 0.05, ** P < 0.01 versus control group ( n = 3); † P < 0.05, ††† P < 0.001 versus STS group ( n = 3). HKC-8 were treated with STS (1 μMol/L) alone or co-treated with DHT (10 μMol/L) for 10 h. E , F TUNEL assay ( E ) and quantitative data ( F ) showed the degree of cellular apoptosis in different groups, as indicated. Frozen kidney sections were stained by TUNEL staining. Arrows indicate positive staining. Scale bar, 75 μm. *** P < 0.001 versus control group ( n = 3); ††† P < 0.001 versus STS group ( n = 3). G – L Representative western blot ( G ) and graphical representations of ( H ) FAS-L, ( I ) Bax, ( J ) cleaved caspase-3, ( K ) Sirtuin 6 and ( L ) PGC-1α protein expression levels are shown. HKC-8 is transfected with control-shRNA or AR-shRNA before H/R injury. * P < 0.05, ** P < 0.01, *** P < 0.001 versus control-shRNA group ( n = 3); † P < 0.05, †† P < 0.01, ††† P < 0.001 versus control-shRNA/H/R group ( n = 3). M – P Representative western blot ( M ) and graphical representations of ( N ) Bax, ( O ) cleaved caspase-3 and ( P ) PGC-1α protein expression levels are shown. HKC-8 cells were transfected with Sirtuin 6 overexpression plasmid and treated with STS (1 μMol/L) or co-treated with DHT (10 μMol/L) for 6 h. * P < 0.05, ** P < 0.01 ( n = 3); †† P < 0.01, ††† P < 0.001 ( n = 3). Q Androgen binds to the AR in cytoplasm, contributing to the translocation of AR from the cytoplasm into cell nucleus. The AR binds to Sirtuin 6 promoter and deregulates Sirtuin 6 expression. The decreased expression of Sirtuin 6 leads to decreased deacetylation of PGC-1α, contributing to decreased transcriptional activity of PGC-1α. It results in downregulation of mitochondrial biogenesis relative genes, such as TFAM, contributing to the imbalance of mitochondrial homeostasis, which further results in renal TECs apoptosis after AKI.
Index in PubMed under a CC BY license. PMID: 37185276

Click image to see more details
( a ) Effect on height of dorsolateral prostatic epithelium. After aged rats were treated with 10–90 μg/kg BPA for 3 months, BPA significantly increased the height of DLP epithelium in a dose-dependent way, * P < 0.01, compared with the vehicle controls. BPA: bisphenol A. ( b ) The expression of the PCNA in DLP. The expression of PCNA was increased obviously in BPA-treated groups. * P < 0.05: compared with the vehicle controls; * P < 0.01, compared with the vehicle controls. BPA: bisphenol A.
Index in PubMed under a CC BY license. PMID: 29323181

Click image to see more details
Effects of BPA on E 2 , T, and Insulin serum levels in aged male rats. After aged rats were treated with 10–90 μg/kg BPA for 3 months, 90 μg/kg BPA significantly increased the E 2 level and the estrogen to androgen ratio; BPA had the trend of decreasing the T level and increasing the insulin level. p < 0.05, compared with the vehicle controls. BPA: bisphenol A.
Index in PubMed under a CC BY license. PMID: 29323181

Click image to see more details
The ectopic knockdown of AR ameliorates renal injury and mitochondrial dysfunction upon IRI. A Experimental design. Green arrow showed the injection of control-shRNA (pLVX-shRNA) or AR-shRNA (pLVX-shAR) plasmid. Male mice were subjected to IRI or sham respectively, and euthanized 24 h after IRI. B Scr levels in three groups, as indicated. Scr was expressed as milligrams per deciliter. ** P < 0.01 versus sham controls ( n = 5); †† P < 0.01 versus control-shRNA group ( n = 5). C BUN levels in three groups, as indicated. BUN was expressed as milligrams per deciliter. ** P < 0.01 versus sham controls ( n = 5); † P < 0.05 versus control-shRNA group ( n = 5). D , E Representative western blot ( D ) and graphical representations of ( E ) AR protein expression levels are shown. *** P < 0.001 versus sham controls ( n = 5); †† P < 0.01 versus control-shRNA group ( n = 5). F , G Representative western blot ( F ) and graphical representations of ( G ) Sirtuin 6 protein expression levels are shown. ** P < 0.01 versus sham controls ( n = 5); †† P < 0.01 versus control-shRNA group ( n = 5). H Representative micrographs showing the expression of Sirtuin 6 in different groups. Paraffin sections were stained with an antibody against Sirtuin 6. Arrows indicate positive staining. Scale bar, 50 μm. I Representative micrographs show renal tubular morphologic injury, the expression of KIM-1 and caspase-3, and TUNEL assay in different groups, as indicated. Paraffin sections were subjected to PAS staining, stained with an antibody against KIM-1 and caspase-3. Frozen kidney sections were subjected to TUNEL staining. Arrows indicate positive staining. Scale bar, 50 μm. (J – N) Representative western blot ( J ) and graphical representations of ( K ) KIM-1, ( L ) FAS-L, ( M ) Bax and ( N ) cleaved caspase-3 protein expression levels are shown. ** P < 0.01, *** P < 0.001 versus sham controls ( n = 5); †† P < 0.01, ††† P < 0.001 versus control-shRNA group ( n = 5). O Tubular injury scores depending on PAS staining in three groups, as indicated. *** P < 0.001 versus sham controls ( n = 5); ††† P < 0.001 versus control-shRNA group ( n = 5). P Representative micrographs showing the expression of PGC-1α and TOMM20 in different groups, as indicated. Frozen kidney sections were stained with an antibody against PGC-1α and TOMM20. Arrows indicate positive staining. Scale bar, 50 μm. Q – S Representative western blot ( Q ) and graphical representations of ( R ) PGC-1α and ( S ) TOMM20 protein expression levels are shown. *** P < 0.001 versus sham controls ( n = 5); ††† P < 0.001 versus control-shRNA group ( n = 5).
Index in PubMed under a CC BY license. PMID: 37185276

Click image to see more details
The ectopic expression of Sirtuin 6 relieves renal injury and mitochondrial dysfunction upon IRI. A Experimental design. Green arrow showed the injection of pcDNA plasmid or pFlag-Sirtuin 6 overexpression plasmid. Male mice were subjected to IRI or sham respectively, and euthanized 24 h after IRI. B Scr levels in three groups, as indicated. Scr was expressed as milligrams per deciliter. *** P < 0.001 versus sham controls ( n = 5); †† P < 0.01 versus pcDNA group ( n = 5). C Representative western blot of flag tag is shown. D Representative micrographs showing the expression of PGC-1α and TOMM20 in different groups, as indicated. Frozen kidney sections were stained with an antibody against PGC-1α and TOMM20. Arrows indicate positive staining. Scale bar, 50 μm. E – G Representative western blot ( E ) and graphical representations of ( F ) PGC-1α and ( G ) TOMM20 protein expression levels are shown. * P < 0.05 versus sham controls ( n = 5); †† P < 0.01, ††† P < 0.001 versus pcDNA group ( n = 5). H Representative micrographs show renal tubular morphologic injury, the expression of KIM-1 and caspase-3, and TUNEL assay in different groups, as indicated. Paraffin sections were subjected to periodic acid–Schiff (PAS) staining, stained with an antibody against KIM-1 and caspase-3. Frozen kidney sections were subjected to TUNEL staining. Arrows indicate positive staining. Scale bar, 50 μm. I – M Representative western blot ( I ) and graphical representations of ( J ) KIM-1, ( K ) FAS-L, ( L ) Bax and ( M ) cleaved caspase-3 protein expression levels are shown. * P < 0.05, ** P < 0.01, *** P < 0.001 versus sham controls ( n = 5); † P < 0.05, †† P < 0.01 versus pcDNA group ( n = 5). N Tubular injury score depending on PAS staining in three groups, as indicated. *** P < 0.001 versus sham controls ( n = 5); ††† P < 0.001 versus pcDNA group ( n = 5).
Index in PubMed under a CC BY license. PMID: 37185276

Click image to see more details
Male mice were more susceptive to rhabdomyolysis-induced AKI and tubular apoptosis in kidney. A Experimental design. Female and male mice were intramuscularly injected with 50% glycerol at the dose of 7.5 ml/kg or normal saline respectively. Mice were euthanized 3 days after intramuscular injection. B Scr levels in four groups, as indicated. Scr was expressed as milligrams per deciliter. ** P < 0.01 versus sham controls in male group ( n = 5); †† P < 0.01 versus sham controls in female group ( n = 5); # P < 0.05 versus male group in glycerol group ( n = 5). C Graphical representations show three day-mortality in different genders after glycerol administration, as indicated. * P < 0.05 versus male group (n of male group = 20; n of female group = 17). D Representative micrographs show renal tubular morphologic injury and the expression of KIM-1 in different groups, as indicated. Paraffin sections were subjected to PAS staining and stained with an antibody against KIM-1. Arrows indicate positive staining. Scale bar, 50 μm. E Tubular injury score depending on PAS staining in four groups, as indicated. *** P < 0.001 versus sham controls in male group ( n = 5); ††† P < 0.001 versus sham controls in female group ( n = 5). F – J Representative western blot ( F ) and graphical representations of ( G ) KIM-1, ( H ) FAS-L, ( I ) Bax and ( J ) cleaved caspase-3 protein expression levels are shown. * P < 0.05, ** P < 0.01, *** P < 0.001 versus female group ( n = 5). K Representative micrographs show the expression of caspase-3 and TUNEL staining in different groups, as indicated. Paraffin sections were stained with an antibody against caspase-3. Frozen kidney sections were subjected to TUNEL staining. Arrow indicates positive staining. Scale bar, 50 μm.
Index in PubMed under a CC BY license. PMID: 37185276

Click image to see more details
Growth layer groups (GLGs) in the thin section of a tooth. One
GLG consists of an opaque layer and a translucent layer. The arrow represents the
neonatal line. Scale bar = 200 μm.
Index in PubMed under a CC BY license. PMID: 31966281

Click image to see more details
The expression of Sirtuin 6 was the key regulator for gender differences in rhabdomyolysis-induced AKI. A , B Representative western blot ( A ) and graphical representations of ( B ) Sirtuin 1-7 protein expression levels are shown. * P < 0.05, ** P < 0.01, *** P < 0.001 versus female group ( n = 5). C Representative micrographs show the expression of Sirtuin 6 in different groups, as indicated. Paraffin-embedded kidney sections were stained with an antibody against Sirtuin 6. Arrows indicate positive staining. Scale bar, 50 μm. D Representative micrographs showing the expression of PGC-1α and TOMM20 in different groups, as indicated. Frozen kidney sections were stained with an antibody against PGC-1α and TOMM20. Arrows indicate positive staining. Scale bar, 50 μm. E – G Representative western blot ( E ) and graphical representations of ( F ) PGC-1α and ( G ) TOMM20 protein expression levels are shown. * P < 0.05, *** P < 0.001 versus male group ( n = 5).
Index in PubMed under a CC BY license. PMID: 37185276

Click image to see more details
Sirtuin 6 is the possible contributor to gender differences upon IRI. A Graphical representations show the relative abundance of Sirtuin 1-7 mRNA in different groups. ** P < 0.01, *** P < 0.001 versus sham controls in male group ( n = 5); † P < 0.05 versus sham controls in female group ( n = 5). B , C Representative western blot ( B ) and graphical representations of ( C ) Sirtuin 1-7 protein expression levels are shown. * P < 0.05, ** P < 0.01, *** P < 0.001 versus male group ( n = 5). D Representative micrographs showing the expression of Sirtuin 6 in different groups, as indicated. Paraffin-embedded kidney sections were stained with an antibody against Sirtuin 6. Arrows indicate positive staining. Scale bar, 50 μm. E Representative micrographs showing the expression of PGC-1α and TOMM20 in different groups, as indicated. Frozen kidney sections were stained with an antibody against PGC-1α and TOMM20. Arrows indicate positive staining. Scale bar, 50 μm. F – H Representative western blot ( F ) and graphical representations of ( G ) PGC-1α and ( H ) TOMM20 protein expression levels are shown. *** P < 0.001 versus male group ( n = 5).
Index in PubMed under a CC BY license. PMID: 37185276

Click image to see more details
Male mice were more susceptive to IRI and tubular apoptosis in kidney. A Experimental design. Female and male mice were subjected to IRI or sham respectively, and euthanized 24 h after IRI. B Scr levels in four groups, as indicated. Scr was expressed as milligrams per deciliter. ** P < 0.01 versus sham controls in male group ( n = 5). C BUN levels in four groups, as indicated. BUN was expressed as milligrams per deciliter. * P < 0.05 versus sham controls in male group ( n = 5). D Representative micrographs show renal tubular morphologic injury, the expression of KIM-1 and caspase-3, and TUNEL assay in different groups, as indicated. Paraffin sections were subjected to periodic acid–Schiff (PAS) staining, stained with an antibody against KIM-1 and caspase-3. Frozen kidney sections were subjected to TUNEL assay. Arrows indicate positive staining. Scale bar, 50 μm. E – I Representative western blot ( E ) and graphical representations of ( F ) FAS-L, ( G ) Bax, ( H ) cleaved caspase-3 and ( I ) KIM-1 protein expression levels are shown. * P < 0.05, ** P < 0.01 versus male group ( n = 5).
Index in PubMed under a CC BY license. PMID: 37185276

Click image to see more details
Histological sections of testes from birth to adulthood. LC:
Leydig cells; SC: Sertoli cells; PG: Primordial germ cells; SG: Spermatogonia; PS:
Primary spermatocytes; SS: Secondary spermatocytes; SPZ: Spermatozoa. (A) 0.1yr. (B)
2.5yr. (C) 3yr. (D) 3.5yr. (E) 4.5yr. (F) 6yr. (G) 8yr. (H) 13yr. Scale bar = 50 μm.
Index in PubMed under a CC BY license. PMID: 31966281

Click image to see more details
Histological analysis of dorsolateral prostate in male aged rats treated with BPA for 3 months. The glandular cavity was slightly enlarged and increased in BPA-treated groups. ( a – d ) Representative sections of comparable regions were shown for vehicle control rats ( a ), and animals exposed to BPA (10 μg/kg/day) ( b ), BPA (30 μg/kg/day) ( c ), and BPA (90 μg/kg/day), ( d ) (scale bar: 50 μm, x40).
Index in PubMed under a CC BY license. PMID: 29323181

Click image to see more details
AR increases acetylation of PGC-1α by downregulating Sirtuin 6 expression. A – C Representative western blot ( A ) and graphical representations of ( B ) Sirtuin 1-7 and ( C ) PGC-1α protein expression levels are shown. * P < 0.05, ** P < 0.01 versus control group ( n = 3). HKC-8 cells were transfected with pcDNA3 or AR overexpression plasmid for 24 h. D Representative ChIP assay results showing the binding of AR to the Sirtuin 6 gene promoter region. HKC‐8 cells were incubated with DHT (10 μMol/L) or not for 24 h. Cell lysates were precipitated with an antibody against AR, histone H3, or nonimmune IgG, and the ChIP assay was performed for Sirtuin 6 gene promoters. Total diluted lysate was used as the total genomic input DNA. E Graphical representations show the relative abundance of Sirtuin 1-7 mRNA in different groups. ** P < 0.01 versus control group ( n = 3). F – I Representative western blot ( F ) and graphical representations of ( G ) Sirtuin 1-7, ( H ) PGC-1α and ( I ) AR protein expression levels are shown. HKC-8 cells were incubated with DHT (10 μMol/L) and transfected with AR-shRNA for 24 h. * P < 0.05, ** P < 0.01, *** P < 0.001 ( n = 3); † P < 0.05, †† P < 0.01, ††† P < 0.001 ( n = 3). J Representative graphs show the binding of PGC-1α with Sirtuin 6 or acetyl. HKC-8 cells were transfected with pcDNA3 or AR overexpression plasmid for 24 h. K Representative graphs show the binding of PGC-1α with acetyl, and the expression of PGC-1α in different groups, as indicated. HKC-8 cells were treated with DHT (10 μMol/L) and transfected with Sirtuin 6 overexpression plasmid for 24 h. L Representative graphs show the binding of PGC-1α with acetyl, and the protein levels of AR in nuclear fractions in different groups, as indicated. HKC-8 cells were treated with DHT (10 μMol/L) for 24 h. M Representative graphs show the binding of PGC-1α with acetyl, and the protein levels of AR in nuclear fractions in sham control and IRI group in male mice, as indicated.
Index in PubMed under a CC BY license. PMID: 37185276

Click image to see more details
Clustering analysis and scatter plot of microarray data. ( a ) Clustering analysis; ( b ) scatter plot; Group1: dorsolateral prostate of the BPA group; Group control: dorsolateral prostate of the control group. BPA: bisphenol A.
Index in PubMed under a CC BY license. PMID: 29323181
Specific Publications For Anti-Androgen Receptor/AR Antibody Picoband® (A00542)
Loading publications
Recommended Resources
Here are featured tools and databases that you might find useful.
- Boster's Pathways Library
- Protein Databases
- Bioscience Research Protocol Resources
- Data Processing & Analysis Software
- Photo Editing Software
- Scientific Literature Resources
- Research Paper Management Tools
- Molecular Biology Software
- Primer Design Tools
- Bioinformatics Tools
- Phylogenetic Tree Analysis
Customer Reviews
Have you used Anti-Androgen Receptor/AR Antibody Picoband®?
Share your experimental results or join a short interview to earn up to $1,000 in product credits or other rewards.
0 Reviews For Anti-Androgen Receptor/AR Antibody Picoband®
Customer Q&As
Have a question?
Find answers in Q&As, reviews.
Can't find your answer?
Submit your question
