Click image to see more details
-

-
-
-
-
+11
Product Info Summary
| SKU: | A02236-1 |
|---|---|
| Size: | 100 μg/vial |
| Reactive Species: | Mouse, Rat |
| Host: | Rabbit |
| Application: | ELISA, Flow Cytometry, IHC, WB |
Customers Who Bought This Also Bought

Product info
Product Name
Anti-CD8 alpha/Cd8a Antibody Picoband®
SKU/Catalog Number
A02236-1
Size
100 μg/vial
Form
Lyophilized
Description
Boster Bio Anti-CD8 alpha/Cd8a Antibody Picoband® catalog # A02236-1. Tested in ELISA, Flow Cytometry, IHC, WB applications. This antibody reacts with Mouse, Rat. The brand Picoband indicates this is a premium antibody that guarantees superior quality, high affinity, and strong signals with minimal background in Western blot applications. Only our best-performing antibodies are designated as Picoband, ensuring unmatched performance.
Storage & Handling
Store at -20˚C for one year from date of receipt. After reconstitution, at 4˚C for one month. It can also be aliquotted and stored frozen at -20˚C for six months. Avoid repeated freeze-thaw cycles.
Cite This Product
Anti-CD8 alpha/Cd8a Antibody Picoband® (Boster Biological Technology, Pleasanton CA, USA, Catalog # A02236-1)
Host
Rabbit
Contents
Each vial contains 4mg Trehalose, 0.9mg NaCl, 0.2mg Na2HPO4, 0.05mg NaN3.
Clonality
Polyclonal
Isotype
Rabbit IgG
Immunogen
E. coli-derived mouse CD8 alpha recombinant protein (Position: K28-Y196).
Cross-reactivity
No cross-reactivity with other proteins.
Reactive Species
A02236-1 is reactive to Cd8a in Mouse, Rat
Observed Molecular Weight
36 kDa
Calculated molecular weight
27.5 kDa
Background of Cd8a
The CD8 antigen is a cell surface glycoprotein found on most cytotoxic T lymphocytes that mediates efficient cell-cell interactions within the immune system. It is mapped to 2p11.2. The CD8 antigen, acting as a coreceptor, and the T-cell receptor on the T lymphocyte recognize antigen displayed by an antigen presenting cell (APC) in the context of class I MHC molecules. The functional coreceptor is either a homodimer composed of two alpha chains, or a heterodimer composed of one alpha and one beta chain. Both alpha and beta chains share significant homology to immunoglobulin variable light chains. This gene also encodes the CD8 alpha chain isoforms.
Antibody Validation
Boster validates all antibodies on WB, IHC, ICC, Immunofluorescence, and ELISA with known positive control and negative samples to ensure specificity and high affinity, including thorough antibody incubations.
Application & Images
Applications
A02236-1 is guaranteed for ELISA, Flow Cytometry, IHC, WB Boster Guarantee
Recommend Dilution
| Application | Dilution | Species |
|---|---|---|
| Western blot | 0.1-0.5μg/ml | |
| Immunohistochemistry (Paraffin-embedded Section) | 0.5-1μg/ml | |
| Flow Cytometry (Fixed) | 1-3μg/1x106 cells | |
| ELISA | 0.1-0.5μg/ml |
Tested application
Suggested blocking solution with 5% non-fat milk or BSA; (*)Recommended protein loading: 20-40 µg per lane
Use TE buffer pH 9.0 for antigen retrieval; (*) citrate buffer pH 6.0 is an alternative.
Validation Images & Assay Conditions
Click image to see more details
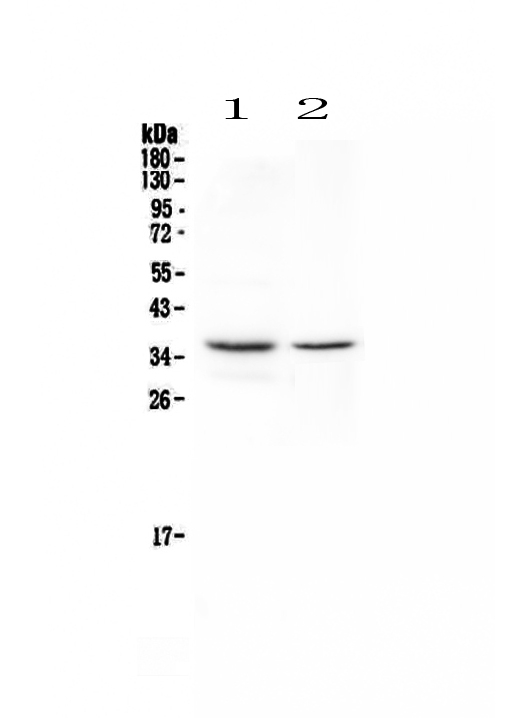
Western blot analysis of CD8 alpha using anti-CD8 alpha antibody (A02236-1).
Electrophoresis was performed on a 5-20% SDS-PAGE gel at 70V (Stacking gel) / 90V (Resolving gel) for 2-3 hours. The sample well of each lane was loaded with 50ug of sample under reducing conditions.
Lane 1: rat spleen tissue lysate,
Lane 2: rat thymus tissue lysate.
After Electrophoresis, proteins were transferred to a Nitrocellulose membrane at 150mA for 50-90 minutes. Blocked the membrane with 5% Non-fat Milk/ TBS for 1.5 hour at RT. The membrane was incubated with rabbit anti-CD8 alpha antigen affinity purified polyclonal antibody (Catalog # A02236-1) at 0.5 μg/mL overnight at 4°C, then washed with TBS-0.1%Tween 3 times with 5 minutes each and probed with a goat anti-rabbit IgG-HRP secondary antibody at a dilution of 1:10000 for 1.5 hour at RT. The signal is developed using an Enhanced Chemiluminescent detection (ECL) kit (Catalog # EK1002) with Tanon 5200 system. A specific band was detected for CD8 alpha at approximately 36KD. The expected band size for CD8 alpha is at 26KD.

Click image to see more details
Immunohistochemical analysis of the CD8a-positive area in the injured spinal region 7 days after SCI. Bar: 40 µm.
Index in PubMed under a CC BY license. PMID: 39355370

Click image to see more details
Effect of berberine treatment on the T cell immune responses to cardiac allografts. (A) MLR responses. Recipient SPCs were isolated at POD 7 (responders) and mitomycin C-treated naïve BALB/c SPCs (stimulators) were co-cultured for 3 days (n = 3 mice/group). Total SPCs were isolated at PDO 7, and the absolute numbers of (B) SPCs were determined by flow cytometry. (C) The percentage of CD4 + Foxp3 + Treg cells was determined by flow cytometry. Syngeneic recipients are shown for comparison (n = 3 mice/group). (D) The spleens of recipient mice were harvested and weighed at POD 7 (n = 5 mice/group). (E) The absolute numbers of CD4 + and CD8 + T cells SPCs (n = 3 mice/group). (F) SPCs and (G) LNCs were isolated at POD 7, and the percentage of CD4 + and CD8 + T cells was determined by flow cytometry. Syngeneic recipients are shown for comparison (n = 3 mice/group). (H) CD44 + CD69 + T cell activation assays. SPCs were isolated at POD 7, and the percentages of (i) CD4 + CD44 + CD69 + and (ii) CD8 + CD44 + CD69 + T cells were determined by flow cytometry (n = 3 mice/group). (I) LNCs were isolated at POD 7, and the percentages of (i) CD4 + CD44 + CD69 + and (ii) CD8 + CD44 + CD69 + T cells were determined by flow cytometry (n = 3 mice/group). (J) Serum plasma levels of proinflammatory cytokines. Peripheral blood was collected at POD 7, and (i) IFN-γ, (ii) IL-6, and (iii) TNF-α plasma levels were measured by ELISA (n = 3 mice/group). SPCs, spleen cells; LNCs, lymph node cells; MLR, mixed lymphocyte reaction; POD, post-operative day. * p < 0.05, ** p < 0.01, *** p < 0.001 compared to the normal saline-treated group.
Index in PubMed under a CC BY license. PMID: 33732240

Click image to see more details
Phenotypic and functional characteristics of allograft-infiltrating CD4 + or CD8 + T cells. Allografts were recovered at POD 7, and POD 100 syngeneic grafts are shown for comparison. (A) (i) Immunofluorescent staining of CD4 (red), KI67 (green), and 4′,6-diamidino-2-phenylindole (DAPI, blue) in grafts. (ii) Immunofluorescent staining of CD8 (red), KI67 (green), and DAPI in grafts (Scale bar = 200 μm; original magnification: ×200). (B) Proportion and absolute number of graft-infiltrating (i) CD4 + T cells and their expression of (ii) KI67, and proportion and absolute number of graft-infiltrating (iii) CD8 + T cells and their expression of (iv) KI67 (n = 3 mice/group). (C) Proportion of (i) IFN-γ and (ii) cleaved-caspase-3 in graft-infiltrating CD3 + T cells (n = 3 mice/group). (D) (i) Cleaved-caspase-3 and cleaved-PARP protein expression in grafts. Myocardial cell apoptosis co-immunofluorescence staining and expression of (ii) cleaved-caspase-3 and (iii) cleaved-PARP (n = 3 mice/group). (E) Relative mRNA expression of IFN-γ , IL-6, IL-10 , Foxp3 , and FasL in grafts measured by qPCR (n = 3 mice/group). SPCs, spleen cells; LNCs, lymph node cells; POD, post-operative day. * p < 0.05, ** p < 0.01, *** p < 0.001 compared to the normal saline-treated group.
Index in PubMed under a CC BY license. PMID: 33732240

Click image to see more details
The effects of berberine on CD4 + and CD8 + T cell apoptosis, activation, and proliferation in vitro . (A) T cell activation assay. The percentages of (i) CD4 + CD44 + and (ii) CD8 + CD44 + T cells were determined by flow cytometry. (B) T cell proliferation assay. T cells from naïve C57BL/6 mice were labeled with CFSE and then co-stimulated with anti-CD3/CD28 Abs in the absence or presence of berberine. After 3 days of co-culture, (i) CD4 + and (ii) CD8 + T cell division was determined by flow cytometry. (C) (i) Supernatant levels of IFN-γ measured by ELISA, and (ii) mRNA expression of IFN-γ in T cells measured by qPCR. * p < 0.05, ** p < 0.01, *** p < 0.001 compared to the (Positive Control) PC group.
Index in PubMed under a CC BY license. PMID: 33732240

Click image to see more details
Targeting USP7 inhibits murine M2 phenotype and function in vitro . (A) The mRNA expression of common genes related to DUBs was detected by RT-PCR in M0, M1 (LPS/IFN-γ M1), and M2 (IL-4/13 M2 and IL-10 M2) induced from ANA-1. ( B ) The mRNA expression of USP7 in MΦs, M1, and M2 induced from BMDMs was detected by RT-PCR. ( C ) Western blotting showing the expression of USP7 in MΦ, M1, and M2 induced from BMDMs. ( D-E ) Flow cytometry analyses of the expression of CD206 in IL-4/13-induced BMDM M2 cells, which had been treated with P5091 (5 μM or 10 μM) for 24 h. Data are presented as the mean ± SEM (n = 3). ( F ) Detection of the expression of USP7 in BMDMs, which were transfected with either NC- or USP7-siRNA by western blotting. ( G ) The expression of CD206 in BMDMs of NC-siRNA and USP7-siRNA group was detected by flow cytometry. ( H-I ) Flow cytometry analyses of CFSE expression on the surface of CD8 + T cells in the presence of conditioned medium from either DMSO- or P5091- (5 μM or 10 μM) treated IL-4/13-induced BMDM M2 cells. Data are presented as the mean ± SEM (n = 3).
Index in PubMed under a CC BY license. PMID: 32802195

Click image to see more details
Berberine induces T cell apoptosis via the mitochondrial apoptosis pathway. (A) (i) KEGG functional categories of differentially expressed genes following berberine and saline treatment. The Y-axis represents the KEGG functional categories. (ii) KEGG analysis of the significantly altered signaling pathways in cell growth- and death-associated genes. The X-axis represents the rich ratio of the number of differentially expressed genes and the Y-axis represents the KEGG pathways. (iii) qPCR analysis of Bcl-2 and TNF-α mRNA expression in SPCs collected from heart transplant recipients treated with berberine or not. (B) T cell apoptosis assays in vivo . (i) SPCs and (ii) LNCs were collected at POD 7. The percentages of apoptotic CD4 + and CD8 + T cells were determined by flow cytometry (n = 3 mice/group). (C) T cell apoptosis assay in vitro . T cells from naïve C57BL/6 mice were co-stimulated with anti-CD3/CD28 Abs in the absence or presence of berberine. The percentages of apoptotic (i) CD4 + and (ii) CD8 + T cells were determined by flow cytometry. (D) Berberine activates the mitochondrial apoptosis pathway in vivo . (i) Relative protein expression of Bcl-2, Bax, cytochrome c, cleaved-caspase-3, and cleaved-PARP in SPC. (ii) β-actin was used as a loading control (n = 3 mice/group), and OD values (relative to β-actin) are presented as means ± SEMs. * p < 0.05, ** p < 0.01, *** p < 0.001 compared to the normal saline-treated group. (E) Berberine activates the mitochondrial apoptosis pathway in vitro . Relative protein expression of Bcl-2, Bax, cytochrome c, cleaved-caspase-3, and cleaved-PARP expression in CD3 + T cells. (ii) β-actin was used as a loading control; OD values (relative to β-actin) are presented as means ± SEMs. SPCs, spleen cells; LNCs, lymph node cells; POD, post-operative day. * p < 0.05, ** p < 0.01, *** p < 0.001 compared to the PC group.
Index in PubMed under a CC BY license. PMID: 33732240

Click image to see more details
Targeting USP7 inhibits tumor growth and induces local anti-tumor immunity in vivo . ( A ) Harvested and photographed tumors in the P5091 and the Control group. ( B ) Lewis tumor growth following P5091 or Vehicle treatment in vivo. Data are presented as the mean ± SEM (n = 6 per group). ( C ) Spider diagram of the tumor volume growth in each mouse from the P5091 group and the Control group. ( D ) Gating strategy for detection of the TAMs by flow cytometry. ( E-G ) Proportions of M1 ( E ) and M2 ( F ), and M1/M2 ratio ( G ) in the TME of the P5091 group and the Control group. ( H-M ) Percentages of MDSC ( H ), Treg ( I ), CD4 + T ( J ), CD8 + T ( K ), Th1 ( L ), and CTLs ( M ) within the TME in each group. Data are presented as the mean ± SEM (n = 7) for ( E-M ).
Index in PubMed under a CC BY license. PMID: 32802195

Click image to see more details
Targeting USP7 activates local and systemic anti-tumor immunity. ( A ) Multicolor immunofluorescence detection of TAMs and CTLs in the TME of the P5091 group and the Control group. ( B-F ) Cytokines IFN-γ ( B ), TNF-α ( C ), IL-2 ( D ), IL-5 ( E ), and IL-6 ( F ) in the TME of each group were detected by Mul-Analyte Flow Assay Kit. ( G-K ) Proportion of Treg ( G ), CD4 + T ( H ), CD8 + T ( I ), Th1 ( J ), and CTLs ( K ) in the spleen of each group. Data are presented as the mean ± SEM (n = 7) for ( B-K ).
Index in PubMed under a CC BY license. PMID: 32802195

Click image to see more details
Targeting USP7 can activate the p38 MAPK pathway to reprogram TAMs. ( A ) The strategy for sorting TAMs in TME by flow cytometry. ( B ) Heat maps illustrating the differentially expressed M1- and M2-related genes in TAMs between the P5091 group and the Control group based on the results of RNA sequencing. ( C ) RT-PCR further verifying the differentially expressed genes of sorted TAMs in each group. Data are presented as the mean ± SEM (n = 3). ( D ) KEGG analysis identifying 20 most obviously enriched pathways based on the differentially expressed genes of the two groups. ( E ) Western blotting detection of the expression of JNK, p-JNK, ERK1/2, p-ERK1/2, p38, p-p38, and β-actin in IL-4/13-BMDM M2 cells treated with P5091 (10 µM) at the indicated time points. ( F ) Flow cytometry analysis of CFSE expression on the surface of CD8 + T cells in the presence of conditioned medium of IL-4/13-induced BMDM M2 cells from various indicated treatments. Treatments indicated: DMSO stimulation, P5091 (10 µM) stimulation, P5091 (10 µM) stimulation in the presence of inhibitors of p38 (SB203580, 10 µM), JNK (SP600125, 10 µM), Erk1/2 (U0126-EtOH, 10 µM). Data are presented as the mean ± SEM (n = 4).
Index in PubMed under a CC BY license. PMID: 32802195

Click image to see more details
ASNS shapes the immune landscapes in metastatic TdLN and primary tumor site. Figure 5A-C. LN metastasis model was conducted on C57BL/6 mice with LLC-ASNS WT(n=6), ASNSC2A overexpression cells(n=6) and control group(n=6), primary tumor and popliteal lymph nodes were isolated at the end of the experiment, and primary tumor volume(B) and TdLN volume/tumor volume(C) was measured and analyzed. 5D-F. (D) Representative FACS profiles of CD8+T cells are shown. The percentage(E) and number(F) of CD8+ subset in TIL cells isolated from primary tumor is shown. 5G-I. (G) Representative FACS profiles of the co-expression pattern of CD44 and CD62L, or the co-expression pattern of TCF-1and TOX in CD8+ T cells are shown. The number(H) and percentage(I) of CD44+, CD44+CD62L+, CD44+CD62L-, Tsl and TTSM subset in CD8+T cells isolated from TdLN is shown. 5J-L. (J) Representative FACS profiles of the co-expression pattern of CD44 and CD62L, or the co-expression pattern of TCF-1and TOX in CD8+ T cells are shown. The number(K) and percentage(L) of CD44+, CD44+CD62L+, CD44+CD62L-, Tsl and TTSM subset in CD8+T cells isolated from primary tumor is shown.
Index in PubMed under a CC BY license. PMID: 41208878

Click image to see more details
ASNS-high-expression metastases generated lymphocyte niches enriched with activated T cells, memory T cells, Tsl and TTSM. Figure 6A-C. Representative immunofluorescence staining images of metastatic TdLNs from LN metastasis model. 6D. The number of CD8+ T cells in the metastasis locations within TdLNs (ASNSWT, n=6, ASNSC2A, n=5, and EV, n=4). 6E-F. The number(E) and percentage(F) of CD44+CD8+T cells among all CD8 T cells in the metastasis locations within TdLNs (ASNSWT, n=6, ASNSC2A, n=5, and EV, n=4). 6G-H. The number(G) and percentage(H) of Tsl cells among all CD8 T cells in the metastasis locations within TdLNs (ASNSWT, n=6, ASNSC2A, n=5, and EV, n=4). 6I-J. The number(I) and percentage(J) of TTSM cells among all CD8 T cells in the metastasis locations within TdLNs (ASNSWT, n=5, ASNSC2A, n=4, and EV, n=3). 6K. Quantitative estimates of the distance from ova+ to CD8+CD44+CD62L+TCF+(TTSM) (ASNSWT, n=6, ASNSC2A, n=5, and EV, n=4). 6L-M. Representative immunofluorescence staining images of metastatic TdLNs from NSCLC patients. 6N-O. The number(C) and percentage(D) of CD8+ T cells in the metastasis locations within TdLNs(ASNS high group, n=7, and ASNS low group, n=6). 6P-Q. The number (E) and percentage(F) of CD45RO+CD8+ T cells in CD8+T cells in the metastasis locations within TdLNs(ASNS high group, n=7, and ASNS low group, n=6). 6R-S. The number (G) and percentage(H) of Tsl cells in CD8+T cells in the metastasis locations within TdLNs(ASNS high group, n=7, and ASNS low group, n=6). 6T-U. The number (I) and percentage(J) of TTSM cells in CD8+T cells in the metastasis locations within TdLNs(ASNS high group, n=7, and ASNS low group, n=6).
Index in PubMed under a CC BY license. PMID: 41208878

Click image to see more details
IHC analysis of CD8 alpha using anti-CD8 alpha antibody (A02236-1).
CD8 alpha was detected in paraffin-embedded section of mouse spleen tissue . Heat mediated antigen retrieval was performed in citrate buffer (pH6, epitope retrieval solution) for 20 mins. The tissue section was blocked with 10% goat serum. The tissue section was then incubated with 1μg/ml rabbit anti-CD8 alpha Antibody (A02236-1) overnight at 4°C. Biotinylated goat anti-rabbit IgG was used as secondary antibody and incubated for 30 minutes at 37°C. The tissue section was developed using Strepavidin-Biotin-Complex (SABC)(Catalog # SA1022) with DAB as the chromogen.

Click image to see more details
IHC analysis of CD8 alpha using anti-CD8 alpha antibody (A02236-1).
CD8 alpha was detected in paraffin-embedded section of rat spleen tissue . Heat mediated antigen retrieval was performed in citrate buffer (pH6, epitope retrieval solution) for 20 mins. The tissue section was blocked with 10% goat serum. The tissue section was then incubated with 1μg/ml rabbit anti-CD8 alpha Antibody (A02236-1) overnight at 4°C. Biotinylated goat anti-rabbit IgG was used as secondary antibody and incubated for 30 minutes at 37°C. The tissue section was developed using Strepavidin-Biotin-Complex (SABC)(Catalog # SA1022) with DAB as the chromogen.

Click image to see more details
Flow Cytometry analysis of mouse spleen tissues using anti-CD8 alpha antibody (A02236-1).
Overlay histogram showing mouse spleen tissues stained with A02236-1 (Blue line). The tissues were fixed with 4% paraformaldehyde and blocked with 10% normal goat serum. And then incubated with rabbit anti-CD8 alpha Antibody (A02236-1, 1 μg/1x106 cells) for 30 min at 20°C. DyLight®488 conjugated goat anti-rabbit IgG (BA1127, 5-10 μg/1x106 cells) was used as secondary antibody for 30 minutes at 20°C. Isotype control antibody (Green line) was rabbit IgG (1 μg/1x106) used under the same conditions. Unlabelled sample without incubation with primary antibody and secondary antibody (Red line) was used as a blank control.
Specific Publications For Anti-CD8 alpha/Cd8a Antibody Picoband® (A02236-1)
Loading publications
Recommended Resources
Here are featured tools and databases that you might find useful.
- Boster's Pathways Library
- Protein Databases
- Bioscience Research Protocol Resources
- Data Processing & Analysis Software
- Photo Editing Software
- Scientific Literature Resources
- Research Paper Management Tools
- Molecular Biology Software
- Primer Design Tools
- Bioinformatics Tools
- Phylogenetic Tree Analysis
Customer Reviews
Have you used Anti-CD8 alpha/Cd8a Antibody Picoband®?
Share your experimental results or join a short interview to earn up to $1,000 in product credits or other rewards.
0 Reviews For Anti-CD8 alpha/Cd8a Antibody Picoband®
Customer Q&As
Have a question?
Find answers in Q&As, reviews.
Can't find your answer?
Submit your question
17 Customer Q&As for Anti-CD8 alpha/Cd8a Antibody Picoband®
Question
I am interested in to test anti-CD8 alpha/Cd8a antibody A02236-1 on rat thymus for research purposes, then I may be interested in using anti-CD8 alpha/Cd8a antibody A02236-1 for diagnostic purposes as well. Is the antibody suitable for diagnostic purposes?
Verified Customer
Verified customer
Asked: 2020-04-21
Answer
The products we sell, including anti-CD8 alpha/Cd8a antibody A02236-1, are only intended for research use. They would not be suitable for use in diagnostic work. If you have the means to develop a product into diagnostic use, and are interested in collaborating with us and develop our product into an IVD product, please contact us for more discussions.
Boster Scientific Support
Answered: 2020-04-21
Question
We ordered your anti-CD8 alpha/Cd8a antibody for Flow Cytometry on thymus in a previous project. I am using rat, and We want to use the antibody for ELISA next. I would like examining thymus as well as pericardium in our next experiment. Could give a recommendation on which antibody would work the best for ELISA?
Verified Customer
Verified customer
Asked: 2019-11-14
Answer
I took a look at the website and datasheets of our anti-CD8 alpha/Cd8a antibody and I see that A02236-1 has been validated on rat in both Flow Cytometry and ELISA. Thus A02236-1 should work for your application. Our Boster satisfaction guarantee will cover this product for ELISA in rat even if the specific tissue type has not been validated. We do have a comprehensive range of products for ELISA detection and you can check out our website bosterbio.com to find out more information about them.
Boster Scientific Support
Answered: 2019-11-14
Question
We have been able to see staining in mouse pericardium. Do you have any suggestions? Is anti-CD8 alpha/Cd8a antibody supposed to stain pericardium positively?
Verified Customer
Verified customer
Asked: 2019-11-06
Answer
From what I have seen in literature pericardium does express CD8A. From what I have seen in Uniprot.org, CD8A is expressed in thymus, pericardium, among other tissues. Regarding which tissues have CD8A expression, here are a few articles citing expression in various tissues:
Pericardium, Pubmed ID: 14702039
Boster Scientific Support
Answered: 2019-11-06
Question
My colleagues were content with the WB result of your anti-CD8 alpha/Cd8a antibody. However we have observed positive staining in pericardium isoform 2: secreted using this antibody. Is that expected? Could you tell me where is CD8A supposed to be expressed?
Verified Customer
Verified customer
Asked: 2019-05-20
Answer
From literature, pericardium does express CD8A. Generally CD8A expresses in isoform 1: cell membrane, isoform 2: secreted. Regarding which tissues have CD8A expression, here are a few articles citing expression in various tissues:
Pericardium, Pubmed ID: 14702039
Boster Scientific Support
Answered: 2019-05-20
Question
Is a blocking peptide available for product anti-CD8 alpha/Cd8a antibody (A02236-1)?
Verified Customer
Verified customer
Asked: 2019-05-13
Answer
We do provide the blocking peptide for product anti-CD8 alpha/Cd8a antibody (A02236-1). If you would like to place an order for it please contact support@bosterbio.com and make a special request.
Boster Scientific Support
Answered: 2019-05-13
Question
Can A02236-1 detect the extracellular domain of CD8-alpha which is composed of its Exon1 and 2 mainly?
Verified customer
Asked: 2019-03-27
Answer
Yes, the Anti-CD8 alpha/Cd8a Picoband Antibody (A02236-1) K28- Y196 Uniprot: P01731 is the antibody we suggest for the experiment.
Boster Scientific Support
Answered: 2019-03-29
Question
Will A02236-1 anti-CD8 alpha/Cd8a antibody work on parafin embedded sections? If so, which fixation method do you recommend we use (PFA, paraformaldehyde, other)?
W. Lewis
Verified customer
Asked: 2018-11-30
Answer
You can see on the product datasheet, A02236-1 anti-CD8 alpha/Cd8a antibody as been validated on ELISA. It is best to use PFA for fixation because it has better tissue penetration ability. PFA needs to be prepared fresh before use. Long term stored PFA turns into formalin, as the PFA molecules congregate and become formalin.
Boster Scientific Support
Answered: 2018-11-30
Question
See attached the WB image, lot number and protocol we used for thymus using anti-CD8 alpha/Cd8a antibody A02236-1. Please let me know if you require anything else.
Verified Customer
Verified customer
Asked: 2018-05-30
Answer
Thank you very much for the data. Our lab team are working to resolve this as quickly as possible, and we appreciate your patience and understanding! You have provided everything we needed. Please let me know if there is anything you need in the meantime.
Boster Scientific Support
Answered: 2018-05-30
Question
We appreciate helping with my inquiry over the phone. Here are the WB image, lot number and protocol we used for thymus using anti-CD8 alpha/Cd8a antibody A02236-1. Let me know if you need anything else.
Verified Customer
Verified customer
Asked: 2018-03-12
Answer
We appreciate the data. You have provided everything we needed. Our lab team are working to resolve your inquiry as quickly as possible, and we appreciate your patience and understanding! Please let me know if there is anything you need in the meantime.
Boster Scientific Support
Answered: 2018-03-12
Question
I see that the anti-CD8 alpha/Cd8a antibody A02236-1 works with ELISA, what is the protocol used to produce the result images on the product page?
Verified Customer
Verified customer
Asked: 2017-11-21
Answer
You can find protocols for ELISA on the "support/technical resources" section of our navigation menu. If you have any further questions, please send an email to support@bosterbio.com
Boster Scientific Support
Answered: 2017-11-21
Question
We are currently using anti-CD8 alpha/Cd8a antibody A02236-1 for rat tissue, and we are content with the ELISA results. The species of reactivity given in the datasheet says mouse, rat. Is it possible that the antibody can work on feline tissues as well?
Verified Customer
Verified customer
Asked: 2017-10-18
Answer
The anti-CD8 alpha/Cd8a antibody (A02236-1) has not been validated for cross reactivity specifically with feline tissues, but there is a good chance of cross reactivity. We have an innovator award program that if you test this antibody and show it works in feline you can get your next antibody for free. Please contact me if I can help you with anything.
Boster Scientific Support
Answered: 2017-10-18
Question
I was wanting to use your anti-CD8 alpha/Cd8a antibody for ELISA for rat thymus on frozen tissues, but I want to know if it has been validated for this particular application. Has this antibody been validated and is this antibody a good choice for rat thymus identification?
Verified Customer
Verified customer
Asked: 2017-05-26
Answer
You can see on the product datasheet, A02236-1 anti-CD8 alpha/Cd8a antibody has been validated for ELISA, Flow Cytometry, IHC, ICC, WB on mouse, rat tissues. We have an innovator award program that if you test this antibody and show it works in rat thymus in IHC-frozen, you can get your next antibody for free.
Boster Scientific Support
Answered: 2017-05-26
Question
Is this A02236-1 anti-CD8 alpha/Cd8a antibody reactive to the isotypes of CD8A?
A. Jones
Verified customer
Asked: 2016-05-09
Answer
The immunogen of A02236-1 anti-CD8 alpha/Cd8a antibody is E. coli-derived mouse CD8 alpha recombinant protein (Position: K28-Y196). Could you tell me which isotype you are interested in so I can help see if the immunogen is part of this isotype?
Boster Scientific Support
Answered: 2016-05-09
Question
Do you have a BSA free version of anti-CD8 alpha/Cd8a antibody A02236-1 available?
M. Anderson
Verified customer
Asked: 2015-02-06
Answer
Thanks for your recent telephone inquiry. I can confirm that some lots of this anti-CD8 alpha/Cd8a antibody A02236-1 are BSA free. For now, these lots are available and we can make a BSA free formula for you free of charge. It will take 3 extra days to prepare. If you require this antibody BSA free again in future, please do not hesitate to contact me and I will be pleased to check which lots we have in stock that are BSA free.
Boster Scientific Support
Answered: 2015-02-06
Question
Would anti-CD8 alpha/Cd8a antibody A02236-1 work for ELISA with thymus?
R. Roberts
Verified customer
Asked: 2015-01-05
Answer
According to the expression profile of thymus, CD8A is highly expressed in thymus. So, it is likely that anti-CD8 alpha/Cd8a antibody A02236-1 will work for ELISA with thymus.
Boster Scientific Support
Answered: 2015-01-05
Question
My question regarding product A02236-1, anti-CD8 alpha/Cd8a antibody. I was wondering if it would be possible to conjugate this antibody with biotin. I would need it to be without BSA or sodium azide. I am planning on using a buffer exchange of sodium azide with PBS only. Would there be problems for me to conjugate the antibody and store it in -20 degrees in small aliquots?
N. Li
Verified customer
Asked: 2014-04-14
Answer
We suggest not storing this antibody with PBS buffer only in -20 degrees. If you want to store it in -20 degrees it is best to add some cryoprotectant like glycerol. If you want carrier free A02236-1 anti-CD8 alpha/Cd8a antibody, we can provide it to you in a special formula with trehalose and/or glycerol. These molecules will not interfere with conjugation chemistry and provide a good level of protection for the antibody from degradation. Please be sure to specify this in your purchase order.
Boster Scientific Support
Answered: 2014-04-14
Question
I would like using your anti-CD8 alpha/Cd8a antibody for defense response to virus studies. Has this antibody been tested with western blotting on spleen tissue? We would like to see some validation images before ordering.
K. Bhatt
Verified customer
Asked: 2013-10-22
Answer
We appreciate your inquiry. This A02236-1 anti-CD8 alpha/Cd8a antibody is validated on rat thymus tissue, spleen tissue, tissue lysate, mouse spleen tissue. It is guaranteed to work for ELISA, Flow Cytometry, IHC, ICC, WB in mouse, rat. Our Boster guarantee will cover your intended experiment even if the sample type has not been be directly tested.
Boster Scientific Support
Answered: 2013-10-22
