Click image to see more details
-

-
-
-
-
+8
Product Info Summary
| SKU: | PB9370 |
|---|---|
| Size: | 100 μg/vial |
| Reactive Species: | Human, Mouse, Rat |
| Host: | Rabbit |
| Application: | IF, IHC, ICC, WB |
Customers Who Bought This Also Bought

Product info
Product Name
Anti-Cyclin D1/CCND1 Antibody Picoband®
SKU/Catalog Number
PB9370
PB0403 is an alternative SKU for this antibody, used in previous lots.
Size
100 μg/vial
Form
Lyophilized
Description
Boster Bio Anti-Cyclin D1/CCND1 Antibody Picoband® catalog # PB9370. Tested in ICC/IF, IHC, WB applications. This antibody reacts with Human, Mouse, Rat. The brand Picoband indicates this is a premium antibody that guarantees superior quality, high affinity, and strong signals with minimal background in Western blot applications. Only our best-performing antibodies are designated as Picoband, ensuring unmatched performance.
Storage & Handling
Store at -20˚C for one year from date of receipt. After reconstitution, at 4˚C for one month. It can also be aliquotted and stored frozen at -20˚C for six months. Avoid repeated freeze-thaw cycles.
Cite This Product
Anti-Cyclin D1/CCND1 Antibody Picoband® (Boster Biological Technology, Pleasanton CA, USA, Catalog # PB9370)
Host
Rabbit
Contents
Each vial contains 4 mg Trehalose, 0.9 mg NaCl and 0.2 mg Na2HPO4.
Clonality
Polyclonal
Isotype
Rabbit IgG
Immunogen
A synthetic peptide corresponding to a sequence in the middle region of human Cyclin D1, different from the related mouse sequence by two amino acids, and from the related rat sequence by one amino acid.
Cross-reactivity
No cross-reactivity with other proteins.
Reactive Species
PB9370 is reactive to CCND1 in Human, Mouse, Rat
Observed Molecular Weight
34 kDa
Calculated molecular weight
33.7 kDa
Background of CCND1
Cyclin D1, also known as CCND1, is a human gene. The protein encoded by this gene belongs to the highly conserved cyclin family, whose members are characterized by a dramatic periodicity in protein abundance throughout the cell cycle. Cyclin D1 encodes the regulatory subunit of a holoenzyme that phosphorylates and inactivates the retinoblastoma protein and promotes progression through the G1-S phase of the cell cycle. Amplification or overexpression of cyclin D1 plays pivotal roles in the development of a subset of human cancers including parathyroid adenoma, breast cancer, colon cancer, lymphoma, melanoma, and prostate cancer. The cyclin D1 gene is overexpressed in human breast cancers and is required for oncogene-induced tumorigenesis. Brisken et al. (2003) found that prolactin induced IGF2 mRNA and IGF2 induced cyclin D1 protein expression in mouse mammary epithelial cultures. And they also concluded that IGF2 is a mediator of prolactin-induced alveologenesis and that prolactin, IGF2, and cyclin D1 are components of a developmental pathway in mammary gland.
Antibody Validation
Boster validates all antibodies on WB, IHC, ICC, Immunofluorescence, and ELISA with known positive control and negative samples to ensure specificity and high affinity, including thorough antibody incubations.
Application & Images
Applications
PB9370 is guaranteed for IF, IHC, ICC, WB Boster Guarantee
Recommend Dilution
| Application | Dilution | Species |
|---|---|---|
| Western blot | 0.1-0.5μg/ml | Human, Mouse, Rat |
| Immunohistochemistry (Paraffin-embedded Section) | 2-5μg/ml | Human, Rat |
| Immunocytochemistry/Immunofluorescence | 5 μg/ml | Human |
Tested application
Suggested blocking solution with 5% non-fat milk or BSA; (*)Recommended protein loading: 20-40 µg per lane
Use TE buffer pH 9.0 for antigen retrieval; (*) citrate buffer pH 6.0 is an alternative.
Validation Images & Assay Conditions
Click image to see more details
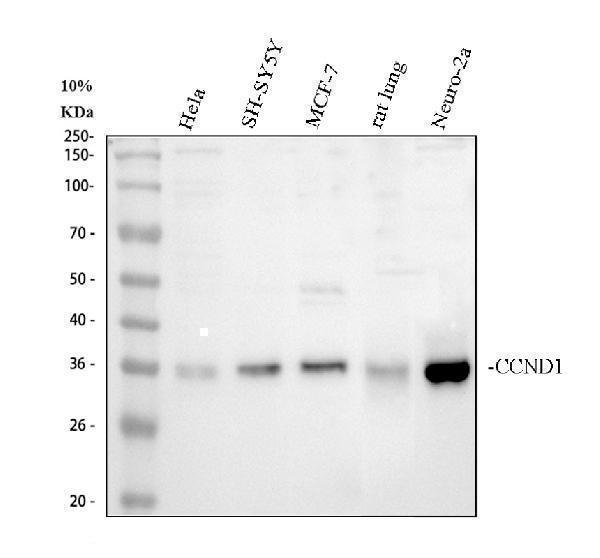
Western blot analysis of CCND1 using anti-CCND1 antibody (PB9370).
Electrophoresis was performed on a 10% SDS-PAGE gel at 80V (Stacking gel) / 120V (Resolving gel) for 2 hours. The sample well of each lane was loaded with 30 ug of sample under reducing conditions.
Lane 1: human Hela whole cell lysates,
Lane 2: human SH-SY5Y whole cell lysates,
Lane 3: human MCF-7 whole cell lysates,
Lane 4: rat lung tissue lysates,
Lane 5: mouse Neuro-2a whole cell lysates.
After electrophoresis, proteins were transferred to a nitrocellulose membrane at 150 mA for 50-90 minutes. Blocked the membrane with 5% non-fat milk/TBS for 1.5 hour at RT. The membrane was incubated with rabbit anti-CCND1 antigen affinity purified polyclonal antibody (PB9370) at 0.5 μg/mL overnight at 4°C, then washed with TBS-0.1%Tween 3 times with 5 minutes each and probed with a goat anti-rabbit IgG-HRP secondary antibody (Catalog # BA1054) at a dilution of 1:5000 for 1.5 hour at RT. The signal is developed using an ECL Plus Western Blotting Substrate (Catalog # AR1196-200) with Tanon 5200 system. A specific band was detected for CCND1 at approximately 34 kDa. The expected band size for CCND1 is at 34 kDa.

Click image to see more details
IHC analysis of CCND1 using anti-CCND1 antibody (PB9370).
CCND1 was detected in a paraffin-embedded section of human colon cancer tissue. Heat mediated antigen retrieval was performed in EDTA buffer (pH 8.0, epitope retrieval solution). The tissue section was blocked with 10% goat serum. The tissue section was then incubated with 2 μg/ml rabbit anti-CCND1 Antibody (PB9370) overnight at 4°C. Peroxidase Conjugated Goat Anti-rabbit IgG was used as secondary antibody and incubated for 30 minutes at 37°C. The tissue section was developed using HRP Conjugated Rabbit IgG Super Vision Assay Kit (Catalog # SV0002) with DAB as the chromogen.

Click image to see more details
IHC analysis of CCND1 using anti-CCND1 antibody (PB9370).
CCND1 was detected in a paraffin-embedded section of human endometrial cancer tissue. Heat mediated antigen retrieval was performed in EDTA buffer (pH 8.0, epitope retrieval solution). The tissue section was blocked with 10% goat serum. The tissue section was then incubated with 2 μg/ml rabbit anti-CCND1 Antibody (PB9370) overnight at 4°C. Peroxidase Conjugated Goat Anti-rabbit IgG was used as secondary antibody and incubated for 30 minutes at 37°C. The tissue section was developed using HRP Conjugated Rabbit IgG Super Vision Assay Kit (Catalog # SV0002) with DAB as the chromogen.

Click image to see more details
IHC analysis of CCND1 using anti-CCND1 antibody (PB9370).
CCND1 was detected in a paraffin-embedded section of rat lung tissue. Heat mediated antigen retrieval was performed in EDTA buffer (pH 8.0, epitope retrieval solution). The tissue section was blocked with 10% goat serum. The tissue section was then incubated with 2 μg/ml rabbit anti-CCND1 Antibody (PB9370) overnight at 4°C. Peroxidase Conjugated Goat Anti-rabbit IgG was used as secondary antibody and incubated for 30 minutes at 37°C. The tissue section was developed using HRP Conjugated Rabbit IgG Super Vision Assay Kit (Catalog # SV0002) with DAB as the chromogen.

Click image to see more details
IF analysis of CCND1 using anti-CCND1 antibody (PB9370) and anti-Tubulin Alpha antibody (M03989-3).
CCND1 was detected in immunocytochemical section of U2OS cell. Enzyme antigen retrieval was performed using IHC enzyme antigen retrieval reagent (AR0022) for 15 mins. The cells were blocked with 10% goat serum. And then incubated with 5 μg/mL rabbit anti-CCND1 Antibody (PB9370) and mouse anti-Tubulin Alpha antibody (M03989-3) overnight at 4°C. DyLight®488 Conjugated Goat Anti-Rabbit IgG (BA1127) and Cy3 Conjugated Goat Anti-Mouse IgG (BA1031) were used as secondary antibody at 1:500 dilution and incubated for 30 minutes at 37°C. Visualize using a fluorescence microscope and filter sets appropriate for the label used.

Click image to see more details
The effect of ADI on apoptosis-related proteins and cell cycle protein cyclin D1 in pancreatic cancer cells. A and B , Treatment with ADI (1 mU/mL) regulates the levels of antiapoptotic proteins XIAP and survivin, and pro-apoptotic proteins caspase-3 and caspase-9 in PANC-1 cells. *, P < 0.05 as compared with the control group (0 mU/mL ADI); NS, not significant. C , ADI does not alter the expression level of p53 and p21 proteins in PANC-1 cells, as compared with the control group. D and E , ADI does not alter the expression level of p53 and p21 proteins in BxPC-3 cells, as compared with the control group.
Index in PubMed under a CC BY license. PMID: 25240403

Click image to see more details
The effect of ADI on caspase-3 and cyclin D1, and the phosphorylation of NF-κB p65, STAT3, Akt, and ERK1/2 in ASS-deficient PANC-1 cells. A , ADI (1 mU/mL) up-regulates caspase-3 protein and decreases cell cycle protein cyclin D1 in a time-dependent manner in PANC-1 cells. *, P < 0.05 as compared with the treatment at 0 h; NS, not significant. B , ADI treatment (1 mU/mL for 0–24 h) of PANC-1 cells resulted in reduced phosphorylation of the NF-κB p65 subunit at Ser536. *, P < 0.05 as compared with the treatment group at 0 h; NS, not significant. C , The effect of ADI (1 mU/mL) on the phosphorylation of cell survival- associated proteins STAT3, Akt, and ERK1/2. *, P < 0.05 as compared with the control group; NS, not significant.
Index in PubMed under a CC BY license. PMID: 25240403

Click image to see more details
Shh and AKT signaling pathway inhibitors abolish the effect of EGCG on the growth of DPCs and ORSCs. (A,B) After treatment with EGCG and/or cyclopamine, GANT61 or LY294002, the cell viability of DPCs and ORSCs was assessed by MTT assay. (C,D) Protein levels of cyclinB1 and cyclinD1 in DPCs and ORSCs were assessed by western blot with β-actin as the internal reference. All experiments were repeated three times. The results are presented as mean ± SD. ### p < 0.001 compared with the control group; ∗∗∗ p < 0.001 compared with the EGCG group.
Index in PubMed under a CC BY license. PMID: 29997505

Click image to see more details
Epigallocatechin-3-gallate (EGCG) accelerates the growth of DPCs and ORSCs. (A,B) After treatment with 0.25, 0.5, 1, 2, and 4 μM EGCG for 12, 24, and 48 h, the cell viability of DPCs and ORSCs was assessed by MTT assay. $ p < 0.05 for 12 h, ∗∗∗ p < 0.001 for 24 h, ### p < 0.001 for 48 h, all compared with the control group. (C) After treatment with different concentrations of EGCG, the protein level of cyclinB1 in DPCs and ORSCs was detected by western blot. β-actin served as the internal reference. (D) Western blot was performed to detect the protein level of cyclinD1 in DPCs and ORSCs after treatment with EGCG. All experiments were repeated three times. The results are presented as mean ± SD.
Index in PubMed under a CC BY license. PMID: 29997505

Click image to see more details
Interfering RRM2 inhibits the proliferation of cancer cells. A and B Western blot analysis showed that cyclin A, cyclin B1, and cyclin D1 were down-regulated in RRM2-transfected U87 cells. data expressed as mean ± SD of three independent experiments, # P <0.001 and Ф P <0.001, versus shNC. C RRM2 depletion significantly increased the proportion of U87 cells in G2 and M phase using flow cytometry. D and E Cell proliferation was detected by CCK-8 assay in U87 and LN229 cells; data expressed as mean ± SD of three independent experiments, # P < 0.001 and Ф P < 0.001, versus shNC. F and G Silencing of RRM2 inhibited the growth of U87 cells analyzed by colony-forming assay. The colonies were calculated. data expressed as mean ± SD of three independent experiments, # P < 0.001 and Ф P < 0.001, versus shNC.
Index in PubMed under a CC BY license. PMID: 30745840

Click image to see more details
KDM2B restrains cell proliferation in CRC and induces DNA damage. (A) KDM2B protein was analyzed by Western blotting in the indicated normal human colon epithelial cells (CCD841CoN) and CRC cell lines (HT-29, ROK, LOVO, and DLD-1) * p < 0.05, ** p < 0.01, *** p < 0.001. (B,C) HT-29 and DLD-1 were transfected with siRNA (siKDM2B #1 and siKDM2B #2) and negative control (NC) using lipofectamine 2000. The relative expression of KDM2B mRNA was examined by real-time qRT-PCR after normalizing to GAPDH ( n = 3), *** p < 0.001. (D,E) The assessment of the expression level of KDM2B protein and the bar chart of quantified KDM2B protein expression in transfected HT-29 and DLD-1 cells. Data are presented as Mean ± SEM ( n = 3). Statistical significant differences in mRNA and protein in cells were observed (* p < 0.05, ** p < 0.01, *** p < 0.001 vs . negative control). The results of the CCK-8 assay (F,G) demonstrated that cell viability decreased in HT-29 and DLD-1 cells after KDM2B knockdown * p < 0.05, ** p < 0.01 vs . control. (H,I) HT-29 and DLD-1 cell colonies formed and graphical presentation of the average of colonies formed in control (NC) and transfected groups (#1 and #2). Data are expressed as Mean ± SEM ( n = 3). ** p < 0.01. (J) Comet images from HT-29 and DLD-1 cells after knockdown of KDM2B. The transfected cell group shows increasing levels of damage compared with the negative control. The number of cells scored in each measured concentration was 50. (K) The bar chart of the mean tail comet in percentage *** p < 0.001. (L) Representative densities of P21, P27, Cyclin D, and β-Tubulin proteins after Western blot experiment. (M) Cluster bar charts of representative proteins ** p < 0.01, *** P < 0.001.
Index in PubMed under a CC BY license. PMID: 33791221

Click image to see more details
PD promotes the anti-tumor effects of sorafenib in PC3 cells. (A) . The effects of PD, sorafenib and PD plus sorafenib on cell viability. (B, C) . The changes in the cell membrane and nucleus after treatment with PD alone, sorafenib (Sor) alone or PD plus sorafenib. (D) . The induction of apoptosis by PD, Sor and PD + Sor. (E) . The protein expression levels of Caspase 3, C-Caspase 3, PARP and C-PARP were examined after cells were treated with 10 μM PD alone, 10 μM sorafenib alone or PD plus sorafenib for 6 h. (F) . The ability of cells to achieve colony growth was assessed after treatment with PD alone, sorafenib alone or PD plus sorafenib for 10 days. (G) . The proliferation of cells was monitored using the CFDA SE assay after treatment with PD alone, sorafenib alone or PD plus sorafenib for 5 days. (H, I) . The cell cycle distribution of PC3 cells following treatment with PD alone, sorafenib alone or PD plus sorafenib for 24 h after pre-treatment with (H) or without (I) 2 mM thymidine. (J) . Changes in the protein expression levels of CDK4, CDK6 and cyclin D1 after treatment with 5 μM PD alone, 2.5 μM sorafenib alone or PD plus sorafenib for 24 h. * p < 0.05.
Index in PubMed under a CC BY license. PMID: 34026624
Specific Publications For Anti-Cyclin D1/CCND1 Antibody Picoband® (PB9370)
Loading publications
Recommended Resources
Here are featured tools and databases that you might find useful.
- Boster's Pathways Library
- Protein Databases
- Bioscience Research Protocol Resources
- Data Processing & Analysis Software
- Photo Editing Software
- Scientific Literature Resources
- Research Paper Management Tools
- Molecular Biology Software
- Primer Design Tools
- Bioinformatics Tools
- Phylogenetic Tree Analysis
Customer Reviews
Have you used Anti-Cyclin D1/CCND1 Antibody Picoband®?
Share your experimental results or join a short interview to earn up to $1,000 in product credits or other rewards.
0 Reviews For Anti-Cyclin D1/CCND1 Antibody Picoband®
Customer Q&As
Have a question?
Find answers in Q&As, reviews.
Can't find your answer?
Submit your question
1 Customer Q&As for Anti-Cyclin D1/CCND1 Antibody Picoband®
Question
We are currently using anti-Cyclin D1/CCND1 antibody PB9370 for human tissue, and we are happy with the WB results. The species of reactivity given in the datasheet says human. Is it true that the antibody can work on horse tissues as well?
T. Yang
Verified customer
Asked: 2017-06-28
Answer
The anti-Cyclin D1/CCND1 antibody (PB9370) has not been tested for cross reactivity specifically with horse tissues, but there is a good chance of cross reactivity. We have an innovator award program that if you test this antibody and show it works in horse you can get your next antibody for free. Please contact me if I can help you with anything.
Boster Scientific Support
Answered: 2017-06-28
