Click image to see more details
-

-
-
-
-
+6
Product Info Summary
| SKU: | A02831-5 |
|---|---|
| Size: | 100 μg/vial |
| Reactive Species: | Human |
| Host: | Rabbit |
| Application: | ELISA, Flow Cytometry, WB |
Customers Who Bought This Also Bought

Product info
Product Name
Anti-FOXE1 Picoband® Antibody
SKU/Catalog Number
A02831-5
Size
100 μg/vial
Form
Lyophilized
Description
Boster Bio Anti-FOXE1 Picoband® Antibody catalog # A02831-5. Tested in ELISA, Flow Cytometry, WB applications. This antibody reacts with Human. The brand Picoband indicates this is a premium antibody that guarantees superior quality, high affinity, and strong signals with minimal background in Western blot applications. Only our best-performing antibodies are designated as Picoband, ensuring unmatched performance.
Storage & Handling
Store at -20˚C for one year from date of receipt. After reconstitution, at 4˚C for one month. It can also be aliquotted and stored frozen at -20˚C for six months. Avoid repeated freeze-thaw cycles.
Cite This Product
Anti-FOXE1 Picoband® Antibody (Boster Biological Technology, Pleasanton CA, USA, Catalog # A02831-5)
Host
Rabbit
Contents
Each vial contains 4mg Trehalose, 0.9mg NaCl, 0.2mg Na2HPO4, 0.05mg NaN3.
Clonality
Polyclonal
Isotype
Rabbit IgG
Immunogen
E.coli-derived human FOXE1 recombinant protein (Position: M1-M373).
Cross-reactivity
No cross-reactivity with other proteins.
Reactive Species
A02831-5 is reactive to FOXE1 in Human
Observed Molecular Weight
38 kDa
Calculated molecular weight
38.1 kDa
Background of FOXE1
Forkhead box protein E1 is a protein that in humans is encoded by the FOXE1 gene. It is mapped to 9q22.33. This intronless gene encodes a protein that belongs to the forkhead family of transcription factors. Members of this family contain a conserved 100-amino acid DNA-binding 'forkhead' domain. The encoded protein functions as a thyroid transcription factor that plays a role in thyroid morphogenesis. Mutations in this gene are associated with the Bamforth-Lazarus syndrome, and with susceptibility to nonmedullary thyroid cancer-4.
Antibody Validation
Boster validates all antibodies on WB, IHC, ICC, Immunofluorescence, and ELISA with known positive control and negative samples to ensure specificity and high affinity, including thorough antibody incubations.
Application & Images
Applications
A02831-5 is guaranteed for ELISA, Flow Cytometry, WB Boster Guarantee
Recommend Dilution
| Application | Dilution | Species |
|---|---|---|
| Western blot | 0.25-0.5μg/ml | Human |
| Flow Cytometry (Fixed) | 1-3μg/1x106 cells | Human |
| ELISA | 0.1-0.5μg/ml | - |
Tested application
Suggested blocking solution with 5% non-fat milk or BSA; (*)Recommended protein loading: 20-40 µg per lane
Validation Images & Assay Conditions
Click image to see more details
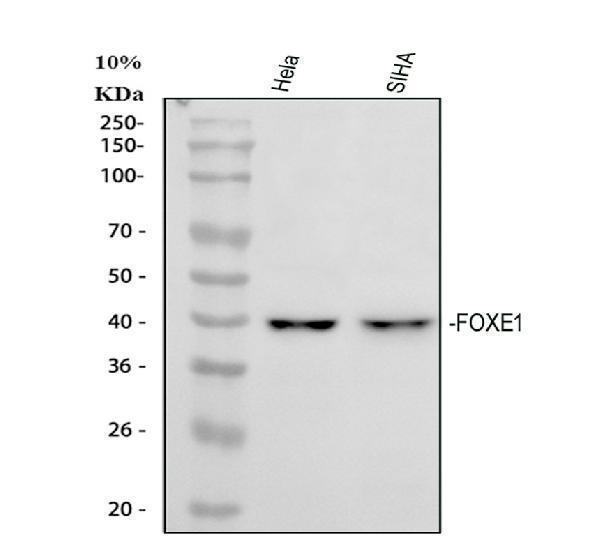
Western blot analysis of FOXE1 using anti-FOXE1 antibody (A02831-5).
Electrophoresis was performed on a 5-20% SDS-PAGE gel at 70V (Stacking gel) / 90V (Resolving gel) for 2-3 hours. The sample well of each lane was loaded with 30 ug of sample under reducing conditions.
Lane 1: human Hela whole cell lysates,
Lane 2: human SiHa whole cell lysates.
After electrophoresis, proteins were transferred to a nitrocellulose membrane at 150 mA for 50-90 minutes. Blocked the membrane with 5% non-fat milk/TBS for 1.5 hour at RT. The membrane was incubated with rabbit anti-FOXE1 antigen affinity purified polyclonal antibody (A02831-5) at 0.5 μg/mL overnight at 4°C, then washed with TBS-0.1%Tween 3 times with 5 minutes each and probed with a goat anti-rabbit IgG-HRP secondary antibody at a dilution of 1:5000 for 1.5 hour at RT. The signal is developed using an Enhanced Chemiluminescent detection (ECL) kit (Catalog # EK1002) with Tanon 5200 system. A specific band was detected for FOXE1 at approximately 38 kDa. The expected band size for FOXE1 is at 38 kDa.

Click image to see more details
Foxe1 protein structure in human, mouse and zebrafish. Multiple sequence alignment of full-length human, mouse and zebrafish FOXE1 protein. The protein contains three characterized domains which are annotated with colored lines. The similarity of the Forkhead domain (FHD) is 97% and 100%, respectively, between zebrafish and humans and between mouse and human. The sequence similarity of the whole protein between human and zebrafish is 54%. NLS is 100% identical between all species and the poly alanine stretch (PAS) is only present in humans and mouse. Red boxes mark the putative DNA-binding residues and asterisks (*) mark locations of missense mutations that were reported in individuals with Bamforth–Lazarus syndrome ( ; ; ; ; ; ). NLS: nuclear localization signal, FHD: forkhead box domain PAS: poly alanine stretch in human and mouse FOXE1. Alignment made using Clustal Omega.
Index in PubMed under a CC BY license. PMID: 36994096

Click image to see more details
Foxe1 is expressed in a range of larval tissues, including the oral epithelium, ethmoid plate, and the brain. (A–H) foxe1 transcripts were detected diffusely throughout the embryo from early development at 12.5 hpf (A) which continued through early larval stages (B–D) where transcripts also seemed specifically upregulated in the subpharyngeal area (E, F) before being enhanced in the ceratobranchials and ceratohyal ( (G) , insert lateral view). (A-D) lateral view and (E-H) ventral view. (I) Normalized relative expression of foxe1 during embryonic and larval stages as determined by qPCR. Error bars indicate standard deviations. (J-Q) Detailed protein localization at 96 hpf showed Foxe1-positive cells in the brain (J) , the ceratobranchials (K) , in the oral epithelium and in a linear cluster in the subpharyngeal area (white arrow) (L) , the eyes (M) , on the ethmoid plate (N) , on the lining of the ceratohyal (O) , in the mouth opening (P) and to some extent in the fin tips (Q) , upper image) and in the notochordal sheath ( (Q) , lower image). Posterior-anterior axis in J applies to all images. cb: ceratobranchals, ch: ceratohyal. A-H scalebar 100 μm, (J-Q) scalebar 50 µm. Antibody validation in .
Index in PubMed under a CC BY license. PMID: 36994096

Click image to see more details
Foxe1 and T4 are colocalized in the subpharyngeal area. Foxe1 and T4 staining on adjacent coronal sections of the subpharyngeal area of the larval head. T4 and Foxe1 staining in the developing thyroid follicles at 96 hpf. Nuclear counterstain with DAPI. cb; ceratobranchials, e; eye. Scale bar 200 µm.
Index in PubMed under a CC BY license. PMID: 36994096

Click image to see more details
The foxe1 rdb2 mutant. (A) Wild type and foxe1 rdb2 mutant DNA sequence at (C) 84–105. The protospacer adjacent motif is underlined (full gRNA sequence: 5′-GCCGCAAAGAGGCCGTCGGAGG-3′). The deletion is highlighted in red and the insertion in green. (B) Schematic representation of the zebrafish Foxe1 protein and the position of the amino acid changes as indicated by the red bars. (C) Nuclear localization of wild type Foxe1 and cytoplasmatic localization of mutant Foxe1 in zebrafish keratinocytes on scale. Scale bar 50 µm. (D) Representative images of wild types and foxe1 mutants at 6 dpf and 2 months post fertilization. Scale bars 1 mm.
Index in PubMed under a CC BY license. PMID: 36994096

Click image to see more details
foxe1 mutants show upregulated Foxe1 expression. Foxe1 expression in the oral epithelium and the ethmoid plate of wild type and foxe1 mutants at 96 hpf. Foxe1 was more abundantly expressed in the mutants compared to the wild types, but the tissue localization of the protein remained unaffected. Scale bar 50 µm.
Index in PubMed under a CC BY license. PMID: 36994096

Click image to see more details
Thyroid follicle development in foxe1 mutants. (A) Normalized gene-expression of thyroid marker thyroglobulin during early development (3 dpf). (B, D) Analysis of T4 positive follicles by whole mount immunohistochemistry in 6 dpf larvae showed no difference in mean follicle count or volume. (C) Representative images of wild type and mutant thyroid follicles. Larvae were imaged from the ventral side and T4-positive follicle surfaces were rendered from z-stack images using Imaris 9.0 as previously described ( ). Scale bar 200 µm. (D) Data were assessed for normality with the D’Agostino-Pearson normality test. Normally distributed data were analyzed for statistical differences using a one-way ANOVA and post hoc Tukey test or unpaired t -test. Non-parametric data were compared with a Kruskal–Wallis test with post hoc Dunn’s Multiple comparison test or Mann-Whitney test. Error bars indicate standard deviation.
Index in PubMed under a CC BY license. PMID: 36994096

Click image to see more details
Malformed ceratohyal cartilage and reduced content of Ca, Mg and P in foxe1 mutants. (A) Representative images of wild types and foxe1 heterozygous- and homozygous mutants, ventral and lateral view. (B) High magnification images of ceratohyal phenotype. (B′) Col2a1a positive cells in the in ceratohyal. (C) Standard length at 8 dpf. (D) Count of mineralized vertebrae in foxe1 mutants versus wild types at 8 dpf. (E–G) Molar calcium, magnesium and phosphorus content in foxe1 mutants versus wild type larvae during early skeletal development three to 8 dpf. n = 10–33. Scale bar 200 µm. Data were assessed for normality with the D’Agostino-Pearson normality test. Normally distributed data were analyzed for statistical differences using a one-way ANOVA and post-hoc Tukey test or unpaired t -test. Non-parametric data were compared with a Kruskal–Wallis test with post-hoc Dunn’s Multiple comparison test or Mann-Whitney test. Error bars indicate standard deviation.
Index in PubMed under a CC BY license. PMID: 36994096

Click image to see more details
Gene expression of cartilage and bone (precursor) cells is affected in foxe1 mutants. (A-I) Relative gene expression of tgfβ3, wnt5a, sp7, col2a1, col1a2, runx2b, dlx2a, sox9a and fgfr2 in mutants versus wild types. Axis description from (A) applies to all graphs. (J) dlx2a positive post migratory neural crest cells at 24 hpf (Prim-5) in wild types, 20% of the heterozygous- and 60% of the homozygous mutants. Asterisks indicate the level of significance: * = p < 0.05, ** = p < 0.01, *** = p < 0.001, **** = p < 0.0001 ( n = 10–15). Data were assessed for normality with the D’Agostino-Pearson normality test. Normally distributed data were analyzed using a one-way ANOVA and post-hoc Tukey test. Non-parametric data were compared with a Kruskal–Wallis test with post-hoc Dunn’s Multiple comparison test. Error bars indicate standard deviation. Scale bar 100 µm.
Index in PubMed under a CC BY license. PMID: 36994096

Click image to see more details
Flow Cytometry analysis of SiHa cells using anti-FOXE1 antibody (A02831-5).
Overlay histogram showing SiHa cells stained with A02831-5 (Blue line). To facilitate intracellular staining, cells were fixed with 4% paraformaldehyde and permeabilized with permeabilization buffer. The cells were blocked with 10% normal goat serum. And then incubated with rabbit anti-FOXE1 Antibody (A02831-5, 1μg/1x106 cells) for 30 min at 20°C. DyLight®488 conjugated goat anti-rabbit IgG (BA1127, 5-10μg/1x106 cells) was used as secondary antibody for 30 minutes at 20°C. Isotype control antibody (Green line) was rabbit IgG (1μg/1x106) used under the same conditions. Unlabelled sample without incubation with primary antibody and secondary antibody (Red line) was used as a blank control.
Specific Publications For Anti-FOXE1 Picoband® Antibody (A02831-5)
Loading publications
Recommended Resources
Here are featured tools and databases that you might find useful.
- Boster's Pathways Library
- Protein Databases
- Bioscience Research Protocol Resources
- Data Processing & Analysis Software
- Photo Editing Software
- Scientific Literature Resources
- Research Paper Management Tools
- Molecular Biology Software
- Primer Design Tools
- Bioinformatics Tools
- Phylogenetic Tree Analysis
Customer Reviews
Have you used Anti-FOXE1 Picoband® Antibody?
Share your experimental results or join a short interview to earn up to $1,000 in product credits or other rewards.
0 Reviews For Anti-FOXE1 Picoband® Antibody
Customer Q&As
Have a question?
Find answers in Q&As, reviews.
Can't find your answer?
Submit your question
