Click image to see more details
-

-
-
-
-
+36
Product Info Summary
| SKU: | A00227-1 |
|---|---|
| Size: | 100 μg/vial |
| Reactive Species: | Chicken, Human, Monkey, Mouse, Rat, Zebrafish |
| Host: | Rabbit |
| Application: | Flow Cytometry, IF, IHC, ICC, WB |
Customers Who Bought This Also Bought

Product info
Product Name
Anti-GAPDH Antibody Picoband®
SKU/Catalog Number
A00227-1
Size
100 μg/vial
Form
Lyophilized
Description
Boster Bio Anti-GAPDH Antibody Picoband® catalog # A00227-1. Tested in Flow Cytometry, IF, IHC, ICC, WB applications. This antibody reacts with Human, Mouse, Rat, Monkey, Chicken, Zebrafish. The brand Picoband indicates this is a premium antibody that guarantees superior quality, high affinity, and strong signals with minimal background in Western blot applications. Only our best-performing antibodies are designated as Picoband, ensuring unmatched performance.
Storage & Handling
Store at -20˚C for one year from date of receipt. After reconstitution, at 4˚C for one month. It can also be aliquotted and stored frozen at -20˚C for six months. Avoid repeated freeze-thaw cycles.
Cite This Product
Anti-GAPDH Antibody Picoband® (Boster Biological Technology, Pleasanton CA, USA, Catalog # A00227-1)
Host
Rabbit
Contents
Each vial contains 4 mg Trehalose, 0.9 mg NaCl and 0.2 mg Na2HPO4.
Clonality
Polyclonal
Isotype
Rabbit IgG
Immunogen
E.coli-derived human GAPDH recombinant protein (Position: N136-E335). Human GAPDH shares 95% and 94.5% amino acid (aa) sequence identity with mouse and rat GAPDH, respectively.
Cross-reactivity
No cross-reactivity with other proteins
Reactive Species
A00227-1 is reactive to GAPDH in Chicken, Human, Monkey, Mouse, Rat, Zebrafish
Observed Molecular Weight
36 kDa
Calculated molecular weight
36.1 kDa
Background of GAPDH
Glyceraldehyde 3-phosphate dehydrogenase (abbreviated as GAPDH or less commonly as G3PDH) is an enzyme of ~37kDa that catalyzes the sixth step of glycolysis and thus serves to break down glucose for energy and carbon molecules. This gene encodes a member of the glyceraldehyde-3-phosphate dehydrogenase protein family. GAPDH is mapped to 12p13.31. The encoded protein has been identified as a moonlighting protein based on its ability to perform mechanistically distinct functions. The product of this gene catalyzes an important energy-yielding step in carbohydrate metabolism, the reversible oxidative phosphorylation of glyceraldehyde-3-phosphate in the presence of inorganic phosphate and nicotinamide adenine dinucleotide (NAD). The encoded protein has additionally been identified to have uracil DNA glycosylase activity in the nucleus.
Antibody Validation
Boster validates all antibodies on WB, IHC, ICC, Immunofluorescence, and ELISA with known positive control and negative samples to ensure specificity and high affinity, including thorough antibody incubations.
Application & Images
Applications
A00227-1 is guaranteed for Flow Cytometry, IF, IHC, ICC, WB Boster Guarantee
Assay Dilutions Recommendation
The recommendations below provide a starting point for assay optimization. The actual working concentration varies and should be decided by the user.
Western blot, 0.1-0.5μg/ml, Human, Monkey, Mouse, Rat, Chicken, Zebrafish
Immunohistochemistry (Paraffin-embedded Section), 2-5μg/ml, Human
Immunocytochemistry/Immunofluorescence, 5 μg/ml, Human
Flow Cytometry(Fixed), 1-3 μg/1x106 cells, Human
Positive Control
WB: human Hela whole cell, human CACO-2 whole cell, human CCRF-CEM whole cell, SK-HEP1 whole cell, rat brain tissue, rat liver tissue, mouse brain tissue, mouse liver tissue
IHC: human laryngeal squamous cell carcinoma tissue, human renal clear cell carcinoma tissue, human ovarian serous cancer tissue
Validation Images & Assay Conditions
Click image to see more details
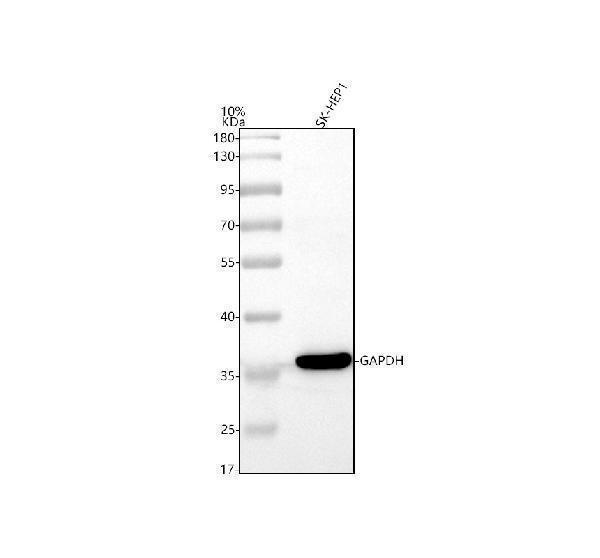
Western blot analysis of GAPDH using anti-GAPDH antibody (A00227-1).
Electrophoresis was performed on a 10% SDS-PAGE gel at 80V (Stacking gel) / 120V (Resolving gel) for 2 hours. The sample well of each lane was loaded with 30 ug of sample under reducing conditions.
Lane 1: human SK-HEP1 whole cell lysates.
After electrophoresis, proteins were transferred to a nitrocellulose membrane at 150 mA for 50-90 minutes. Blocked the membrane with 5% non-fat milk/TBS for 1.5 hour at RT. The membrane was incubated with rabbit anti-GAPDH antigen affinity purified polyclonal antibody (A00227-1) at 0.5 μg/mL overnight at 4°C, then washed with TBS-0.1%Tween 3 times with 5 minutes each and probed with a goat anti-rabbit IgG-HRP secondary antibody (Catalog # BA1054) at a dilution of 1:5000 for 1.5 hour at RT. The signal is developed using an ECL Plus Western Blotting Substrate (Catalog # AR1196-200) with Tanon 5200 system. A specific band was detected for GAPDH at approximately 36 kDa. The expected band size for GAPDH is at 36 kDa.

Click image to see more details
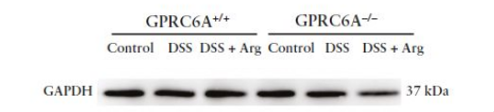
Western blot analysis of GAPDH using anti-GAPDH antibody (A00227-1).
Electrophoresis was performed on a 5-20% SDS-PAGE gel at 70V (Stacking gel) / 90V (Resolving gel) for 2-3 hours. The sample well of each lane was loaded with 30 ug of sample under reducing conditions.
Lane 1-6: mouse intestinal tissue lysates.
After electrophoresis, proteins were transferred to a nitrocellulose membrane at 150 mA for 50-90 minutes. Blocked the membrane with 5% non-fat milk/TBS for 1.5 hour at RT. The membrane was incubated with rabbit anti-GAPDH antigen affinity purified polyclonal antibody (Catalog # A00227-1) at 1:1000 overnight at 4°C, then washed with TBS-0.1%Tween 3 times with 5 minutes each and probed with a goat anti rabbit secondary antibody at a dilution of 1:5000 for 1 hour at RT. The signal is developed using an Enhanced Chemiluminescent detection (ECL) kit (Catalog # EK1002) with ChemiDoc MP system. A specific band was detected for GAPDH at approximately 37 kDa. The expected band size for GAPDH is at 36 kDa.

Click image to see more details
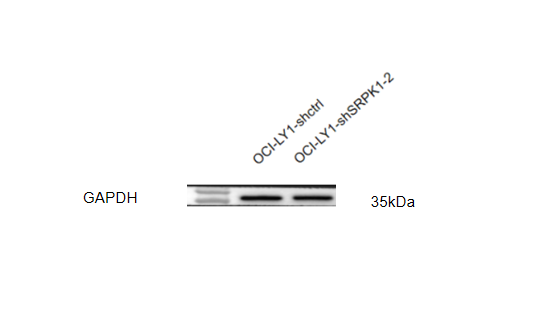
Western blot analysis of GAPDH using anti-GAPDH antibody (A00227-1).
Electrophoresis was performed on a 5-20% SDS-PAGE gel at 70V (Stacking gel) / 90V (Resolving gel) for 2-3 hours. The sample well of each lane was loaded with 30 ug of sample under reducing conditions.
Lane 1-2: human OCI-LY1whole cell lysates.
After electrophoresis, proteins were transferred to a nitrocellulose membrane at 150 mA for 50-90 minutes. Blocked the membrane with 5% non-fat milk/TBS for 1.5 hour at RT. The membrane was incubated with rabbit anti-GAPDH antigen affinity purified polyclonal antibody (Catalog # A00227-1) at 1:5000 overnight at 4°C, then washed with TBS-0.1%Tween 3 times with 5 minutes each and probed with a HRP Conjugated AffiniPure Goat Anti-Rabbit IgG (H+L) for 1 hour at RT. The signal is developed using an Enhanced Chemiluminescent detection (ECL) kit (Catalog # EK1002) with ChemiDoc MP system. A specific band was detected for GAPDH at approximately 35 kDa. The expected band size for GAPDH is at 36 kDa.

Click image to see more details
Western blot analysis of GAPDH using anti-GAPDH antibody (A00227-1).
Electrophoresis was performed on a 5-20% SDS-PAGE gel at 70V (Stacking gel) / 90V (Resolving gel) for 2-3 hours. The sample well of each lane was loaded with 30 ug of sample under reducing conditions.
Lane 1: human Hela whole cell lysates,
Lane 2: human CACO-2 whole cell lysates,
Lane 3: human CCRF-CEM whole cell lysates,
Lane 4: rat brain tissue lysates,
Lane 5: rat liver tissue lysates,
Lane 6: mouse brain tissue lysates,
Lane 7: mouse liver tissue lysates.
After electrophoresis, proteins were transferred to a nitrocellulose membrane at 150 mA for 50-90 minutes. Blocked the membrane with 5% non-fat milk/TBS for 1.5 hour at RT. The membrane was incubated with rabbit anti-GAPDH antigen affinity purified polyclonal antibody (Catalog # A00227-1) at 0.5 μg/mL overnight at 4°C, then washed with TBS-0.1%Tween 3 times with 5 minutes each and probed with a goat anti-rabbit IgG-HRP secondary antibody at a dilution of 1:5000 for 1.5 hour at RT. The signal is developed using an Enhanced Chemiluminescent detection (ECL) kit (Catalog # EK1002) with Tanon 5200 system. A specific band was detected for GAPDH at approximately 36 kDa. The expected band size for GAPDH is at 36 kDa.

Click image to see more details
IHC analysis of GAPDH using anti-GAPDH antibody (A00227-1).
GAPDH was detected in a paraffin-embedded section of human laryngeal squamous cell carcinoma tissue. Heat mediated antigen retrieval was performed in EDTA buffer (pH 8.0, epitope retrieval solution). The tissue section was blocked with 10% goat serum. The tissue section was then incubated with 2 μg/ml rabbit anti-GAPDH Antibody (A00227-1) overnight at 4°C. Peroxidase Conjugated Goat Anti-rabbit IgG was used as secondary antibody and incubated for 30 minutes at 37°C. The tissue section was developed using HRP Conjugated Rabbit IgG Super Vision Assay Kit (Catalog # SV0002) with DAB as the chromogen.

Click image to see more details
IHC analysis of GAPDH using anti-GAPDH antibody (A00227-1).
GAPDH was detected in a paraffin-embedded section of human renal clear cell carcinoma tissue. Heat mediated antigen retrieval was performed in EDTA buffer (pH 8.0, epitope retrieval solution). The tissue section was blocked with 10% goat serum. The tissue section was then incubated with 2 μg/ml rabbit anti-GAPDH Antibody (A00227-1) overnight at 4°C. Peroxidase Conjugated Goat Anti-rabbit IgG was used as secondary antibody and incubated for 30 minutes at 37°C. The tissue section was developed using HRP Conjugated Rabbit IgG Super Vision Assay Kit (Catalog # SV0002) with DAB as the chromogen.

Click image to see more details
IHC analysis of GAPDH using anti-GAPDH antibody (A00227-1).
GAPDH was detected in a paraffin-embedded section of human ovarian serous cancer tissue. Heat mediated antigen retrieval was performed in EDTA buffer (pH 8.0, epitope retrieval solution). The tissue section was blocked with 10% goat serum. The tissue section was then incubated with 2 μg/ml rabbit anti-GAPDH Antibody (A00227-1) overnight at 4°C. Peroxidase Conjugated Goat Anti-rabbit IgG was used as secondary antibody and incubated for 30 minutes at 37°C. The tissue section was developed using HRP Conjugated Rabbit IgG Super Vision Assay Kit (Catalog # SV0002) with DAB as the chromogen.

Click image to see more details
IF analysis of GAPDH using anti-GAPDH antibody (A00227-1).
GAPDH was detected in an immunocytochemical section of A549 cells. Enzyme antigen retrieval was performed using IHC enzyme antigen retrieval reagent (AR0022) for 15 mins. The cells were blocked with 10% goat serum. And then incubated with 5 μg/mL rabbit anti-GAPDH Antibody (A00227-1) overnight at 4°C. DyLight®488 Conjugated Goat Anti-Rabbit IgG (BA1127) was used as secondary antibody at 1:500 dilution and incubated for 30 minutes at 37°C. The section was counterstained with DAPI. Visualize using a fluorescence microscope and filter sets appropriate for the label used.

Click image to see more details
Flow Cytometry analysis of Hela cells using anti-GAPDH antibody (A00227-1).
Overlay histogram showing Hela cells stained with A00227-1 (Blue line). To facilitate intracellular staining, cells were fixed with 4% paraformaldehyde and permeabilized with permeabilization buffer. The cells were blocked with 10% normal goat serum. And then incubated with rabbit anti-GAPDH Antibody (A00227-1, 1 μg/1x106 cells) for 30 min at 20°C. DyLight®488 conjugated goat anti-rabbit IgG (BA1127, 5-10 μg/1x106 cells) was used as secondary antibody for 30 minutes at 20°C. Isotype control antibody (Green line) was rabbit IgG (1 μg/1x106) used under the same conditions. Unlabelled sample without incubation with primary antibody and secondary antibody (Red line) was used as a blank control.

Click image to see more details
Continuous effects of EMF on BMSC chondrogenic differentiation capacity. a SOX9, CoL2, and Aggrecan mRNA levels of two groups determined by RT-PCR. GAPDH used as internal control for quantification ( n = 3). b Expression of Col2 and Sox9 proteins of both groups detected by western blot analysis. Relative densitometer values quantified by ImageJ software, GAPDH served as loading control ( n = 3). c Presentation of Alcian Blue staining of both groups. Scale bar = 100 μm. d Semi-quantitative analysis of Alcian Blue staining among both groups ( n = 6). Data shown as mean ± SD. * P < 0.05, ** P < 0.01. EMF electromagnetic field
Index in PubMed under a CC BY license. PMID: 30092831

Click image to see more details
(L and M) (L) The apoptosis of LX-2 cells determined using flow cytometry and (M) percentages of apoptotic cells (early and late apoptotic cells). NC, LV-control-shRNA; KD, LV-4EBP1-shRNA. Values are the mean ± SD (unpaired two-sample Student’s t test). ∗∗p < 0.01, ∗∗∗p < 0.001, and ∗∗∗∗p < 0.0001; ns, not significant. α-SMA, alpha-smooth muscle actin; DAPI, 4′,6-diamidino-2-phenylindole; GAPDH, glyceraldehyde-3-phosphate dehydrogenase; HIF-1α, hypoxia inducible factor 1 subunit alpha; LV, lentivirus; PI, propidium iodide; TGF-β1, transforming growth factor beta 1.
Index in iScience under a CC BY license. DOI: 10.1016/j.isci.2025.113412

Click image to see more details
(M and N) (M) The apoptosis of vehicle or TGF-β1-stimulated LX-2 cells transducted with LV-empty or LV-4EBP1-4A-3xflag determined using flow cytometry and (N) percentages of apoptotic cells (early and late apoptotic cells). EV, LV-empty; OE, LV-4EBP1-4A-3xflag. Values are the mean ± SD (unpaired two-sample Student’s t test). ∗p < 0.05, ∗∗p < 0.01, ∗∗∗p < 0.001, and ∗∗∗∗p < 0.0001; ns, not significant. α-SMA, alpha-smooth muscle actin; DAPI, 4′,6-diamidino-2-phenylindole; GAPDH, glyceraldehyde-3-phosphate dehydrogenase; HIF-1α, hypoxia inducible factor 1 subunit alpha; LV, lentivirus; PI, propidium iodide; RT-qPCR, quantitative reverse transcription polymerase chain reaction; TGF-β1, transforming growth factor beta 1.
Index in iScience under a CC BY license. DOI: 10.1016/j.isci.2025.113412

Click image to see more details
(H) Relative quantification of α-SMA, HIF-1α, and colocalization of α-SMA and HIF-1α. EV, AAV2/8-scramble; OE, AAV2/8-4ebp1-4A-3xflag. Values are the mean ± SD (unpaired two-sample Student’s t test). ∗∗p < 0.01, ∗∗∗p < 0.001, and ∗∗∗∗p < 0.0001; ns, not significant. α-SMA, alpha-smooth muscle actin; AAV, adeno-associated virus; ALT, alanine aminotransferase; AST, aspartate aminotransferase; BDL, bile duct ligation; DAPI, 4′,6-diamidino-2-phenylindole; DBIL, direct bilirubin; GAPDH, glyceraldehyde-3-phosphate dehydrogenase; H&E, hematoxylin-eosin; HIF-1α, hypoxia inducible factor 1 subunit alpha; IL-6, Interleukin 6; TBIL, total bilirubin; TGF-β1, transforming growth factor beta 1.
Index in iScience under a CC BY license. DOI: 10.1016/j.isci.2025.113412

Click image to see more details
(J) Relative quantification of α-SMA, HIF-1α, and colocalization of α-SMA and HIF-1α. EV, AAV2/8-scramble; OE, AAV2/8-4ebp1-4A-3xflag. Values are the mean ± SD (unpaired two-sample Student’s t test). ∗p < 0.05, ∗∗p < 0.01, ∗∗∗p < 0.001, and ∗∗∗∗p < 0.0001; ns, not significant. α-SMA, alpha-smooth muscle actin; AAV, adeno-associated virus; ALT, alanine aminotransferase; AST, aspartate aminotransferase; DAPI, 4′,6-diamidino-2-phenylindole; GAPDH, glyceraldehyde-3-phosphate dehydrogenase; H&E, hematoxylin and eosin; HIF-1α, hypoxia inducible factor 1 subunit alpha; IL-6, interleukin 6; RT-qPCR, quantitative reverse transcription polymerase chain reaction; TGF-β1, transforming growth factor beta 1.
Index in iScience under a CC BY license. DOI: 10.1016/j.isci.2025.113412

Click image to see more details
(E and F) Immunofluorescence double staining of α-SMA and p-4EBP1 in TGF-β1-stimulated LX-2 cells for 0, 6, 12, 24, and 48 h (×400 magnification). Values are the mean ± SD (unpaired two-sample Student’s t test). ∗p < 0.05, ∗∗p < 0.01, ∗∗∗p < 0.001, and ∗∗∗∗p < 0.0001. α-SMA, alpha-smooth muscle actin; BDL, bile duct ligation; DAPI, 4′,6-diamidino-2-phenylindole; GAPDH, glyceraldehyde-3-phosphate dehydrogenase; H&E, hematoxylin and eosin; TGF-β1, transforming growth factor β1.
Index in iScience under a CC BY license. DOI: 10.1016/j.isci.2025.113412

Click image to see more details
Effects of EGCG on the MYH7 R453C mutation H9C2 cells. (a) Effects of EGCG on the MYH7 R453C mutation H9C2 cell survival rate. (b) Protective effects of EGCG in MYH7 R453C mutation on ROS production. (c) Effect of EGCG on Bax and Bcl-2 activities of the MYH7 R453C mutation H9C2 cells. (d) Bcl-2 expression were quantified by densitometry and normalized to GAPDH levels. (e) Bax expression was quantified by densitometry and normalized to GAPDH levels. (f) Quantitative analysis of the ratio of Bcl-2 to Bax in protein expression was evaluated. Data are expressed as the mean ± s.d. *p < 0.05, **p < 0.01, ***p < 0.001, ****p < 0.0001. n = 3 biologically independent samples.
Index in PubMed under a CC BY license. PMID: 38862020

Click image to see more details
(a) The representative cell apoptosis photos using flow cytometry, (i) The blank control group; (ii) The miR-NC transfection group; (iii) The miR-145 mimics transfection group. (b) The apoptosis rate of the miR-145 mimics transfection group increased significantly, ** p < 0.01. (c) The representative protein expression (Caspase-9: 46 kD, Caspase-3: 32 kD, GAPDH: 36 kD) photos using western blot. (d) The expression of Caspase-9 and Caspase-3 in three groups, ** p < 0.01
Index in PubMed under a CC BY license. PMID: 40591050

Click image to see more details
Alcohol interferes with Hcy metabolism leading to hyperhomocysteinemia (HHcy). ( a,b ) Scatter dot plots represent data for the CBS enzyme activity and total homocysteine (tHcy) levels in the different mice groups. ( c–f ) Representative western blot analysis for the vital enzymes (CBS, CSE, MTHFR, SAHH and Hcy) involved in homocysteine metabolism in different mice groups. Bar graphs showing quantitative estimation of key proteins after normalization with GAPDH. ( g,h ) q-PCR analysis showing the data for real‐time transcript levels of CBS, CSE, MTHFR and SAHH mRNAs in the different groups of mice. All the data are represented as mean values ± standard error (SE) in 5 independent experiments. * ,# p < 0.05 considered significant. *p < 0.05 vs. CT and # p < 0.05 vs. AL group.Uncropped blots for c and e are presented in Supplementary Figs and .
Index in PubMed under a CC BY license. PMID: 29581524

Click image to see more details
Taxifolin suppresses expression of osteoclast specific genes and proteins. RAW264.7 cells were treated with RANKL and with or without different concentrations of taxifolin for 3 days, (A) expression of Trap, Mmp-9, Cathepsin K, C-Fos, Nfatc1 , and Rank was determined by qRT-PCR and calculated in relation to the internal control GAPDH mRNA by the comparative Ct method; (B) immunoblots with MMP-9, TRAP, Cathepsin K, RANK, NFATc1 and C-Fos antibodies demonstrating that taxifolin repressed osteoclast-specific protein expression. GAPDH antibody was used as loading controls. (C) RAW264.7 cells were cultured with taxifolin for 36 h, then stimulated with RANKL (50 ng/ml) for 30 min, and RAW264.7 cells without RANKL or taxifolin was considered as “100% control,” our results showed taxifolin decreased the release of intracellular ROS. Data are presented as mean ± SD. n = 3, ∗ P < 0.05, ∗∗ P < 0.01, ∗∗∗ P < 0.001.
Index in PubMed under a CC BY license. PMID: 30483128

Click image to see more details
Ulinastatin reduces the expression of uPAR, NFATc1 and osteoclast marker genes induced by RANKL. C represents control group, R represents RANKL group, R + ulinastatin represents RANKL + 800 units/mL ulinastatin group. (A) Ulinastatin reduces RANKL-induced mRNA expression of cathepsin K, Trap, Rank, NFATc1, and uPAR. BMMs were cultured with M-CSF (30 ng/mL) and RANKL (100 ng/mL), and treated with or without ulinastatin (800 units/mL) for 4 days. mRNA expression was detected by qRT-PCR. The qRT-PCR experiments have been repeated with different RNA preparations for 3 times independently. Data are represented as mean ± SD . ∗ P < 0.05 and ∗∗ P < 0.01. (B,C,D) Ulinastatin reduces RANKL-induced protein expression of uPAR, cathepsin K and Trap. BMMs were cultured with M-CSF (30 ng/mL) and RANKL (100 ng/mL), and treated with or without ulinastatin (800 units/mL) for 2 or 4 days. Protein expression levels of uPAR, cathepsin K and Trap were examined by western blotting at the indicated times. The amount of loaded protein was 25 μg. The experiment was performed three times independently and GAPDH was used as a loading control. ∗ P < 0.05, ∗∗ P < 0.01 versus RANKL group.
Index in PubMed under a CC BY license. PMID: 30245631

Click image to see more details
Effects of Schisandrin A on IL-1β-induced production of NO, PGE2, iNOS, and COX2 in rat chondrocytes. Cells were treated with Schisandrin A (25, 50 μM) in the presence or absence of IL-1β (10 ng/ml) for 24 h. Cell culture supernatants were collected. (A) Griess reaction was used to measure the NO concentration ( n = 3). (B) PGE2 level was accessed by ELISA ( n = 3). (C) Expression of iNOS and COX2 were detected by Western blot. (D) Relative protein expression was qualified by ImageJ software, GAPDH was served as the loading control ( n = 3). # P < 0.05 vs. control group; ∗ P < 0.05 vs. IL-1β group; ∗∗ P < 0.01 vs. IL-1β group.
Index in PubMed under a CC BY license. PMID: 30761007

Click image to see more details
Effects of Schisandrin A on IL-1β-induced cartilage degradation. (A) Cells were treated with Schisandrin A (25, 50 μM) in the presence or absence of IL-1β (10 ng/ml) for 24 h. Protein levels of Collagen II, Aggrecan and Sox9 were determined by Western Blot. (B) Relative protein expression was qualified by Image-J software, GAPDH was used as the loading control ( n = 3). (C) Aggrecan and (D) Collagen II were observed by Immunofluorescence after cells were treated with IL-1β (10 ng/ml) with or without Schisandrin A (50 μM) for 24 h. # P < 0.05 vs. control group; ∗ P < 0.05 vs. IL-1β group; ∗∗ P < 0.01 vs. IL-1β group.
Index in PubMed under a CC BY license. PMID: 30761007

Click image to see more details
Effects of a SIRT1-specific inhibitor (EX 527) on the enhanced expression of an osteoblast-specific gene of bone marrow mesenchymal stem cells by Bergenin. (A and B) The expression of RUNX2 and SIRT1 in blank, control + EX 527, Bergenin (10 μM), and Bergenin (10 μM) + EX 527 groups was determined by Western blot analysis. EX 527 (10 μM) was applied for 1 h, followed by culture in osteogenic induction medium with Bergenin for 3 days. Protein expression levels were normalized to glyceraldehyde-3-phosphate dehydrogenase. Data are expressed as the mean ± standard deviation (SD) of three independent experiments, and one of three independent experiments is shown. Data are expressed as the mean ± SD. * P < 0.05 vs. group with osteogenic induction medium alone. (C) Alizarin red staining and quantification of mineralization at day 12 of osteogenic differentiation. (D) The mRNA expression of RUNX2, ALP, and COL1A1 in blank, control + EX 527, Bergenin (10 μM), and Bergenin (10 μM) + EX 527 groups was determined by quantitative reverse transcription polymerase chain reaction. EX 527 (10 μM) was applied for 1 h, followed by culture in osteogenic induction medium with Bergenin for 3 days. mRNA expression levels were normalized to GAPDH. * P < 0.05 vs. BMSCs treated with osteogenic induction medium alone.
Index in PubMed under a CC BY license. PMID: 31258473

Click image to see more details
H19 and PPARγ are upregulated in the femoral head and BMSCs of patients with SONFH. (A, B) X-ray photo and pathological structure of the femoral head from an ARCO stage V SONFH patient. The images show alterations in the morphology of the femoral head, characterized by collapse and flattening, as well as radiographic signs indicative of hip osteoarthritis. (C) Morphology of BMSCs from a patient with SONFH. (D, E) Expression levels of H19 and PPARγ in the femoral head and BMSCs from a patient with SONFH. All experimental procedures were performed in triplicate with internal normalization to GAPDH expression levels. The relative expression levels of each gene were analyzed using the 2 −△△Ct method (n = 8, all data are shown as the mean ± SD of three independent experiments, *p < 0.05, **p < 0.01).
Index in PubMed under a CC BY license. PMID: 40259926

Click image to see more details
Effect of exercise on alcohol induced DNA methyltransferase (DNMT) activity and transcriptional regulation through ATF6-Herp signaling. ( a–c ) Representative western blot analysis showing the levels of DNMT1 and DNMT3a in brain tissue extract from the different mice groups. Bar graphs showing the quantitative estimation of DNMT1 and DNMT3a proteins after normalization with GAPDH. Scatter dot plot representing the DNMT activity in brain tissue of different mice groups. ( d–f ) ChIP assay to examine the ER activated ATF6 binding to the endogenous Herp promoter in vivo . After cross linking and immunoprecipitation with ATF6 antibody from isolated brain tissue extract, PCR was performed to identify the presence of Herp promoter DNA using primers flanking the CpG islands in the Herp promoter sites. Scatter dot plot representing the percent of input DNA in different experimental mice groups. ( g,h ) Representative western blot analysis showing the levels of Herp protein expression in brain tissue extract from the different mice groups. Scatter dot plot showing the quantitative estimation of Herp proteins after normalization with GAPDH. All the data are represented as mean values ± standard error (SE) in 5 independent experiments. * ,# p < 0.05 considered significant. *p < 0.05 vs. CT and # p < 0.05 vs. AL group. Uncropped blots for a,e,g are presented in Supplementary Figs and .
Index in PubMed under a CC BY license. PMID: 29581524

Click image to see more details
Effect of exercise on alcohol induced neuronal damage. ( a,b ) Representative western blot analysis showing the levels of neuronal proteins (NeuN and NSC) in different mice groups ( a ). Histogram showing the quantitative estimation of nNOS and NSE proteins after normalization with GAPDH (b). ( c,d ) Representative images showing coronal slices of mice brains stained with cresyl violet (40× magnification) ( c ). Scatter dot plot showing the number of cresyl violet positive cells in different groups of mice ( d ). ( e,f ) Representative images showing Fluoro-Jade C (FJC) staining in brain sections of the different groups of mice (10× magnification). A marked decrease of FJC-stained degenerating neurons (arrows) were observed in CT, EX and AL+EX groups, indicating a lesser degree of neuronal cell death. Brain sections of AL treated mice showing a greater number of FJC-positive neurons (arrows), reflecting increased neuronal cell death ( e ). Scatter dot plot showing the numbers of degenerating neurons in different experimental mice groups ( f ). All the data are represented as mean values ± standard error (SE) in 5 independent experiments. * ,# p < 0.05 considered significant. *p < 0.05 vs. CT and # p < 0.05 vs. AL group. Uncropped blots for a are presented in Supplementary Fig. .
Index in PubMed under a CC BY license. PMID: 29581524

Click image to see more details
D206008 activates β-catenin signaling pathway via the phosphorylation of GSK-3β and Akt. Notes: ( A ) Cells were treated with different concentrations (0–100 µM) of D206008 for 48 hours, and the levels of p-Akt, p-GSK-3β, p-β-catenin, and β-catenin proteins were analyzed relative to β-actin expression. ( B ) B16 cells treated with either vehicle (0.1% DMSO) or D206008 (100 µM) for 48 hours were analyzed for the levels of nuclear and cytoplasmic β-catenin. Cytoplasmic protein levels were normalized against GAPDH and nuclear protein against nup98. The band densities of proteins were measured by the Quantity One program. The data are shown as mean ± SD and analyzed by one-way ANOVA followed by Tukey’s test. ** P <0.01, compared to control group. All experiments were performed three times. Abbreviations: D206008, 5-(morpholinomethyl)-3-phenyl-7 H -furo[3,2- g ]chromen-7-one; GSK-3β, glycogen synthase kinase-3β.
Index in PubMed under a CC BY license. PMID: 30858693

Click image to see more details
Effects of magnolol on mice alcohol-induced liver damage in the AKT/PI3K signaling pathway. Liver tissues were extracted for protein analysis by western blotting. AKT and PI3K, proteins expression were detected. The levels of AKT and PI3K were compared with GAPDH. The data were demonstrated as means ± SD. (*P < 0.05, **P < 0.01, ***P < 0.001).
Index in PubMed under a CC BY license. PMID: 31920652

Click image to see more details
Effects of Schisandrin A on NF-κB signaling pathway. Cells were exposed to Schisandrin A (25, 50 μM) with or without IL-1β (10 ng/ml) for 30 min. (A) Protein levels of p-IκBα, IκBα, p-p65, p65 were detected by Western blot. (B) Relative protein expression was qualified by ImageJ software, GAPDH and p65 were used as the loading control, respectively ( n = 3). (C) p65 translocation was observed by Immunofluorescence. (D) Quantitative analysis of p65 nuclear location/total ratio of three groups. # P < 0.05 vs. control group; ∗ P < 0.05 vs. IL-1β group; ∗∗ P < 0.01 vs. IL-1β group.
Index in PubMed under a CC BY license. PMID: 30761007

Click image to see more details
Effects of magnolol on mice alcohol-induced liver damage in the Nrf2/HO-1 signaling pathway. After the completion of modeling and samples were collected, the liver of mice was lysed to detect the proteins by western blotting analysis. The levels of Nrf2 and HO-1 were compared with GAPDH. The data were demonstrated as means ± SD. (*P < 0.05, ***P < 0.001 and "ns" means not significant).
Index in PubMed under a CC BY license. PMID: 31920652

Click image to see more details
Taxifolin represses multiple pathways of osteoclastogenesis in RAW264.7 cells. (A) RAW264.7 cells were pre-treated with 100 μM taxifolin for 2 h, then stimulated with RANKL (50 ng/ml) for the indicated time, protein was extracted for immunoblotting, the same GAPDH was used as loading control. (B) RAW264.7 cells were pre-treated with taxifolin in indicating concentrations for 2 h, then stimulated with RANKL (50 ng/ml) for 15 min, protein was extracted for immunoblotting, the same GAPDH was used as loading control. (C) Electrophoretic mobility shift assay for DNA binding activity of NF-κB and AP-1. After treatment with 100 μM taxifolin for 2 h, RAW264.7 cells were stimulated with RANKL (50 ng/ml) for 30 min, then nuclear extracts were prepared and analyzed for DNA binding activity. Data are of three independent experiments.
Index in PubMed under a CC BY license. PMID: 30483128

Click image to see more details
Effects of magnolol on mice alcohol-induced liver damage in PPARγ expression. The collected samples were analyzed for the expression of PPARγ using western blotting analysis. The expression of PPARγ was compared with GAPDH. The data were demonstrated as means ± SD. (*P < 0.05, **P < 0.01, ***P < 0.001 and "ns" means not significant).
Index in PubMed under a CC BY license. PMID: 31920652

Click image to see more details
BMSCs pretreated with EMF exhibited stronger osteogenic differentiation potential. a RUNX2, ALP, OPN, and OCN mRNA levels of two groups analyzed by RT-PCR. GAPDH used as loading control for quantification ( n = 3). b Expression of OPN and RUNX2 proteins of both groups determined by western blot analysis. Relative densitometer values quantified by ImageJ software, GAPDH used as internal control ( n = 3). c Images of Alizarin Red S staining exhibited plaques of calcified extracellular matrix of both groups. Scale bar = 100 μm. d Semi-quantitative analysis of Alizarin Red S staining among both groups ( n = 6). Data shown as mean ± SD. * P < 0.05, ** P < 0.01. EMF electromagnetic field
Index in PubMed under a CC BY license. PMID: 30092831

Click image to see more details
Effects of magnolol on NLRP3 inflammasome, caspase-1 and caspase-3 signaling pathway in ALD mice. Magnolol was given to mice for three times, and then alcohol was gavaged. The level of NLRP3 inflammasome, caspase-1 and caspase-3 was detected by western blotting analysis with the compared with the internal control (GAPDH). The data is presented as mean ± SD. (*P < 0.05, **P < 0.01, ***P < 0.001).
Index in PubMed under a CC BY license. PMID: 31920652

Click image to see more details
EMF treatment had lasting impact on BMSC adipogenic differentiation potential. a PPARγ2, AP2, and ADIPOQ mRNA levels of two groups detected by RT-PCR. GAPDH served as loading control for quantification ( n = 3). b Expression of ADIPOQ and PPARγ2 proteins of both groups determined by western blot analysis. Relative densitometer values quantified by ImageJ software, GAPDH used as internal control ( n = 3). c Images of Oil Red O staining showed lipid droplets of both groups. Scale bar = 25 μm. d Semiquantitative analysis of Oil Red O staining among both groups ( n = 6). Data shown as mean ± SD. * P < 0.05, ** P < 0.01. EMF electromagnetic field
Index in PubMed under a CC BY license. PMID: 30092831

Click image to see more details
Different PPARα ligands exhibited different abilities to inhibit tumour sizes and metastasis. a Serum triglyceride levels in TC-1 tumour-bearing mice ( n = 6–11). * P < 0.05, vs control. b Relative mRNA levels of Ptgs1 ( Cox1 ), Ptgs2 ( Cox2 ), Cyp2c44 , Cyp2c39 , Cyp2c38 , Cyp2c29 , Alox5, Alox12, Acot1 ( n = 6). * P < 0.05, vs control. c1 and c2 Images of the primary xenograft tumours and their growth curves in mice treated with three different PPARα ligands, AVE8134 (AVE), Wy-14,643 (Wy), and Bezafibrate (Beza; n = 8–11). * P < 0.05, AVE vs control; # P < 0.05, Wy vs control. d The weight of lungs in TC-1 tumour-bearing mice ( n = 8–11). * P < 0.05, vs control. e1 and e2 Hematoxylin and eosin (HE) staining and the number of lung metastatic tumours (red arrowhead; n = 8–11). * P < 0.05, vs control. f The ratio of liver weight to body weight ( n = 8–11). * P < 0.05, vs control; # P < 0.05, vs AVE. g The levels of serum ALT ( n = 6). * P < 0.05, vs control. h1 and h2 Tumour vascularization was quantified by CD31 antibodies in the paraffin sections of primary xenograft tumours. * P < 0.05, vs control; # P < 0.05 vs AVE; & P < 0.05 vs Wy. (I1 and I2) Representative bands of Cyp2c44 and GAPDH in tumours were evaluated by western blot. * P < 0.05, vs control ( n ≥ 3)
Index in PubMed under a CC BY license. PMID: 31791289

Click image to see more details
Effect of exercise on alcohol induced oxidative and endoplasmic reticular (ER) stress. ( a,b ) Representative western blot analysis showing the levels of antioxidant marker CAT and oxidative stress marker NOX4 in the different mice groups. Bar graphs showing the quantitative estimation of CAT and NOX4 proteins after normalization with GAPDH. ( c–e ) Scatter dot plots representing the levels of malondialdehyde (MDA), glutathione peroxidase (GPx) and production of H 2 S in brain tissue in different mice groups. ( f,g ) Representative western blot analysis showing the levels of GRP78 and ATF6 (hallmarks of ER stress) in the different groups of mice. Bar graphs showing the quantitative estimation of GRP78 and ATF6 proteins after normalization with GAPDH. ( h ) Scatter dot plot represents data for the cellular calcium ion (Ca +2 ) level in brain tissue extract of different mice groups. All the data are represented as mean values ± standard error (SE) in 5 independent experiments. * ,# p < 0.05 considered significant. *p < 0.05 vs. CT and # p < 0.05 vs. AL group. Uncropped blots for a and f are presented in Supplementary Fig. .
Index in PubMed under a CC BY license. PMID: 29581524

Click image to see more details
Effects of Bergenin on osteogenesis of bone marrow mesenchymal stem cells (BMSCs). (A) The effects of Bergenin on alkaline phosphatase activity at days 3 and 5 during the osteogenic differentiation of BMSCs. (B – E) mRNA expression of RUNX2, ALP, and COL1A1 was determined by quantitative reverse transcription polymerase chain reaction at day 3 and day 5 during osteogenic differentiation. mRNA expression levels were normalized to GAPDH. (F – K) The expression of RUNX2 and SIRT1 protein was determined by Western blot analysis after osteogenic differentiation at days 3 and 5. Protein expression levels were normalized to glyceraldehyde-3-phosphate dehydrogenase. Data are expressed as the mean ± standard deviation (SD) of three independent experiments, and one of three independent experiments is shown. Data are expressed as the mean ± SD, n = 3. * P < 0.05 vs. BMSCs treated with osteogenic induction medium alone. (L) Alizarin red staining at days 12 and 14 of osteogenic differentiation. Magnification ×40. (M) Immunofluorescence staining showing that the protein levels of RUNX2, COL1A1, and SIRT1 are upregulated by the addition of Bergenin (10 or 100 μM) at day 3 of osteogenic differentiation. COL1A1 is stained green. RUNX2 and SIRT1 are stained red. Nuclei are stained with 4′,6-diamidino-2-phenylindole (blue). Magnification ×200.
Index in PubMed under a CC BY license. PMID: 31258473

Click image to see more details
( a , b ) Effect of exercise on alcohol induced vascular permeability and BBB dysfunction. Representative western blot analysis showing the levels of tight junction (TJ) proteins (ZO-1 and Claudin-5) in the different mice groups ( a ). Histogram showing the quantitative estimation of ZO-1 and Claudin-5 proteins after normalization with GAPDH (b). ( c,d ) Representative images showing fluorescent protein (FITC-BSA) leakage from pial vessels into brain parenchyma – indicating alteration in microvascular permeability in the different groups of mice ( c ). Scatter dot plot showing quantitative estimation of fluorescent intensity units (FIU) in the different mice groups after FITC-BSA injection ( d ). ( e , f ) Representative images of cerebral angiogram with barium sulfate contrast in experimental mice groups ( e ). Scatter dot plot showing the pattern of vascular density in the form of percentage of vascular area in the different mice groups ( f ). ( g , h ) Representative images for the in vitro model showing microvascular permeability in brain endothelial cells (bEnd.3 cells) by FITC-BSA diffusion assay. Fluorescence intensity of bovine serum albumin conjugated with FITC (BSA-488) in lower chambers of Transwells was measured by fluorimetry and presented as FIU ( g ). Histogram showing quantitative estimation of FIU in different experimental conditions after FITC-BSA treatment in Transwell chambers ( h ). ( i , j ) Representative western blot analysis showing the levels of junctional proteins (VE-Cadherin, Claudin-5 and ZO-2) in different experimental conditions of mouse brain endothelial cells (i). Histograms showing the quantitative estimation of ZO-2, Claudin-5 and VE-Cadherin proteins after normalization with GAPDH (j). All the data are represented as mean values ± standard error (SE) in 5 independent experiments. * ,# p < 0.05 considered significant.*p < 0.05 vs. CT and # p < 0.05 vs. AL group. Uncropped blots for Fig. are presented in Supplementary Fig. and .
Index in PubMed under a CC BY license. PMID: 29581524

Click image to see more details
Effects of Schisandrin A on IL-1β-induced MMPs and ADAMTS5 protein expression. Chondrocytes were exposed to Schisandrin A (25, 50 μM) with or without IL-1β (10 ng/ml) for 24 h. (A) Western blot was employed to determine the expression of MMP1, MMP3, MMP13, and ADAMTS5. (B) Relative protein expression was qualified by Image-J software, GAPDH was used as the internal control ( n = 3). # P < 0.05 vs. control group; ∗ P < 0.05 vs. IL-1β group; ∗∗ P < 0.01 vs. IL-1β group.
Index in PubMed under a CC BY license. PMID: 30761007
Specific Publications For Anti-GAPDH Antibody Picoband® (A00227-1)
Loading publications
Recommended Resources
Here are featured tools and databases that you might find useful.
- Boster's Pathways Library
- Protein Databases
- Bioscience Research Protocol Resources
- Data Processing & Analysis Software
- Photo Editing Software
- Scientific Literature Resources
- Research Paper Management Tools
- Molecular Biology Software
- Primer Design Tools
- Bioinformatics Tools
- Phylogenetic Tree Analysis
Customer Reviews
Have you used Anti-GAPDH Antibody Picoband®?
Share your experimental results or join a short interview to earn up to $1,000 in product credits or other rewards.
2 Reviews For Anti-GAPDH Antibody Picoband®
Western blot of OCI-LY1 cells treated with SPHINX31 showed stable GAPDH expression with clear bands and clean background, demonstrating high specificity of A00227-1.
Excellent
| SKU | A00227-1 |
|---|---|
| Application | Western Blot |
| Sample | human OCI-LY1 cellls |
| Sample Processing Description | Cell samples were lysed by sonication in RIPA buffer containing protease and phosphatase inhibitors, followed by centrifugation for 10 minutes. The supernatant was mixed with loading buffer at a 4:1 ratio, boiled for 10 minutes, and 15 μL of protein was loaded per well. |
| Other Reagents | 5% non-fat milk |
| Primary Antibody | GAPDH Antibody Picoband® |
| Primary Incubation | 1:5000, overnight at 4 ℃ |
| Secondary Antibody | HRP Conjugated AffiniPure Goat Anti-Rabbit IgG (H+L) |
| Secondary Incubation | 1 h in RT |
| Detection | Substrate: ECL substrate, Image system:ChemiDoc MP |
| Results Summary | In OCI-LY1 cells treated with different concentrations of SPHINX31 for 24 h, GAPDH expression remained stable with no significant differences, showing clear bands and a clean background without nonspecific signals. |
Maolin Yao, Fujian Medical University
Verified customer
Submitted 2026-02-27
The Anti-GAPDH antibody (A00227-1) demonstrated high sensitivity and clear WB bands in mouse intestinal tissue, offering excellent cost-effectiveness and reliability, and is highly recommended for use.
Excellent
| SKU | A00227-1 |
|---|---|
| Application | Western Blot |
| Sample | mouse intesinal tissue |
| Sample Processing Description | Mouse colon tissue was lysed in RIPA buffer containing a protease inhibitor cocktail. Protein concentration was determined using the Pierce™ BCA Protein Assay Kit, and equal amounts of protein were loaded after boiling denaturation. |
| Other Reagents | 5% non-fat milk |
| Primary Antibody | GAPDH Antibody Picoband® |
| Primary Incubation | 1:1000, overnight at 4 ℃ |
| Secondary Antibody | goat anti rabbit secondary antibodies |
| Secondary Incubation | 1:5000, 1 h in RT |
| Detection | Substrate: ECL substrate, Image system:ChemiDoc MP |
| Results Summary | This antibody is highly sensitive, produces clear WB bands, is reusable, offers excellent cost-effectiveness, and demonstrates a clear advantage over similar international products, making it highly recommended for use. |
Qihang Hou, China Agricultural University
Verified customer
Submitted 2026-02-27
Customer Q&As
Have a question?
Find answers in Q&As, reviews.
Can't find your answer?
Submit your question
16 Customer Q&As for Anti-GAPDH Antibody Picoband®
Question
Thank you for helping with my inquiry over the phone. Here are the WB image, lot number and protocol we used for eye using anti-GAPDH antibody A00227-1. Let me know if you need anything else.
Verified Customer
Verified customer
Asked: 2020-01-08
Answer
Thank you for the data. You have provided everything we needed. Our lab team are working to resolve your inquiry as quickly as possible, and we appreciate your patience and understanding! Please let me know if there is anything you need in the meantime.
Boster Scientific Support
Answered: 2020-01-08
Question
Here is the WB image, lot number and protocol we used for eye using anti-GAPDH antibody A00227-1. Please let me know if you require anything else.
Verified Customer
Verified customer
Asked: 2019-12-24
Answer
Thank you very much for the data. Our lab team are working to resolve this as quickly as possible, and we appreciate your patience and understanding! You have provided everything we needed. Please let me know if there is anything you need in the meantime.
Boster Scientific Support
Answered: 2019-12-24
Question
Do you have a BSA free version of anti-GAPDH antibody A00227-1 available?
Verified Customer
Verified customer
Asked: 2019-10-31
Answer
Thank you for your recent telephone inquiry. I can confirm that some lots of this anti-GAPDH antibody A00227-1 are BSA free. For now, these lots are available and we can make a BSA free formula for you free of charge. It will take 3 extra days to prepare. If you require this antibody BSA free again in future, please do not hesitate to contact me and I will be pleased to check which lots we have in stock that are BSA free.
Boster Scientific Support
Answered: 2019-10-31
Question
Will anti-GAPDH antibody A00227-1 work for IHC with eye?
Verified Customer
Verified customer
Asked: 2019-10-18
Answer
According to the expression profile of eye, GAPDH is highly expressed in eye. So, it is likely that anti-GAPDH antibody A00227-1 will work for IHC with eye.
Boster Scientific Support
Answered: 2019-10-18
Question
Can you help my question with product A00227-1, anti-GAPDH antibody. I was wondering if it would be possible to conjugate this antibody with biotin. I would need it to be without BSA or sodium azide. I am planning on using a buffer exchange of sodium azide with PBS only. Would there be problems for me to conjugate the antibody and store it in -20 degrees in small aliquots?
Verified Customer
Verified customer
Asked: 2019-08-09
Answer
We do not recommend storing this antibody with PBS buffer only in -20 degrees. If you want to store it in -20 degrees it is best to add some cryoprotectant like glycerol. If you want carrier free A00227-1 anti-GAPDH antibody, we can provide it to you in a special formula with trehalose and/or glycerol. These molecules will not interfere with conjugation chemistry and provide a good level of protection for the antibody from degradation. Please be sure to specify this in your purchase order.
Boster Scientific Support
Answered: 2019-08-09
Question
I was wanting to use to test anti-GAPDH antibody A00227-1 on human eye for research purposes, then I may be interested in using anti-GAPDH antibody A00227-1 for diagnostic purposes as well. Is the antibody suitable for diagnostic purposes?
Verified Customer
Verified customer
Asked: 2019-05-22
Answer
The products we sell, including anti-GAPDH antibody A00227-1, are only intended for research use. They would not be suitable for use in diagnostic work. If you have the means to develop a product into diagnostic use, and are interested in collaborating with us and develop our product into an IVD product, please contact us for more discussions.
Boster Scientific Support
Answered: 2019-05-22
Question
Our lab were satisfied with the WB result of your anti-GAPDH antibody. However we have been able to see positive staining in liver cytoplasm using this antibody. Is that expected? Could you tell me where is GAPDH supposed to be expressed?
Verified Customer
Verified customer
Asked: 2019-05-16
Answer
From literature, liver does express GAPDH. Generally GAPDH expresses in cytoplasm, cytosol. Regarding which tissues have GAPDH expression, here are a few articles citing expression in various tissues:
Astrocytoma, Pubmed ID: 10944468
Cervix carcinoma, Pubmed ID: 17081983, 18669648, 20068231
Cervix carcinoma, and Erythroleukemia, Pubmed ID: 23186163
Heart, Pubmed ID: 7498159
Leukemic T-cell, Pubmed ID: 19690332
Liver, Pubmed ID: 2987855, 24275569
Lung, Pubmed ID: 3664468
Lymphoblast, Pubmed ID: 14654843
Muscle, Pubmed ID: 1193541, 11724794
Placenta, Pubmed ID: 1924305
Boster Scientific Support
Answered: 2019-05-16
Question
Is a blocking peptide available for product anti-GAPDH antibody (A00227-1)?
Verified Customer
Verified customer
Asked: 2019-02-11
Answer
We do provide the blocking peptide for product anti-GAPDH antibody (A00227-1). If you would like to place an order for it please contact support@bosterbio.com and make a special request.
Boster Scientific Support
Answered: 2019-02-11
Question
I was wanting to use your anti-GAPDH antibody for IHC for human eye on frozen tissues, but I want to know if it has been validated for this particular application. Has this antibody been validated and is this antibody a good choice for human eye identification?
Verified Customer
Verified customer
Asked: 2018-11-30
Answer
It shows on the product datasheet, A00227-1 anti-GAPDH antibody has been tested for IHC, WB on human, mouse, rat tissues. We have an innovator award program that if you test this antibody and show it works in human eye in IHC-frozen, you can get your next antibody for free.
Boster Scientific Support
Answered: 2018-11-30
Question
Is this A00227-1 anti-GAPDH antibody reactive to the isotypes of GAPDH?
Verified Customer
Verified customer
Asked: 2018-11-20
Answer
The immunogen of A00227-1 anti-GAPDH antibody is E.coli-derived human GAPDH recombinant protein (Position: N136-E335). Human GAPDH shares 95% and 94.5% amino acid (aa) sequence identity with mouse and rat GAPDH, respectively. Could you tell me which isotype you are interested in so I can help see if the immunogen is part of this isotype?
Boster Scientific Support
Answered: 2018-11-20
Question
Will A00227-1 anti-GAPDH antibody work on parafin embedded sections? If so, which fixation method do you recommend we use (PFA, paraformaldehyde, other)?
Verified Customer
Verified customer
Asked: 2018-04-12
Answer
It shows on the product datasheet, A00227-1 anti-GAPDH antibody as been tested on IHC. It is best to use PFA for fixation because it has better tissue penetration ability. PFA needs to be prepared fresh before use. Long term stored PFA turns into formalin, as the PFA molecules congregate and become formalin.
Boster Scientific Support
Answered: 2018-04-12
Question
We bought anti-GAPDH antibody for WB on colon adenocarcinoma last year. I am using rat, and We want to use the antibody for IHC next. We want examining colon adenocarcinoma as well as lung in our next experiment. Could you please give me some suggestion on which antibody would work the best for IHC?
P. Brown
Verified customer
Asked: 2017-11-27
Answer
I looked at the website and datasheets of our anti-GAPDH antibody and I see that A00227-1 has been tested on rat in both WB and IHC. Thus A00227-1 should work for your application. Our Boster satisfaction guarantee will cover this product for IHC in rat even if the specific tissue type has not been validated. We do have a comprehensive range of products for IHC detection and you can check out our website bosterbio.com to find out more information about them.
Boster Scientific Support
Answered: 2017-11-27
Question
We have seen staining in rat prostatic carcinoma. What should we do? Is anti-GAPDH antibody supposed to stain prostatic carcinoma positively?
Verified Customer
Verified customer
Asked: 2017-08-08
Answer
From literature prostatic carcinoma does express GAPDH. From Uniprot.org, GAPDH is expressed in smooth muscle tissue, liver, lung, placenta, astrocytoma, leukemia, colon adenocarcinoma, eye, kidney, lung, lymph placenta, muscle, platelet, prostatic carcinoma, brain, cajal-retzius cell fetal brain cortex, heart, lymphoblast, cervix carcinoma, leukemic t-cell, cervix carcinoma erythroleukemia, among other tissues. Regarding which tissues have GAPDH expression, here are a few articles citing expression in various tissues:
Astrocytoma, Pubmed ID: 10944468
Cervix carcinoma, Pubmed ID: 17081983, 18669648, 20068231
Cervix carcinoma, and Erythroleukemia, Pubmed ID: 23186163
Heart, Pubmed ID: 7498159
Leukemic T-cell, Pubmed ID: 19690332
Liver, Pubmed ID: 2987855, 24275569
Lung, Pubmed ID: 3664468
Lymphoblast, Pubmed ID: 14654843
Muscle, Pubmed ID: 1193541, 11724794
Placenta, Pubmed ID: 1924305
Boster Scientific Support
Answered: 2017-08-08
Question
I see that the anti-GAPDH antibody A00227-1 works with IHC, what is the protocol used to produce the result images on the product page?
Verified Customer
Verified customer
Asked: 2017-05-17
Answer
You can find protocols for IHC on the "support/technical resources" section of our navigation menu. If you have any further questions, please send an email to support@bosterbio.com
Boster Scientific Support
Answered: 2017-05-17
Question
My lab would like using your anti-GAPDH antibody for gluconeogenesis studies. Has this antibody been tested with western blotting on rat kidney? We would like to see some validation images before ordering.
C. Edwards
Verified customer
Asked: 2016-08-24
Answer
We appreciate your inquiry. This A00227-1 anti-GAPDH antibody is tested on rat kidney, mouse kidney, hela whole cell lysates. It is guaranteed to work for IHC, WB in human, mouse, rat. Our Boster guarantee will cover your intended experiment even if the sample type has not been be directly tested.
Boster Scientific Support
Answered: 2016-08-24
Question
We are currently using anti-GAPDH antibody A00227-1 for mouse tissue, and we are satisfied with the IHC results. The species of reactivity given in the datasheet says human, mouse, rat. Is it true that the antibody can work on pig tissues as well?
S. Dhar
Verified customer
Asked: 2014-10-23
Answer
The anti-GAPDH antibody (A00227-1) has not been validated for cross reactivity specifically with pig tissues, but there is a good chance of cross reactivity. We have an innovator award program that if you test this antibody and show it works in pig you can get your next antibody for free. Please contact me if I can help you with anything.
Boster Scientific Support
Answered: 2014-10-23
