Click image to see more details
-

-
-
-
-
+34
Product Info Summary
| SKU: | PA1239 |
|---|---|
| Size: | 100 μg/vial |
| Reactive Species: | Human, Mouse, Rat |
| Host: | Rabbit |
| Application: | IF, IHC, WB |
Customers Who Bought This Also Bought

Product info
Product Name
Anti-GFAP Antibody Picoband®
SKU/Catalog Number
PA1239
BA0056 is an alternative SKU for this antibody, used in previous lots.
Size
100 μg/vial
Form
Lyophilized
Description
Boster Bio Anti-GFAP Antibody catalog # PA1239. Tested in IF, IHC, WB applications. This antibody reacts with Human, Mouse, Rat. The brand Picoband indicates this is a premium antibody that guarantees superior quality, high affinity, and strong signals with minimal background in Western blot applications. Only our best-performing antibodies are designated as Picoband, ensuring unmatched performance.
Storage & Handling
Store at -20˚C for one year from date of receipt. After reconstitution, at 4˚C for one month. It can also be aliquotted and stored frozen at -20˚C for six months. Avoid repeated freeze-thaw cycles.
Cite This Product
Anti-GFAP Antibody Picoband® (Boster Biological Technology, Pleasanton CA, USA, Catalog # PA1239)
Host
Rabbit
Contents
Each vial contains antibody formulated with stabilizing components, 0.9mg NaCl, 0.2mg Na2HPO4, 0.05mg Thimerosal, 0.05mg NaN3.
*This antibody is supplied in a stabilized formulation.
Compatibility with conjugation reactions depends on the chemistry of the conjugation method used.
For conjugation methods that are not compatible with the stabilizing components present in this formulation, a carrier-free antibody format is required.
Clonality
Polyclonal
Isotype
Rabbit IgG
Immunogen
A synthetic peptide corresponding to a sequence at the C-terminus of human GFAP, identical to the related rat sequence, and different from the related mouse sequence by two amino acids.
Cross-reactivity
No cross-reactivity with other proteins
Reactive Species
PA1239 is reactive to GFAP in Human, Mouse, Rat
Observed Molecular Weight
50 kDa
Calculated molecular weight
49.9 kDa
Background of GFAP
Glial fibrillary acidic protein (GFAP) is an intermediate-filament (IF) protein that is highly specific for cells of astroglial lineage, although its tissue-specific role is speculative. GFAP has been located in rat kidney glomeruli and peritubular fibroblasts, leydig cells of testis, skin keratinocytes, osteocytes of bones, chondrocytes of epiglottis, bronchus, and stellate-shaped cells of the pancreas and liver. Its expression is essential for normal white matter architecture and blood-brain barrier integrity, and its absence leads to late-onset CNS dysmyelination. GFAP has also been shown to play a role in mitosis by adjusting the filament network present in the cell. During mitosis, there is an increase in the amount of phosphorylated GFAP, and a movement of this modified protein to the cleavage furrow.
Antibody Validation
Boster validates all antibodies on WB, IHC, ICC, Immunofluorescence, and ELISA with known positive control and negative samples to ensure specificity and high affinity, including thorough antibody incubations.
Application & Images
Applications
PA1239 is guaranteed for IF, IHC, WB Boster Guarantee
Recommend Dilution
| Application | Dilution | Species |
|---|---|---|
| Immunohistochemistry (Paraffin-embedded Section) | 0.5-1μg/ml | Rat, Mouse |
| Western blot | 0.1-0.5μg/ml | Human, Mouse, Rat |
| Immunofluorescence | 2μg/ml | Mouse |
Tested application
Suggested blocking solution with 5% non-fat milk or BSA; (*)Recommended protein loading: 20-40 µg per lane
Use TE buffer pH 9.0 for antigen retrieval; (*) citrate buffer pH 6.0 is an alternative.
Validation Images & Assay Conditions
Click image to see more details
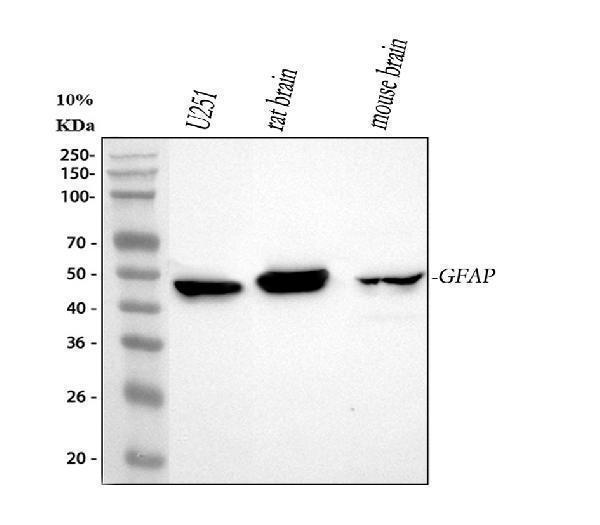
Western blot analysis of GFAP using anti-GFAP antibody (PA1239).
Electrophoresis was performed on a 5-20% SDS-PAGE gel at 70V (Stacking gel) / 90V (Resolving gel) for 2-3 hours. The sample well of each lane was loaded with 30 ug of sample under reducing conditions.
Lane 1: human U251 whole cell lysates,
Lane 2: rat brain tissue lysates,
Lane 3: mouse brain tissue lysates.
After electrophoresis, proteins were transferred to a nitrocellulose membrane at 150 mA for 50-90 minutes. Blocked the membrane with 5% non-fat milk/TBS for 1.5 hour at RT. The membrane was incubated with rabbit anti-GFAP antigen affinity purified polyclonal antibody (Catalog # PA1239) at 0.5 μg/mL overnight at 4°C, then washed with TBS-0.1%Tween 3 times with 5 minutes each and probed with a goat anti-rabbit IgG-HRP secondary antibody at a dilution of 1:5000 for 1.5 hour at RT. The signal is developed using an Enhanced Chemiluminescent detection (ECL) kit (Catalog # EK1002) with Tanon 5200 system. A specific band was detected for GFAP at approximately 50 kDa. The expected band size for GFAP is at 50 kDa.

Click image to see more details
IHC analysis of GFAP using anti-GFAP antibody (PA1239).
GFAP was detected in paraffin-embedded section of rat brain tissues. Heat mediated antigen retrieval was performed in citrate buffer (pH6, epitope retrieval solution) for 20 mins. The tissue section was blocked with 10% goat serum. The tissue section was then incubated with 1μg/ml rabbit anti-GFAP Antibody (PA1239) overnight at 4°C. Biotinylated goat anti-rabbit IgG was used as secondary antibody and incubated for 30 minutes at 37°C. The tissue section was developed using Strepavidin-Biotin-Complex (SABC)(Catalog # SA1022) with DAB as the chromogen.

Click image to see more details
IHC analysis of GFAP using anti-GFAP antibody (PA1239).
GFAP was detected in a paraffin-embedded section of human brain tissue. Heat mediated antigen retrieval was performed in EDTA buffer (pH 8.0, epitope retrieval solution). The tissue section was blocked with 10% goat serum. The tissue section was then incubated with 2 μg/ml rabbit anti-GFAP Antibody (PA1239) overnight at 4°C. Peroxidase Conjugated Goat Anti-rabbit IgG was used as secondary antibody and incubated for 30 minutes at 37°C. The tissue section was developed using HRP Conjugated Rabbit IgG Super Vision Assay Kit (Catalog # SV0002) with DAB as the chromogen.

Click image to see more details
IHC analysis of GFAP using anti-GFAP antibody (PA1239).
GFAP was detected in a paraffin-embedded section of mouse brain tissue. Heat mediated antigen retrieval was performed in EDTA buffer (pH 8.0, epitope retrieval solution). The tissue section was blocked with 10% goat serum. The tissue section was then incubated with 1 μg/ml rabbit anti-GFAP Antibody (PA1239) overnight at 4°C. Peroxidase Conjugated Goat Anti-rabbit IgG was used as secondary antibody and incubated for 30 minutes at 37°C. The tissue section was developed using HRP Conjugated Rabbit IgG Super Vision Assay Kit (Catalog # SV0002) with DAB as the chromogen.

Click image to see more details
IHC analysis of GFAP using anti-GFAP antibody (PA1239).
GFAP was detected in a paraffin-embedded section of human brain tissue. Heat mediated antigen retrieval was performed in EDTA buffer (pH 8.0, epitope retrieval solution). The tissue section was blocked with 10% goat serum. The tissue section was then incubated with 1 μg/ml rabbit anti-GFAP Antibody (PA1239) overnight at 4°C. Peroxidase Conjugated Goat Anti-rabbit IgG was used as secondary antibody and incubated for 30 minutes at 37°C. The tissue section was developed using HRP Conjugated Rabbit IgG Super Vision Assay Kit (Catalog # SV0002) with DAB as the chromogen.

Click image to see more details
IF analysis of GFAP using anti-GFAP antibody (PA1239).
GFAP was detected in paraffin-embedded section of mouse brain tissues. Heat mediated antigen retrieval was performed in citrate buffer (pH6, epitope retrieval solution ) for 20 mins. The tissue section was blocked with 10% goat serum. The tissue section was then incubated with 1μg/mL rabbit anti-GFAP Antibody (PA1239) overnight at 4°C. Cy3 Conjugated Goat Anti-Rabbit IgG (BA1032) was used as secondary antibody at 1:100 dilution and incubated for 30 minutes at 37°C. The section was counterstained with DAPI. Visualize using a fluorescence microscope and filter sets appropriate for the label used.

Click image to see more details
IHC analysis of GFAP using anti-GFAP antibody (PA1239).
GFAP was detected in a spinal cord. Heat mediated antigen retrieval was performed in EDTA buffer (pH 8.0, epitope retrieval solution). The tissue section was blocked with 10% horse serum. The tissue section was then incubated with anti-GFAP antibody (PA1239) at 1:500 overnight at 4°C. Peroxidase Conjugated Goat Anti-rabbit IgG was used as secondary antibody and incubated for 30 minutes at 37°C. The tissue section was developed using confocal microscope.

Click image to see more details
IF analysis of GFAP using anti-GFAP antibody (PA1239).
GFAP was detected in a paraffin-embedded section of rat brain tissue. Heat mediated antigen retrieval was performed in EDTA buffer (pH 8.0, epitope retrieval solution). The tissue section was blocked with 10% goat serum. The tissue section was then incubated with 1:500 rabbit anti-GFAP Antibody (PA1239) overnight at 4°C. DyLight 550-conjugated Goat Anti-Rabbit was used as secondary antibody incubated for 1 hour at RT. The section was counterstained with DAPI. Visualize using a fluorescence microscope and filter sets appropriate for the label used.

Click image to see more details
TUDCA treatment promoted remyelination. A . Immunofluorescent images of spinal cord on day 14 post-SCI showing the distribution of MBP (green) and GFAP in the lesion site. B , C Western blot analysis and quantification data of MBP expression in each group. All experiments were performed in triplicated and data were presented as means ± SD, n =3 per group. * P < 0.05, ** P < 0.01
Index in PubMed under a CC BY license. PMID: 34544428

Click image to see more details
TUDCA decreased the damage of tissue and neurons after SCI. A Co-immunofluorescence images showed GFAP (red) and MAP2 (green) 14 days after SCI. B Quantification of the distance from neurons to the lesion center from MAP2 immunofluorescence. C Quantification of the fibrotic scar surrounding by reactive astrocytes of spinal cord from GFAP immunofluorescence. ** P < 0.01
Index in PubMed under a CC BY license. PMID: 34544428

Click image to see more details
BSHX decoction promoted NSCs proliferation and neuronal differentiation. A , D BrdU labeling analysis in NSCs proliferation. B , E Immunofluorescent staining of GFAP after neural differentiation. C , F Immunofluorescent staining of NeuN after neural differentiation. All experiments were performed in triplicated and data were presented as means ± SD, n = 3 per group. * P < 0.05, ** P < 0.01
Index in PubMed under a CC BY license. PMID: 35820953

Click image to see more details
Chronic noise exposure causes persistent overexpression of GFAP in the hippocampus. ( A ) Comparison of GFAP mRNA expression levels at different time points in control and noise-exposed rats by quantitative real-time PCR. ( B,D ) Western blot analysis of GFAP and IBA1 under C (control) and N (chronic noise exposure) conditions at different time points. GAPDH was used as a loading control. The immunoreactive band density was quantified and presented as the percent change relative to control samples ( C,E ). Bars represent means ± S.D. *p < 0.05 and **p < 0.01, compared with respective controls by Student’s t -test (n = 6 per group).
Index in PubMed under a CC BY license. PMID: 26251361

Click image to see more details
NSA or Mdivi-1 attenuated the activation of microglia and astrocytes and the release of inflammatory cytokines in the hippocampus of SAE mice. A Representative images of Iba-1 (green) in the hippocampal CA1 region. B Quantification of Iba-1 fluorescence hippocampal CA1 region. C Representative images of GFAP (red) in the hippocampal CA1 region. D Quantification of GFAP fluorescence hippocampal CA1 region. Data are presented as mean ± SEM ( n = 4–6 mice/group). DAPI staining is shown in blue. Scale bar = 50 μm. E – G Representative western blotting and quantitative analysis of the protein levels of IL-1β, IL-18 and TNF-a in the hippocampus. Data are presented as the mean ± SEM ( n = 4 mice/group). * P < 0.05, ** P < 0.01 versus the indicated groups
Index in PubMed under a CC BY license. PMID: 38627764

Click image to see more details
TUDCA promoted neuron regeneration along endogenous NSCs migration at day 7 after SCI. (A) Co-immunofluorescence showed endogenous NSCs (Nestin, green) and reactive astrocytes (GFAP, red) at the margin of the lesion site at day 7 after SCI. (B) Endogenous NSCs (Nestin, green) and neuron (NeuN, red) at the margin of the lesion site at day 7 after SCI. (C, D) Quantitative polymerase chain reaction (qPCR) showing the expression of Nestin, GFAP, NeuN, MAP2 and Oligo 2 at day 7 after SCI. All experiments were performed in triplicated and data were presented means ± SEM, n = 3 per group. *P < 0.05, **P < 0.01.
Index in PubMed under a CC BY license. PMID: 40276612

Click image to see more details
TUDCA regulated macrophages and reactive astrocytes distribution. Co-immunofluorescence images showed macrophages (CD68, red) and reactive astrocytes (GFAP, green) at day 3 and day 7 after SCI.
Index in PubMed under a CC BY license. PMID: 40276612

Click image to see more details
TUDCA regulated monocytes distribution and impacted glial scar formation. Co-immunofluorescence images showed reactive astrocytes (GFAP, green) and monocytes (CD11b, red) at day 3 and day 7 after SCI.
Index in PubMed under a CC BY license. PMID: 40276612

Click image to see more details
TIGAR regulates the differentiation of NSCs. a Quantification of the mRNA levels of Tigar , Map2 , Gfap , Neurod1 , Ngn1 , and Rest in the Lenti- siSCR - and Lenti- siTigar -treated groups of cultured NSCs. b , c Representative immunoblots and relative quantification of Tuj1, GFAP, and TIGAR after knockdown of TIGAR in NSCs. d Quantification of the mRNA levels of Tigar , Map2 , Gfap , Neurod1 , Ngn1 , and Rest in the Lenti- Gfp - and Lenti- Tigar -treated groups in cultured NSCs. e , f Representative immunoblots and relative quantification of Tuj1, GFAP, and TIGAR after overexpression of TIGAR in NSCs. g Double immunofluorescent staining showed that knockdown of TIGAR (GFP, green) decreased the expression of Tuj1 (red) and impaired neuronal differentiation of NSCs. The right panel shows the quantitative ratio of Tuj1 + GFP + to GFP + cells in the Lenti- siSCR and Lenti- siTigar groups. h Double immunofluorescent staining revealed that knockdown of TIGAR (GFP, green) also decreased expression of GFAP (red) and inhibited astrocytes differentiation of NSCs. The right panel shows the quantitative ratio of GFAP + GFP + to GFP + cells in the Lenti- siSCR and Lenti- siTigar groups. Scale bar = 50 μm. * p < 0.05, ** p < 0.01, t -test. Data represent the mean of at least three independent experiments ± SEM
Index in PubMed under a CC BY license. PMID: 30814486

Click image to see more details
TIGAR promotes NSC differentiation by upregulating the level of acetyl-CoA and the acetylation of H3K9. a Western blot analysis of whole-cell lysates showed that H3K9 acetylation was reduced after treatment with Lenti- siTigar . b Western blot analysis showed that Lenti- Tigar significantly increased H3K9 acetylation during NSC differentiation. c Lenti- siTigar decreased the accumulation of H3K9ac on the promoters of Ngn1 , Neurod1 , and Gfap . NSCs were immunoprecipitated with anti-acetyl-H3K9 antibody and analyzed using gene-specific ChIP primers. Rabbit IgG was used as a negative control. DNA from each ChIP sample was normalized to the corresponding input sample. d Acetyl-CoA production in Lenti- siSCR , Lenti- siSCR + Acetate, and Lenti- siTigar + Acetate group. e Western blot analysis showed that supplementation of acetate in cultured medium increased H3K9 acetylation and rescued the effect of Lenti- siTigar on the decrease in H3K9 acetylation in NSCs. f Quantification of the mRNA levels of Map2 and Gfap after treatment with acetate and Lenti- siTigar in cultured NSCs. Acetyl-CoA can be generated from acetate by acetyl-CoA synthetase independently of citrate. g Western blot analysis showed that acetate rescued the effect of Lenti- siTigar on the decrease in Tuj1 and GFAP protein levels. * p < 0.05, ** p < 0.01. Data represent the mean of at least three independent experiments ± SEM
Index in PubMed under a CC BY license. PMID: 30814486

Click image to see more details
LWD reduced the Aβ and inflammatory response in the hippocampus of the APP/PS1 mice and the activated number of glial cells. (A) Positive expression of Aβ in each group in immunofluorescence. (B) Quantitative histogram of Aβ positive expression in each group. (C) Positive expression of IBA1 in each group in immunofluorescence. (D) Quantitative histogram of IBA1 positive expression in each group. (E) Positive expression of GFAP in each group in immunofluorescence. (F) Quantitative histogram of GFAP positive expression in each group. (G–I) Protein expression and quantitative histogram of pro-inflammatory factors IL-1β and IL-10 in each group. ( n = 3, compared with the WT group, # p < 0.05, ## p < 0.01, ### p < 0.001; compared with the APP/PS1 group, * p < 0.05, ** p < 0.01).
Index in PubMed under a CC BY license. PMID: 37920210

Click image to see more details
Neuron and astrocyte immunohistochemical analysis and mRNA expression of GABA A receptor subunits. a Outline of sagittal section of mouse brain, showing the brain regions analyzed using immunohistochemical staining. b – i Coronal sections stained through fluorescence-labeling of: b NeuN in anterior cingulate cortex (ACC); c NeuN in hippocampus (HC); d DCX in dentate gyrus (DG); e parvalbumin (PV) in ACC; f PV in piriform cortex (PC); g PV in DG; h GFAP in CA1 region; and i GFAP in DG. The DG, CA1, and CA3 regions in hippocampus are indicated in part ( c ). NeuN and PV immunofluorescence are displayed in green (scale bar = 300 μm), and that of DCX and GFAP and DCX displayed in red (scale bar = 120 μm). The plots show immunofluorescence densities for WT (green dots) and KO (red dots) estimated in terms of average area optical density (in parts b , c , e , h , and i ), or in terms of the number of immunoreactive cells (in parts d , f , g ); in each instance, five randomly selected images from each of five WT or KO male mice were examined. The levels of mRNA expression for 13 different GABA A receptor subunits in WT and KO mouse cerebrum ( j ) and cerebellum ( k ) were measured using quantitative RT-PCR, and the mRNA levels in KO mice were normalized to the average expression level in WT ( n = 10 in each group). The measured expression levels in WT, KO as well as HT brains are given in Supplementary Table . Statistical analysis was performed using unpaired t -test for immunohistochemical staining and one-way ANOVA with Newman–Keuls post-hoc test for mRNA quantitation. Average y values ± SEM in the different plots are represented by horizontal bars; WT is represented by green dots and KO by red dots. N.D. represents non-detectable; * p < 0.05, ** p < 0.01, *** p < 0.001
Index in PubMed under a CC BY license. PMID: 30013074

Click image to see more details
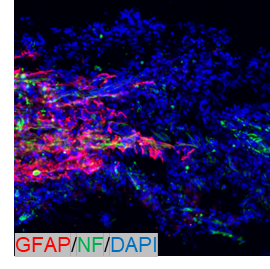
EX-Netrin1 improved functional recovery and reduced histopathological injury in SCI rats. ( A ) MRI was used to detect spinal cord injury in rats after 28 days. The red dotted box indicated the site of spinal cord injury. ( B ) BBB score was used to evaluate the functional recovery of hind limbs in rats. ( C ) After 28 days, spinal cord tissue was collected and ELISA was performed to detect the contents of TNF-α, IL-1β and IL-6 in spinal cord. ( D ) HE and Nissl staining of spinal cord tissues. Red arrows indicated Nissl bodies. Scale bar: 50 μm. ( E - F ) Representative images showing neurofilaments (NFs, green) and glial fibrillary acidic protein (GFAP, red) staining of spinal cord tissues, and (F) the density ratios of NFs. (Error bars showed means ± SD; n = 8. *P < 0.05, **P < 0.01, ***P < 0.001, vs. Sham group; # P < 0.05, ## P < 0.01, ### P < 0.001, vs. Model+PBS group; ^P < 0.05, ^^P < 0.01, ^^^P < 0.001, vs. Model+EX-MSCs group; $ P < 0.05, $$ P < 0.01, $$$ P < 0.001, vs. Model+EX-NC group)
Index in PubMed under a CC BY license. PMID: 36647161

Click image to see more details
Physical exercise decreased the number of A1 neurotoxic astrocytes. (A) Representative immunofluorescence images for GFAP (green) and C3 (red) double staining of rats in each group in the corpus callosum. Scale bar = 50 μm. (B) The quantification of GFAP positive astrocytes and (C) C3/GFAP positive A1 astrocytes. n = 6. Experimental data are expressed as the means ± SD. * P < 0.05, ** P < 0.01, *** P < 0.001. GFAP, glial fibrillary acidic protein; C3, complement 3.
Index in PubMed under a CC BY license. PMID: 35721009

Click image to see more details
Optogenetic stimulation of ChR2-expressing astrocytes attenuates KA-induced neocortical seizures. a Schematic of viral injection, stimulation and EEG recording in GFAP-ChR2 M1 mice. b Fluorescent image showed restricted expression of ChR2-EYFP in M1. Scale bar, 200 μm. c Left, fluorescent image of ChR2 (green) showed co-localization with GFAP + astrocytes (red). Right, fluorescent image of ChR2 (green) showed no co-localization with NeuN + neurons (red). Scale bar, 20 μm. d Light pulses induced inward currents in ChR2-expressing astrocyte in a cortical slice. Voltage responses from a ChR2-expressing astrocyte evoked by 10-pA step current from 0 to 300 pA. e Paradigms of blue light stimulation in different phases of KA-induced seizures. f Effects of optogenetic stimulation of astrocytes on the development of seizure stage during 90 min after KA injection. g – j Effects of different-phase optogenetic stimulation of astrocytes on seizure stage ( g ), EEG onset ( h ), latency to GS ( i ) and number of GSs ( j ) in KA-induced seizures. k Representative EEGs and corresponding energy spectra recorded from the M1 during KA-induced seizures. l Schematic of viral injection (LM1), stimulation (LM1) and EEG recording (RM1) in GFAP-ChR2 M1 mice. m Effects of optogenetic stimulation of LM1 astrocytes on the development of seizure stage during 90 min after KA injection. n – q Effects of optogenetic stimulation of LM1 astrocytes on seizure stage ( n ), EEG onset ( o ), latency to GS ( p ) and number of GSs ( q ) after RM1 KA injection. ** p < 0.01, *** p < 0.001, **** p < 0.0001 compared with EYFP control. Data shown as mean ± s.e.m. The number of mice used is indicated in figures. For detailed statistical information, see Supplementary Data . Source data are provided as a Source Data file.
Index in PubMed under a CC BY license. PMID: 36414629

Click image to see more details
Physical exercise augmented the expression and length of primary cilia in astrocytes. (A) Representative immunofluorescence images for GFAP (green) and ARL13B (red) double staining of rats in each group in the corpus callosum. Scale bar = 50 μm. (B) Quantification of the percentage of astrocytes containing primary cilia. (C) Quantification of length of astrocytic primary cilia. n = 6. Experimental data are expressed as the means ± SD. * P < 0.05. ARL13B, ADP-ribosylation factor-like 13B.
Index in PubMed under a CC BY license. PMID: 35721009

Click image to see more details
Cell identification results: The results of cell identification showed these cells were astrocytes through positive staining for GFAP, vimentin and Connexin43(CX43). Negative staining for Aquaporin 4 (AQP4), OSP and F4/80 was also shown. Scale bar: 100 μm
Index in PubMed under a CC BY license. PMID: 36114477

Click image to see more details
TUDCA promoted axonal regeneration after SCI. A Co-immunofluorescence images showed the loss of neurons NeuN (red) and axon regeneration GAP43 (green) in the lesion site 14 days after SCI. B Co-immunofluorescence images showed the axonal regeneration (GAP43, green; GFAP, red) in the fibrotic scar on day 14 post-SCI. C – E Western blot analysis and quantification of GFAP and GAP43 expression. All experiments were performed in triplicated and data were presented as means ± SD, n =3 per group. * P < 0.05, ** P < 0.01
Index in PubMed under a CC BY license. PMID: 34544428

Click image to see more details
Optogenetic stimulation of ChR2-expressing astrocytes activity-dependently inhibits firing of pyramidal neurons. a Schematic of in vivo single-unit recording in naïve GFAP-ChR2 M1 mice. Astrocyte (green), Neuron (red). b The online recording process and offline sorting process of in vivo single-unit recording of putative pyramidal neuron with wide waveform. Inset panel, corresponding protrude autocorrelation of a representative putative pyramidal neuron. c Summary data of the responses of recorded M1 pyramidal neurons during astrocyte stimulation. d – f Representative peri-event raster histograms and time-frequency statistical charts showed the response of blue light stimulation in different frequency groups. g Schematic of in vivo single-unit recording in GFAP-ChR2 M1 mice in KA-induced seizure status. h Left panel, representative spikes and local field potentials of M1 pyramidal neurons during interictal and seizure phases. Right panel, quantification of the frequency of M1 pyramidal neurons during interictal and seizure phases. i Summary data of the responses of recorded M1 pyramidal neurons during astrocyte stimulation in KA-induced seizure status. j Time-frequency statistical charts showed the response of blue-light stimulation in different frequency groups in KA-induced seizure status. k Schematic of in vivo single-unit recording in RM1 after RM1 KA injection and LM1 blue light stimulation. l Summary data of the responses of recorded RM1 pyramidal neurons during astrocytes stimulation after RM1 KA injection and LM1 blue light stimulation. m , n Time-frequency statistical charts showed the response of blue-light stimulation in different frequency groups in KA-induced seizure status. ** p < 0.01 compared with interictal phase. Data shown as mean ± s.e.m. The number of mice used is indicated in figures. For detailed statistical information, see Supplementary Data . Source data are provided as a Source Data file.
Index in PubMed under a CC BY license. PMID: 36414629

Click image to see more details
Western blot analysis of specific protein expression ( n = 3). ( A ) Colored bands of GFAP, LRP6, THBS1 and CD81; ( B ) Expression levels of LRP6, THBS1 and CD81 gradually decreased with the increase of the stretch amplitude, while the expression level of GFAP gradually increased with the increase of the stretch amplitude. Error bars indicate standard error of the mean (SEM); * P < 0.05 and ** P < 0.01 indicate statistical significance
Index in PubMed under a CC BY license. PMID: 36114477

Click image to see more details
Astrocytic calcium signaling is not required to produce the anti-seizure effects induced by optogenetic stimulation of astrocytes. a GFAP-Cre mice were injected with Cre-dependent virus expressing GCAMP6m-GFP or ChR2-EYFP in the M1 and implanted with cannula and electrode for drug injection, blue light stimulation and EEG recording. b Typical calcium signals and corresponding seizure EEGs in KA or KA + TG/BAPTA-AM injection groups. Δ F/F represents the change in signal amplitude from the base level. c Effects of optogenetic stimulation of astrocytes on the development of seizure stage, in the condition of calcium signaling inhibition by TG or BAPTA-AM injection. d – g Effects of optogenetic stimulation of astrocytes on seizure stage ( d ), EEG onset ( e ), latency to GS ( f ) and number of GSs ( g ), in the condition of calcium signaling inhibition by TG or BAPTA-AM injection. h GFAP-Cre mice were injected with Cre-dependent virus expressing GCAMP6m-GFP and/or hM3D(Gq)-mCherry in the M1 and implanted with cannula and electrode for KA injection and EEG recording. i Typical calcium signals before and after CNO injection indicating hM3Dq-mediated increase of calcium signaling. Δ F/F represents the change in signal amplitude from the base level. j Effects of chemogenetic activation of astrocytes on the development of seizure stage during 90 min after KA injection. k – n Effects of chemogenetic activation of astrocytes on the seizure stage ( k ), EEG onset ( l ), latency to GS ( m ) and number of GSs ( n ) in different groups. ** p < 0.01, *** p < 0.001, **** p < 0.0001 compared with each control group. l * p < 0.05 compared with mCherry-CNO group, # p < 0.05 compared with hM3Dq-Saline group. Data shown as mean ± s.e.m. The number of mice used is indicated in figures. For detailed statistical information, see Supplementary Data . Source data are provided as a Source Data file.
Index in PubMed under a CC BY license. PMID: 36414629

Click image to see more details
TIGAR is specifically increased during differentiation of NSCs. a – c Quantification of the mRNA levels of Tigar , Nestin , and Sox2 during proliferation of NSCs. d – f Quantification of the mRNA levels of Tigar , Gfap and Map2 during differentiation of NSCs. * p < 0.05, ** p < 0.01, one-way ANOVA. Data represent the mean of at least three independent experiments ± SEM
Index in PubMed under a CC BY license. PMID: 30814486

Click image to see more details
BSHX decoction reduced reactive astrocytosis after SCI. A Immunofluorescence images showed the reactive astrocytosis (GFAP, red) at day 3 and 7 after SCI. B Immunofluorescence images showed the neural stem cell (Nestin, green) in the lesion epicenter at day 3 and 7 after SCI. C Quantitative polymerase chain reaction (qPCR) showing the expression of GFAP after SCI. D Quantification of Nestin positive cells in the lesion epicenter. All experiments were performed in triplicated and data were presented as means ± SD, n = 3 per group. * P < 0.05, ** P < 0.01
Index in PubMed under a CC BY license. PMID: 35820953

Click image to see more details
TIGAR has no effect on the cell survival or proliferation of NSCs. a , b Quantification of the mRNA levels of Sox2 , Nestin , Ki67 , Map2 , and Gfap in the Lenti- Gfp - and Lenti- Tigar -treated groups of proliferated NSCs. c TUNEL staining (green) in cultured NSCs treated with Lenti- siSCR or Lenti- siTigar during the differentiation stage. The right panel shows the quantification of TUNEL-positive cells in the Lenti- siSCR and Lenti- siTigar groups. Scale bar = 50 μm. d During the differentiation stage, there was no significant difference in the number of dividing NSCs in the Lenti- siSCR and Lenti- siTigar groups. The right panel shows the quantification of EdU-positive cells in the Lenti- siSCR and Lenti- siTigar groups. Scale bar = 50 μm. * p < 0.05, ** p < 0.01, t -test. Data represent the mean of at least three independent experiments ± SEM
Index in PubMed under a CC BY license. PMID: 30814486

Click image to see more details
Astrocytic Na + -K + -ATPase mediates the anti-seizure effect of optogenetic stimulation of astrocytes. a GFAP-Cre mice were injected with Cre-dependent ChR2-mCherry and/or pAAV-shortGFAP-MCS-EGFP-3FLAG-mir30shRNA(Atp1α2) in the M1 and implanted with cannula and electrode for KA injection, blue light stimulation and EEG recording. b Fluorescent images showed that shRNA (green) showed co-localization with GFAP + astrocytes (red), and ATP1A2 protein co-localization with GFAP + shRNA(NC) + astrocytes from control shRNA(NC) injected cortical tissue. ATP1A2 protein expression in the GFAP + astrocytes is significantly reduced in shRNA(Atp1α2) injected cortical tissue. Scale bar, 20 μm. c Effects of optogenetic stimulation of astrocytes on the development of seizure stage, in the condition of astrocytic Na + -K + -ATPase inhibition. d – g Effects of optogenetic stimulation of astrocytes on seizure stage ( d ), EEG onset ( e ), latency to GS ( f ) and number of GSs ( g ), in the condition of astrocytic Na + -K + -ATPase inhibition. h – j Representative peri-event raster histograms and statistical data of firing rate of pyramidal neurons in GFAP-ChR2 M1 mice in response to blue light stimulation during in vivo single-unit recording, in the condition of Na + -K + -ATPase inhibition by ouabain ( h , i ) or shRNA-knockdown ( j , k ). l , m Rest membrane potential of astrocytes ( l ) and their changes ( m ) before and after blue light stimulation in GFAP-ChR2 M1 slices under normal and KA incubation conditions. n In vivo CSF potassium concentration before and after KA incubation in GFAP-ChR2 M1 mice under sham and blue light stimulation conditions. * p < 0.05, ** p < 0.01, *** p < 0.001, **** p < 0.0001; # p < 0.05, ## p < 0.01, ### p < 0.001. Data shown as mean ± s.e.m. The number of mice used is indicated in figures. For detailed statistical information, see Supplementary Data . Source data are provided as a Source Data file.
Index in PubMed under a CC BY license. PMID: 36414629

Click image to see more details
Adam10 overexpression suppresses hippocampal neuroinflammation in TLE mice. a Western blotting showing the protein levels of inflammation-related proteins iNOS and COX-2 and NF-κB in the hippocampus of Vehicle Ctrl, AAV-Ctrl, and AAV-Adam10-treated TLE mice. b – d Bar graphs showing the quantification of iNOS ( F 2,12 = 9.86, p = 0.024, AAV-Adam10 vs Vehicle Ctrl; p = 0.003, AAV-Adam10 vs AAV-Ctrl), COX-2 ( F 2,12 = 11.27, p = 0.003, AAV-Adam10 vs Vehicle Ctrl; p = 0.007, AAV-Adam10 vs AAV-Ctrl), and NF-κB ( F 2,12 = 11.05, p = 0.004, AAV-Adam10 vs Vehicle Ctrl; p = 0.005, AAV-Adam10 vs AAV-Ctrl), which were represented as the intensity ratios of these proteins to β-actin ( n = 5). e , f Bar graphs showing the concentration of IL-1β ( F 2,12 = 0.59, p = 0.572) and TNF-α ( F 2,12 = 10.11, p = 0.004, AAV-Adam10 vs Vehicle Ctrl; p = 0.009, AAV-Adam10 vs AAV-Ctrl) in the hippocampus of Ctrl, AAV-Ctrl, and AAV-Adam10-treated TLE mice as detected by ELISA ( n = 5). g Representative images of the immunostaining of Iba-1 and GFAP in the hippocampal CA1 region of the Ctrl, AAV-Ctrl, and AAV-Adam10 mice, respectively. h , i Bar graphs showing the quantification of Iba-1- ( F 2,12 = 7.31, p = 0.012, AAV-Adam10 vs Vehicle Ctrl; p = 0.024, AAV-Adam10 vs AAV-Ctrl) and GFAP ( F 2,12 = 4.61, p = 0.039, AAV-Adam10 vs Vehicle Ctrl; p = 0.042, AAV-Adam10 vs AAV-Ctrl)-positive cells in the hippocampal CA1 region of the Ctrl, AAV-Ctrl, and AAV-Adam10 mice, respectively ( n = 4). * p < 0.05, ** p < 0.01, and one-way ANOVA. Scale bar = 50 μm in g
Index in PubMed under a CC BY license. PMID: 30075790

Click image to see more details
BSHX decoction decreased the damage of tissue and promoted axon regeneration after SCI. A Co-immunofluorescence images showed GFAP (red) and MAP2 (green) at day 14 after SCI. B Co-immunofluorescence images showed the axonal regeneration (GFAP, red; GAP43, green) in the lesion site at day after SCI. FS Fibrotic scar
Index in PubMed under a CC BY license. PMID: 35820953

Click image to see more details
Adam10 knockdown exacerbates hippocampal neuroinflammation in TLE mice. a Western blotting showing the protein levels of the inflammation-related proteins iNOS and COX-2 and NF-κB in the hippocampus of Vehicle Ctrl, shRNA-Ctrl, and shRNA-Adam10-treated TLE mice. b – d Bar graphs showing the quantification of iNOS ( F 2,12 = 32.09, p < 0.001, shRNA-Adam10 vs Vehicle Ctrl; p < 0.001, shRNA-Adam10 vs shRNA-Ctrl), COX-2 ( F 2,12 = 5.32, p = 0.035, shRNA-Adam10 vs Vehicle Ctrl; p = 0.041, shRNA-Adam10 vs shRNA-Ctrl), and NF-κB ( F 2,12 = 5.82, p = 0.020, shRNA-Adam10 vs Vehicle Ctrl; p = 0.049, shRNA-Adam10 vs shRNA-Ctrl), which were represented as the intensity ratios of these proteins to β-actin ( n = 5). e , f Bar graphs showing the concentration of IL-1β ( F 2,12 = 12.78, p = 0.003, shRNA-Adam10 vs Vehicle Ctrl; p = 0.003, shRNA-Adam10 vs shRNA-Ctrl) and TNF-α ( F 2,12 = 5.66, p = 0.035, shRNA-Adam10 vs Vehicle Ctrl; p = 0.030, shRNA-Adam10 vs shRNA-Ctrl) in the hippocampus of Vehicle Ctrl, shRNA-Ctrl, and shRNA-Adam10-treated TLE mice, as detected by ELISA ( n = 5). g Representative images of the immunostaining of Iba-1 and GFAP in the hippocampal CA1 region of the Vehicle Ctrl, shRNA-Ctrl, and shRNA-Adam10 mice, respectively. h , i Bar graphs showing the quantification of Iba-1- ( F 2,12 = 4.70, p = 0.047, shRNA-Adam10 vs shRNA-Ctrl) and GFAP ( F 2,12 = 4.88, p = 0.039, shRNA-Adam10 vs shRNA-Ctrl)-positive cells in the hippocampal CA1 region of the Vehicle Ctrl, shRNA-Ctrl, and shRNA-Adam10 mice, respectively ( n = 4). * p < 0.05, ** p < 0.01, *** p < 0.001, and one-way ANOVA. Scale bar = 50 μm in g
Index in PubMed under a CC BY license. PMID: 30075790

Click image to see more details
Optogenetic-driven astrocytic Na + -K + -ATPase rescues seizure susceptibility of FCD rats. a Establishment of FCD model in SD rats and timeline design for behavioral experiments. b Representative immunostaining images showed NeuN + cells in nondysplastic (control) and dysplastic (FCD) cortex. Scale bar, 50 μm and 25 μm. c Representative cortical EEG traces recorded from dysplastic FCD rat showed several forms of spontaneous epileptic waves. d Representative energy spectra from control and FCD rats injected with PTZ. e – h Seizure susceptibility of control and FCD rats was tested after PTZ injection (i.p. injection, 60 mg/kg) and seizure stage ( e ), EEG onset ( f ), latency to GS ( g ) and GS duration ( h ) were recorded. i Fluorescent images showed the expression pattern of Na + -K + -ATPase protein (ATP1A2) in control and FCD cortical tissue. j Representative western blot bands and quantification of Na + -K + -ATPase protein (ATP1A2) expression in control and FCD cortex. GAPDH was used as the internal control. k FCD rats were injected with ChR2-EYFP and/or pAAV-shortGFAP-MCS-EGFP-3FLAG-mir30shRNA(Atp1α2) in the M1 and implanted with fiber and electrode for blue light stimulation and EEG recording. l Fluorescent images showed shRNA(Atp1α2) co-localization with GFAP + astrocytes and knockdown of astrocytic Na + -K + -ATPase protein (ATP1A2) expression in FCD cortical tissue. Scale bar, 20 μm. m – p Effects of optogenetic stimulation of astrocytes on seizure stage ( m ), EEG onset ( n ), latency to GS ( o ) and GS duration ( p ) in FCD-ChR2 M1 rats, in the condition of astrocytic Na + -K + -ATPase inhibition by shRNA-knockdown. * p < 0.05, ** p < 0.01, *** p < 0.001 compared with each control group. Data shown as mean ± s.e.m. The number of mice used is indicated in figures. For detailed statistical information, see Supplementary Data . Uncropped version of western blots that labeled with the relevant panel and antibody were provided in Source data western blot. Source data are provided as a Source Data file.
Index in PubMed under a CC BY license. PMID: 36414629

Click image to see more details
Physical exercise enhanced the expression of A2 neuroprotective astrocytes. (A) Representative immunofluorescence images for GFAP (green) and S100A10 (red) double staining of rats in each group in the corpus callosum. Scale bar = 50 μm. (B) The quantification of GFAP positive astrocytes and (C) S100A10/GFAP positive A2 astrocytes. n = 6. Experimental data are expressed as the means ± SD. * P < 0.05, ** P < 0.01, *** P < 0.001. S100A10, S100 calcium binding protein A10.
Index in PubMed under a CC BY license. PMID: 35721009
Specific Publications For Anti-GFAP Antibody Picoband® (PA1239)
Loading publications
Recommended Resources
Here are featured tools and databases that you might find useful.
- Boster's Pathways Library
- Protein Databases
- Bioscience Research Protocol Resources
- Data Processing & Analysis Software
- Photo Editing Software
- Scientific Literature Resources
- Research Paper Management Tools
- Molecular Biology Software
- Primer Design Tools
- Bioinformatics Tools
- Phylogenetic Tree Analysis
Customer Reviews
Have you used Anti-GFAP Antibody Picoband®?
Share your experimental results or join a short interview to earn up to $1,000 in product credits or other rewards.
2 Reviews For Anti-GFAP Antibody Picoband®
Accurate localization and good imaging quality
Excellent
| SKU | PA1239 |
|---|---|
| Application | Immunofluorenscence |
| Sample | Rat Brain |
| Sample Processing Description | Fixed in 4% paraformaldehyde for 48 hours, followed by paraffin embedding and sectioning. |
| Primary Antibody | Anti-GFAP antibody |
| Primary Incubation | 1:500, overnight at 4 ℃ |
| Blocking Agent | Goat serum |
| Secondary Antibody | DyLight 550-conjugated goat anti-rabbit antibody. |
| Secondary Incubation | Incubate at room temperature for 1 hour |
| Detection | Laser confocal microscopy |
| Results Summary | During the experiment, this primary antibody can be conveniently used with the complimentary antibody diluent provided. The results obtained showed good quality and reproducibility, with no false-positive signals. Overall, this primary antibody offers excellent cost performance and provides key data and strong support for publication. |
Jian Cao, Zhejiang University
Verified customer
Submitted 2025-10-17
This Antibody Works Perfectly!--Maria Teresa Dell'Anno, NEUROSCIENCE, YALE UNIVERSITY, POSTDOC
Excellent

Source: Biocompare.com
| SKU | PA1239 |
|---|---|
| Applications | Immunohistochemistry |
| Sample | Spinal cord |
| Detection | Confocal microscope |
"I used it for IHC on frozen sections at a dilution of 1:500. It did not need several trials to optimize the protocol. No bad things overall. I will purchase it again."
Maria Teresa Dell'Anno
Verified customer
Submitted 2016-08-24
Customer Q&As
Have a question?
Find answers in Q&As, reviews.
Can't find your answer?
Submit your question
16 Customer Q&As for Anti-GFAP Antibody Picoband®
Question
Is a blocking peptide available for product anti-GFAP antibody (PA1239)?
Verified Customer
Verified customer
Asked: 2020-05-06
Answer
We do provide the blocking peptide for product anti-GFAP antibody (PA1239). If you would like to place an order for it please contact support@bosterbio.com and make a special request.
Boster Scientific Support
Answered: 2020-05-06
Question
Will PA1239 anti-GFAP antibody work on parafin embedded sections? If so, which fixation method do you recommend we use (PFA, paraformaldehyde, other)?
Verified Customer
Verified customer
Asked: 2020-04-22
Answer
You can see on the product datasheet, PA1239 anti-GFAP antibody as been validated on IHC. It is best to use PFA for fixation because it has better tissue penetration ability. PFA needs to be prepared fresh before use. Long term stored PFA turns into formalin, as the PFA molecules congregate and become formalin.
Boster Scientific Support
Answered: 2020-04-22
Question
We have been able to see staining in rat fetal brain cortex. Any tips? Is anti-GFAP antibody supposed to stain fetal brain cortex positively?
Verified Customer
Verified customer
Asked: 2020-02-18
Answer
From what I have seen in literature fetal brain cortex does express GFAP. From what I have seen in Uniprot.org, GFAP is expressed in dorsal motor nucleus of vagus nerve, brain thalamus, brain, kidney, fetal brain cortex, fetal brain, blood, among other tissues. Regarding which tissues have GFAP expression, here are a few articles citing expression in various tissues:
Blood, Pubmed ID: 12837269
Brain, Pubmed ID: 15489334
Brain, and Thalamus, Pubmed ID: 14702039
Fetal brain, Pubmed ID: 12058025
Fetal brain cortex, Pubmed ID: 2780570
Kidney, Pubmed ID: 17974005
Boster Scientific Support
Answered: 2020-02-18
Question
I have attached the WB image, lot number and protocol we used for fetal brain using anti-GFAP antibody PA1239. Please let me know if you require anything else.
Verified Customer
Verified customer
Asked: 2019-12-23
Answer
Thank you very much for the data. Our lab team are working to resolve this as quickly as possible, and we appreciate your patience and understanding! You have provided everything we needed. Please let me know if there is anything you need in the meantime.
Boster Scientific Support
Answered: 2019-12-23
Question
Thank you for helping with my inquiry over the phone. Here are the WB image, lot number and protocol we used for fetal brain using anti-GFAP antibody PA1239. Let me know if you need anything else.
L. Rodriguez
Verified customer
Asked: 2019-12-16
Answer
We appreciate the data. You have provided everything we needed. Our lab team are working to resolve your inquiry as quickly as possible, and we appreciate your patience and understanding! Please let me know if there is anything you need in the meantime.
Boster Scientific Support
Answered: 2019-12-16
Question
Can you help my question with product PA1239, anti-GFAP antibody. I was wondering if it would be possible to conjugate this antibody with biotin. I would need it to be without BSA or sodium azide. I am planning on using a buffer exchange of sodium azide with PBS only. Would there be problems for me to conjugate the antibody and store it in -20 degrees in small aliquots?
Verified Customer
Verified customer
Asked: 2019-08-29
Answer
It is not recommended storing this antibody with PBS buffer only in -20 degrees. If you want to store it in -20 degrees it is best to add some cryoprotectant like glycerol. If you want carrier free PA1239 anti-GFAP antibody, we can provide it to you in a special formula with trehalose and/or glycerol. These molecules will not interfere with conjugation chemistry and provide a good level of protection for the antibody from degradation. Please be sure to specify this in your purchase order.
Boster Scientific Support
Answered: 2019-08-29
Question
I was wanting to use your anti-GFAP antibody for IHC for rat fetal brain on frozen tissues, but I want to know if it has been validated for this particular application. Has this antibody been validated and is this antibody a good choice for rat fetal brain identification?
Verified Customer
Verified customer
Asked: 2019-07-22
Answer
You can see on the product datasheet, PA1239 anti-GFAP antibody has been tested for IF, IHC, WB on human, mouse, rat tissues. We have an innovator award program that if you test this antibody and show it works in rat fetal brain in IHC-frozen, you can get your next antibody for free.
Boster Scientific Support
Answered: 2019-07-22
Question
Is this PA1239 anti-GFAP antibody reactive to the isotypes of GFAP?
Z. Carter
Verified customer
Asked: 2019-07-15
Answer
The immunogen of PA1239 anti-GFAP antibody is A synthetic peptide corresponding to a sequence at the C-terminus of human GFAP(417-432aa DGEVIKESKQEHKDVM), identical to the related rat sequence, and different from the related mouse sequence by two amino acids. Could you tell me which isotype you are interested in so I can help see if the immunogen is part of this isotype?
Boster Scientific Support
Answered: 2019-07-15
Question
I see that the anti-GFAP antibody PA1239 works with IHC, what is the protocol used to produce the result images on the product page?
Verified Customer
Verified customer
Asked: 2019-06-12
Answer
You can find protocols for IHC on the "support/technical resources" section of our navigation menu. If you have any further questions, please send an email to support@bosterbio.com
Boster Scientific Support
Answered: 2019-06-12
Question
Is there a BSA free version of anti-GFAP antibody PA1239 available?
Verified Customer
Verified customer
Asked: 2019-05-15
Answer
We appreciate your recent telephone inquiry. I can confirm that some lots of this anti-GFAP antibody PA1239 are BSA free. For now, these lots are available and we can make a BSA free formula for you free of charge. It will take 3 extra days to prepare. If you require this antibody BSA free again in future, please do not hesitate to contact me and I will be pleased to check which lots we have in stock that are BSA free.
Boster Scientific Support
Answered: 2019-05-15
Question
I was wanting to use using your anti-GFAP antibody for regulation of chaperone-mediated autophagy studies. Has this antibody been tested with western blotting on u87 whole cell lysate? We would like to see some validation images before ordering.
Verified Customer
Verified customer
Asked: 2019-03-20
Answer
We appreciate your inquiry. This PA1239 anti-GFAP antibody is validated on rat brain tissue, tissue lysate, mouse brain, u87 whole cell lysate. It is guaranteed to work for IF, IHC, WB in human, mouse, rat. Our Boster guarantee will cover your intended experiment even if the sample type has not been be directly tested.
Boster Scientific Support
Answered: 2019-03-20
Question
Will anti-GFAP antibody PA1239 work for IHC with fetal brain?
Verified Customer
Verified customer
Asked: 2018-12-20
Answer
According to the expression profile of fetal brain, GFAP is highly expressed in fetal brain. So, it is likely that anti-GFAP antibody PA1239 will work for IHC with fetal brain.
Boster Scientific Support
Answered: 2018-12-20
Question
We are currently using anti-GFAP antibody PA1239 for rat tissue, and we are happy with the IHC results. The species of reactivity given in the datasheet says human, mouse, rat. Is it possible that the antibody can work on zebrafish tissues as well?
Verified Customer
Verified customer
Asked: 2018-07-11
Answer
The anti-GFAP antibody (PA1239) has not been tested for cross reactivity specifically with zebrafish tissues, though there is a good chance of cross reactivity. We have an innovator award program that if you test this antibody and show it works in zebrafish you can get your next antibody for free. Please contact me if I can help you with anything.
Boster Scientific Support
Answered: 2018-07-11
Question
I am looking for to test anti-GFAP antibody PA1239 on rat fetal brain for research purposes, then I may be interested in using anti-GFAP antibody PA1239 for diagnostic purposes as well. Is the antibody suitable for diagnostic purposes?
Verified Customer
Verified customer
Asked: 2017-09-19
Answer
The products we sell, including anti-GFAP antibody PA1239, are only intended for research use. They would not be suitable for use in diagnostic work. If you have the means to develop a product into diagnostic use, and are interested in collaborating with us and develop our product into an IVD product, please contact us for more discussions.
Boster Scientific Support
Answered: 2017-09-19
Question
We were content with the WB result of your anti-GFAP antibody. However we have seen positive staining in brain thalamus cytoplasm. using this antibody. Is that expected? Could you tell me where is GFAP supposed to be expressed?
Verified Customer
Verified customer
Asked: 2017-07-19
Answer
From literature, brain thalamus does express GFAP. Generally GFAP expresses in cytoplasm. Regarding which tissues have GFAP expression, here are a few articles citing expression in various tissues:
Blood, Pubmed ID: 12837269
Brain, Pubmed ID: 15489334
Brain, and Thalamus, Pubmed ID: 14702039
Fetal brain, Pubmed ID: 12058025
Fetal brain cortex, Pubmed ID: 2780570
Kidney, Pubmed ID: 17974005
Boster Scientific Support
Answered: 2017-07-19
Question
We purchased anti-GFAP antibody for IF on fetal brain in the past. I am using rat, and We are going to use the antibody for IHC next. I would like examining fetal brain as well as dorsal motor nucleus of vagus nerve in our next experiment. Could you please give me some suggestion on which antibody would work the best for IHC?
H. Dhar
Verified customer
Asked: 2016-04-15
Answer
I viewed the website and datasheets of our anti-GFAP antibody and it seems that PA1239 has been tested on rat in both IF and IHC. Thus PA1239 should work for your application. Our Boster satisfaction guarantee will cover this product for IHC in rat even if the specific tissue type has not been validated. We do have a comprehensive range of products for IHC detection and you can check out our website bosterbio.com to find out more information about them.
Boster Scientific Support
Answered: 2016-04-15
