Click image to see more details
-

-
-
-
-
+9
Product Info Summary
| SKU: | A02975-2 |
|---|---|
| Size: | 100 μg/vial |
| Reactive Species: | Mouse, Rat |
| Host: | Rabbit |
| Application: | ELISA, Flow Cytometry, IF, IHC, ICC, WB |
Customers Who Bought This Also Bought

Product info
Product Name
Anti-Golm1/GOLPH2 Antibody Picoband®
SKU/Catalog Number
A02975-2
Size
100 μg/vial
Form
Lyophilized
Description
Boster Bio Anti-Golm1/GOLPH2 Antibody Picoband® catalog # A02975-2. Tested in ELISA, Flow Cytometry, IF, IHC, ICC, WB applications. This antibody reacts with Mouse, Rat. The brand Picoband indicates this is a premium antibody that guarantees superior quality, high affinity, and strong signals with minimal background in Western blot applications. Only our best-performing antibodies are designated as Picoband, ensuring unmatched performance.
Storage & Handling
Store at -20˚C for one year from date of receipt. After reconstitution, at 4˚C for one month. It can also be aliquotted and stored frozen at -20˚C for six months. Avoid repeated freeze-thaw cycles.
Cite This Product
Anti-Golm1/GOLPH2 Antibody Picoband® (Boster Biological Technology, Pleasanton CA, USA, Catalog # A02975-2)
Host
Rabbit
Contents
Each vial contains 4mg Trehalose, 0.9mg NaCl, 0.2mg Na2HPO4, 0.01mg NaN3.
Clonality
Polyclonal
Isotype
Rabbit IgG
Immunogen
E.coli-derived mouse Golm1/GOLPH2 recombinant protein (Position: S37-A393).
Cross-reactivity
No cross-reactivity with other proteins.
Reactive Species
A02975-2 is reactive to Golm1 in Mouse, Rat
Observed Molecular Weight
73 kDa
Calculated molecular weight
44.3 kDa
Background of Golm1
The Golgi complex plays a key role in the sorting and modification of proteins exported from the endoplasmic reticulum. The protein encoded by this gene is a type II Golgi transmembrane protein. It processes proteins synthesized in the rough endoplasmic reticulum and assists in the transport of protein cargo through the Golgi apparatus. The expression of this gene has been observed to be upregulated in response to viral infection. Alternatively spliced transcript variants encoding the same protein have been described for this gene.
Antibody Validation
Boster validates all antibodies on WB, IHC, ICC, Immunofluorescence, and ELISA with known positive control and negative samples to ensure specificity and high affinity, including thorough antibody incubations.
Application & Images
Applications
A02975-2 is guaranteed for ELISA, Flow Cytometry, IF, IHC, ICC, WB Boster Guarantee
Recommend Dilution
| Application | Dilution | Species |
|---|---|---|
| Western blot | 0.1-0.25μg/ml | Mouse, Rat |
| Immunohistochemistry (Paraffin-embedded Section) | 2-5μg/ml | Mouse, Rat |
| Immunocytochemistry/Immunofluorescence | 5μg/ml | Mouse |
| Flow Cytometry (Fixed) | 1-3μg/1x106 cells | Mouse |
| ELISA | 0.1-0.5μg/ml | - |
Tested application
Suggested blocking solution with 5% non-fat milk or BSA; (*)Recommended protein loading: 20-40 µg per lane
Use TE buffer pH 9.0 for antigen retrieval; (*) citrate buffer pH 6.0 is an alternative.
Validation Images & Assay Conditions
Click image to see more details
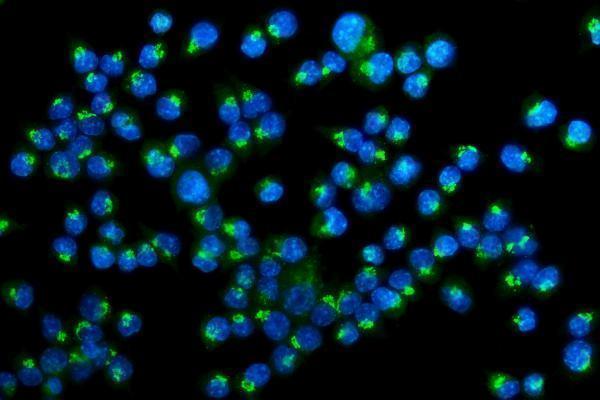
F IF analysis of Golm1/GOLPH2 using anti-Golm1/GOLPH2 antibody (A02975-2).
Golm1/GOLPH2 was detected in immunocytochemical section of HEPA1-6 cells. Enzyme antigen retrieval was performed using IHC enzyme antigen retrieval reagent (AR0022) for 15 mins. The cells were blocked with 10% goat serum. And then incubated with 5μg/mL rabbit anti-Golm1/GOLPH2 Antibody (A02975-2) overnight at 4°C. DyLight®488 Conjugated Goat Anti-Rabbit IgG (BA1127) was used as secondary antibody at 1:100 dilution and incubated for 30 minutes at 37°C. The section was counterstained with DAPI. Visualize using a fluorescence microscope and filter sets appropriate for the label used.

Click image to see more details
Western blot analysis of Golm1/GOLPH2 using anti-Golm1/GOLPH2 antibody (A02975-2).
Electrophoresis was performed on a 5-20% SDS-PAGE gel at 70V (Stacking gel) / 90V (Resolving gel) for 2-3 hours. The sample well of each lane was loaded with 50ug of sample under reducing conditions.
Lane 1: mouse stomach tissue lysates,
Lane 2: mouse lung tissue lysates,
Lane 3: mouse RAW264.7 whole cell lysates,
Lane 4: mouse Neuro-2a whole cell lysates,
Lane 5: rat stomach tissue lysates,
Lane 6: rat lung tissue lysates,
Lane 7: rat liver tissue lysates.
After Electrophoresis, proteins were transferred to a Nitrocellulose membrane at 150mA for 50-90 minutes. Blocked the membrane with 5% Non-fat Milk/ TBS for 1.5 hour at RT. The membrane was incubated with rabbit anti-Golm1/GOLPH2 antigen affinity purified polyclonal antibody (Catalog # A02975-2) at 0.25 μg/mL overnight at 4°C, then washed with TBS-0.1%Tween 3 times with 5 minutes each and probed with a goat anti-rabbit IgG-HRP secondary antibody at a dilution of 1:5000 for 1.5 hour at RT. The signal is developed using an Enhanced Chemiluminescent detection (ECL) kit (Catalog # EK1002) with Tanon 5200 system. A specific band was detected for Golm1/GOLPH2 at approximately 73KD. The expected band size for Golm1/GOLPH2 is at 73KD.

Click image to see more details
Flow Cytometry analysis of HEPA1-6 cells using anti-Golm1/GOLPH2 antibody (A02975-2).
Overlay histogram showing HEPA1-6 cells stained with A02975-2 (Blue line). To facilitate intracellular staining, cells were fixed with 4% paraformaldehyde and permeabilized with permeabilization buffer. The cells were blocked with 10% normal goat serum. And then incubated with rabbit anti-Golm1/GOLPH2 Antibody (A02975-2, 1μg/1x106 cells) for 30 min at 20°C. DyLight®488 conjugated goat anti-rabbit IgG (BA1127, 5-10μg/1x106 cells) was used as secondary antibody for 30 minutes at 20°C. Isotype control antibody (Green line) was rabbit IgG (1μg/1x106) used under the same conditions. Unlabelled sample without incubation with primary antibody and secondary antibody (Red line) was used as a blank control.

Click image to see more details
IHC analysis of Golm1/GOLPH2 using anti-Golm1/GOLPH2 antibody (A02975-2).
Golm1/GOLPH2 was detected in paraffin-embedded section of mouse intestine tissue. Heat mediated antigen retrieval was performed in EDTA buffer (pH8.0, epitope retrieval solution). The tissue section was blocked with 10% goat serum. The tissue section was then incubated with 2μg/ml rabbit anti-Golm1/GOLPH2 Antibody (A02975-2) overnight at 4°C. Biotinylated goat anti-rabbit IgG was used as secondary antibody and incubated for 30 minutes at 37°C. The tissue section was developed using Strepavidin-Biotin-Complex (SABC) (Catalog # SA1022) with DAB as the chromogen.

Click image to see more details
IHC analysis of Golm1/GOLPH2 using anti-Golm1/GOLPH2 antibody (A02975-2).
Golm1/GOLPH2 was detected in paraffin-embedded section of rat intestine tissue. Heat mediated antigen retrieval was performed in EDTA buffer (pH8.0, epitope retrieval solution). The tissue section was blocked with 10% goat serum. The tissue section was then incubated with 2μg/ml rabbit anti-Golm1/GOLPH2 Antibody (A02975-2) overnight at 4°C. Biotinylated goat anti-rabbit IgG was used as secondary antibody and incubated for 30 minutes at 37°C. The tissue section was developed using Strepavidin-Biotin-Complex (SABC) (Catalog # SA1022) with DAB as the chromogen.

Click image to see more details
GP73 harbors potent TBC-domain GAP activity that inhibits VLDLs’ secretion. a Comparison of amino acid sequences around R248 and Q310 in GP73 and equivalent residues in Gyp1p, VirA, EspG, and EspG2 with dual-finger catalytic motifs in the TBC domain. b GAP activity profiles of GP73 for a panel of 13 mammalian Rabs. The catalytic efficiency ( k cat / K M ) of GP73-catalyzed GTP hydrolysis relative to the intrinsic GTP hydrolysis rate constant was determined for each Rab. n = 3 independent biological experiments. Data are presented as mean ± SEM. c , d Kinetic analysis of GP73 GAP activity toward Rab23. The k cat / K M determined by using a Lineweaver-Burk plot is listed above the activity curves. n = 3 independent biological experiments. e Effects of R248K and Q310A mutations in GP73 (GP73-RQ) on GP73 GAP activity. n = 3 independent biological experiments. f , g ApoB ( f ) and ApoB100 ( g ) secretion efficiency of Huh-7 cells transfected with Flag-vector (Flag-V), Flag-GP73, or Flag-GP73-RQ mutant at the indicated time points after transfection. Secretion efficiency was calculated as the fraction secreted, defined as the ratio between the amounts of cargo that was secreted and the total amount of cargo (secreted plus cell-associated cargo) present in a well. n = 3 independent biological experiments. Differences between the two groups were evaluated using two-tailed Student’s t -test. Data are presented as mean ± SEM. ns, no statistical significance; ** P < 0.01. h GP73 and ApoB100 protein levels in mice livers at week 3 after the injection of AAV-V or AAV-GP73 ( n = 2 per group). α-Tubulin was used as the equal loading control. Relative expression was calculated as the fold change in expression relative to the expression in No. 1 control mice. i TG concentrations at the indicated time points after blood sampling of AAV-V-, AAV-GP73-, or AAV-GP73-RQ-injected mice fasted for 4 h and then intravenously administered tyloxapol (400 mg/kg; n = 6 per group). Differences between the three groups were evaluated using two-way ANOVA and Bonferroni’s post hoc analysis. Data are presented as mean ± SEM. ns, no statistical significance; *** P < 0.001.
Index in PubMed under a CC BY license. PMID: 34853313

Click image to see more details
Chronic elevations in hepatocyte GP73 trigger non-obese NAFLD. a Appearance, hematoxylin–eosin (HE), Oil Red O (ORO), and Sirius red staining of liver tissues from AAV-V- or AAV-GP73 (3 × 10 11 vg)-injected mice fed a regular diet for 6 months. Data were repeated three times with similar results. b – f Hepatic levels of TGs ( b ) and CHO (c); plasma levels of TGs ( d ) and ALT ( e ); body weights ( f ) of mice injected with AAV-V or AAV-GP73 and fed a regular diet for 6 or 12 months ( n = 6 per group). Differences between the two groups were evaluated using two-tailed Student’s t -test. Data are presented as mean ± SEM. * P < 0.05; ** P < 0.01. g , h Glucose levels in blood samples of 6 h-fasted AAV-V- or AAV-GP73-injected mice at 4 ( g ) and 6 ( h ) months after injection ( n = 6 per group). Differences between the two groups were evaluated using two-tailed Student’s t -test. Data are presented as mean ± SEM. * P < 0.05; ** P < 0.01. i Glucose tolerance test (GTT) results for AAV-V- or AAV-GP73-injected mice at 4.5 months after injection ( n = 6 per group). Differences between the two groups were evaluated using two-way ANOVA and Bonferroni’s post hoc analysis. Data are presented as mean ± SEM. * P < 0.05; ** P < 0.01. j – m Plasma levels of IL-6 ( j ), TGF-β ( k ), IL-1β ( l ), and IFN-γ ( m ) in AAV-V- or AAV-GP73-injected mice at 5 months after injection ( n = 6 per group). Differences between the two groups were evaluated using two-tailed Student’s t -test. Data are presented as mean ± SEM. * P < 0.05; ** P < 0.01; *** P < 0.001.
Index in PubMed under a CC BY license. PMID: 34853313

Click image to see more details
Induction of non-obese NAFLD by GP73 is highly dependent on its GAP activity. a – g Plasma levels of LDL ( a ), TGs ( b ), CHO ( c ), ALT ( f ), and AST ( g ); hepatic levels of TGs ( d ), and CHO ( e ) in AAV-V-(Vector), AAV-GP73-(GP73), or AAV-GP73-RQ(GP73-RQ)-injected mice fed a regular diet for 4.5 months ( n = 6 per group). Differences between the three groups were evaluated using one-way ANOVA and Bonferroni’s post hoc analysis. Data are presented as mean ± SEM. ns, no statistical significance; * P < 0.05; ** P < 0.01; *** P < 0.001. h – j Glucose levels in blood samples from 6 h-fasted AAV-V-, AAV-GP73-, or AAV-GP73-RQ-injected mice at 2 ( h ), 3 ( i ), and 4 ( j ) months after injection ( n = 6 per group). Differences between the three groups were evaluated using one-way ANOVA and Bonferroni’s post hoc analysis. Data are presented as mean ± SEM. ns, no statistical significance; * P < 0.05; ** P < 0.01. k Glucose tolerance test (GTT) results for AAV-V-, AAV-GP73-, or AAV-GP73-RQ-injected mice at 4.5 months after injection ( n = 6 per group). Differences between the three groups were evaluated using two-way ANOVA and Bonferroni’s post hoc analysis. Data are presented as mean ± SEM. ns, no statistical significance; *** P < 0.001.
Index in PubMed under a CC BY license. PMID: 34853313

Click image to see more details
Gene expression signatures in non-obese NAFLD induced by GP73. a Volcano plot of the DEGs in the livers from AAV-GP73-injected mice fed a regular diet for 12 months ( n = 3 per group). Significantly downregulated genes are in blue, and significantly upregulated genes are in red. The data were analyzed with two-sided Student’s t -test. The black vertical lines highlight fold changes (FCs) of −2 and 2, while the black horizontal line represents a P value of 0.05. b Pathways enriched for the DEGs in the livers from AAV-GP73-injected mice at 12 months after injection ( n = 3 per group) according to GO term analysis at GO level 4. The bar plot shows significantly dysregulated pathways, and Fisher’s exact test P values are shown on the x -axis. c Heatmap of the critical DEGs in the livers from AAV-GP73-injected mice versus AAV-V-injected mice fed a regular diet for 12 months. Upregulated genes are highlighted in red, and downregulated genes are highlighted in green. d PCA results. PCA was based on the gene expression patterns in the AAV-V (yellow), AAV-GP73 (purple), and AAV-V HFD (green) groups. In all plots, each point represents a sample. e Heatmap of the top 20 highly upregulated genes in the livers from the AAV-GP73 and HFD groups. f Heatmap of the top 20 highly upregulated and 20 highly downregulated genes that were specifically regulated by GP73.
Index in PubMed under a CC BY license. PMID: 34853313

Click image to see more details
GP73 promotes NASH progression in obese NAFLD induced by HFD. a Body weights of AAV-V-injected mice fed a regular diet and AAV-V- or AAV-GP73-injected mice fed a HFD for 12 months ( n = 6 per group). Differences between the three groups were evaluated using one-way ANOVA and Bonferroni’s post hoc analysis. Data are presented as mean ± SEM. * P < 0.05. b Appearance, HE, ORO, and Sirius red staining of the livers from AAV-V-injected mice fed a regular diet and AAV-V- or AAV-GP73-injected mice fed a HFD for 12 months ( n = 6 per group). c Liver-to-body weight ratio of AAV-V-injected mice fed a regular diet and AAV-V- or AAV-GP73-injected mice fed a HFD for 12 months ( n = 6 per group). Differences between the three groups were evaluated using one-way ANOVA and Bonferroni’s post hoc analysis. Data are presented as mean ± SEM. * P < 0.05. d GP73 and ApoB100 protein levels in livers from AAV-V-injected mice fed a regular diet and AAV-V- or AAV-GP73-injected mice fed a HFD for 12 months ( n = 3 per group). α-Tubulin was used as the equal loading control. Relative expression was calculated as the fold change in expression relative to the expression in No. 1 control mice. e – h Hepatic levels of TGs ( e ) and CHO ( f ); plasma levels of ALT ( g ), and AST ( h ) in AAV - V-injected mice fed a regular diet and AAV-V- or AAV-GP73-injected mice fed a HFD for 12 months ( n = 6 per group). Differences between the three groups were evaluated using one-way ANOVA and Bonferroni’s post hoc analysis. Data are presented as mean ± SEM. * P < 0.05; ** P < 0.01.
Index in PubMed under a CC BY license. PMID: 34853313

Click image to see more details
Metformin alleviates non-obese NAFLD induced by GP73. a Microscale thermophoresis (MST) analysis of the interaction between metformin (Met) and GP73. The data were derived from the effect of metformin on the fluorescence decay of fluorescently labeled GP73. The half-maximum effective concentration (EC 50 ) was determined by the Hill slope. n = 3 independent biological experiments. b , c Immunoprecipitation analysis of the interaction between GP73 and Rab23 ( b ) or TBC1D20 and Rab1b ( c ) in the presence or absence of Met. Data were repeated three times with similar results. d , e Kinetic analysis of GP73 activity toward Rab23 ( d ) or TBC1D20 activity toward Rab1b ( e ) in the presence of different concentrations of Met. n = 3 independent biological experiments. f , g ApoB ( f ) and ApoB100 ( g ) secretion efficiency in cells from Flag-vector- or Flag-GP73-transfected cells treated with Met. n = 3 independent biological experiments. Differences between the two groups were evaluated using one-way ANOVA and Bonferroni’s post hoc analysis. Data are presented as mean ± SEM. ** P < 0.01; *** P < 0.001. h Schematic depicting the experimental setup. i – k Hepatic levels of TGs ( i ) and CHO ( j ); 6 h-fasted glucose levels ( k ) of AAV-V- or AAV-GP73 - treated mice given normal drinking water (NW) or drinking water with metformin (3 g/L) (NW) for 4 months ( n = 6 per group). Differences between the four groups were evaluated using one-way ANOVA and Bonferroni’s post hoc analysis. Data are presented as mean ± SEM. * P < 0.05.
Index in PubMed under a CC BY license. PMID: 34853313

Click image to see more details
GP73 expression is pathologically elevated in NAFLD patients without obesity. a GP73 mRNA expression in multiple tissues from mice fed a regular diet (Reg) or a high-cholesterol, high-cholate diet (HFHCC) for 1 month ( n = 6 per group). Differences between the two groups were evaluated using two-sided unpaired Student’s t -test. Data are presented as mean ± SEM. *** P < 0.001. b GP73 protein levels in the livers from mice fed HFHCC for 7 days ( n = 2 per group). α-Tubulin was used as the equal loading control. Relative expression was calculated as the fold change in expression relative to the expression in No. 1 control mice. c – f Plasma adiponectin ( c ), leptin ( d ), and adiponectin-to-leptin ratio (A/L ratio; e ); GP73 levels ( f ) in NAFLD patients without obesity and non-obese healthy subjects ( n = 14 per group). Differences between the two groups were evaluated using the two-sided unpaired Student’s t -test. Data are presented as mean ± SEM. ns, no statistical significance; * P < 0.05; *** P < 0.001.
Index in PubMed under a CC BY license. PMID: 34853313

Click image to see more details
GP73 blockade improves whole-body metabolism in non-obese NAFLD mouse model. a GP73 mRNA expression in livers from mice fed a regular or HFHCC diet for 1 month and injected with siGP73 or control RNAi oligos twice a week ( n = 6 per group). Differences between the two groups were evaluated using unpaired Student’s t -test. Data are presented as mean ± SEM. *** P < 0.001. b – j Liver-to-body weight ratio ( b ); hepatic levels of CHO ( c ) and TGs ( d ); plasma levels of AST ( e ) and ALT ( f ); fasting glucose levels ( g ) and GTT ( h ); body weight ( i ) and inguinal WAT-to-body weight ratio ( j ) in the four groups above ( n = 6 per group). Differences between two groups were evaluated using unpaired Student’s t -test. Data are presented as mean ± SEM. ns, no statistical significance; * P < 0.05; ** P < 0.01; *** P < 0.001.
Index in PubMed under a CC BY license. PMID: 34853313
Specific Publications For Anti-Golm1/GOLPH2 Antibody Picoband® (A02975-2)
Loading publications
Recommended Resources
Here are featured tools and databases that you might find useful.
- Boster's Pathways Library
- Protein Databases
- Bioscience Research Protocol Resources
- Data Processing & Analysis Software
- Photo Editing Software
- Scientific Literature Resources
- Research Paper Management Tools
- Molecular Biology Software
- Primer Design Tools
- Bioinformatics Tools
- Phylogenetic Tree Analysis
Customer Reviews
Have you used Anti-Golm1/GOLPH2 Antibody Picoband®?
Share your experimental results or join a short interview to earn up to $1,000 in product credits or other rewards.
0 Reviews For Anti-Golm1/GOLPH2 Antibody Picoband®
Customer Q&As
Have a question?
Find answers in Q&As, reviews.
Can't find your answer?
Submit your question
