Click image to see more details
-

-
-
-
-
+2
Product Info Summary
| SKU: | A00077-2 |
|---|---|
| Size: | 100 μg/vial |
| Reactive Species: | Mouse, Rat |
| Host: | Rabbit |
| Application: | ELISA, IHC, WB |
Customers Who Bought This Also Bought

Product info
Product Name
Anti-Il13 Antibody Picoband®
SKU/Catalog Number
A00077-2
Size
100 μg/vial
Form
Lyophilized
Description
Boster Bio Anti-Il13 Antibody Picoband® catalog # A00077-2. Tested in ELISA, IHC, WB applications. This antibody reacts with Mouse, Rat. The brand Picoband indicates this is a premium antibody that guarantees superior quality, high affinity, and strong signals with minimal background in Western blot applications. Only our best-performing antibodies are designated as Picoband, ensuring unmatched performance.
Storage & Handling
At -20°C for one year from date of receipt. After reconstitution, at 4°C for one month. It can also be aliquotted and stored frozen at -20°C for six months. Avoid repeated freezing and thawing.
Cite This Product
Anti-Il13 Antibody Picoband® (Boster Biological Technology, Pleasanton CA, USA, Catalog # A00077-2)
Host
Rabbit
Contents
Each vial contains 4 mg Trehalose, 0.9 mg NaCl, 0.2 mg Na2HPO4.
Clonality
Polyclonal
Isotype
Rabbit IgG
Immunogen
E.coli-derived mouse Il13 recombinant protein (Position: P22-F131).
Cross-reactivity
No cross-reactivity with other proteins
Reactive Species
A00077-2 is reactive to Il13 in Mouse, Rat
Observed Molecular Weight
19 kDa
Calculated molecular weight
14.1 kDa
Background of Il13
Interleukin 13 is a protein that in humans is encoded by the IL-13 gene. It is a kind of cytokine secreted by many cell types, but especially T helper type 2 (Th2) cells, which is an important mediator of allergic inflammation and disease. The IL-13 gene is mapped to 5q23-q31. IL-13 induces its effects through a multi-subunit receptor that includes the alpha chain of the IL-4 receptor (IL-4Rα) and at least one of two known IL-13-specific binding chains. Furthermore, this gene acts more prominently as a molecular bridge linking allergic inflammatory cells to the non-immune cells in contact with them, thereby altering physiological function.
Antibody Validation
Boster validates all antibodies on WB, IHC, ICC, Immunofluorescence, and ELISA with known positive control and negative samples to ensure specificity and high affinity, including thorough antibody incubations.
Application & Images
Applications
A00077-2 is guaranteed for ELISA, IHC, WB Boster Guarantee
Recommend Dilution
| Application | Dilution | Species |
|---|---|---|
| Western blot | 0.25-0.5 μg/ml | Mouse |
| Immunohistochemistry(Paraffin-embedded Section) | 2-5 μg/ml | Mouse, Rat |
| ELISA | 0.1-0.5 μg/ml | - |
Tested application
Suggested blocking solution with 5% non-fat milk or BSA; (*)Recommended protein loading: 20-40 µg per lane
Use TE buffer pH 9.0 for antigen retrieval; (*) citrate buffer pH 6.0 is an alternative.
Validation Images & Assay Conditions
Click image to see more details
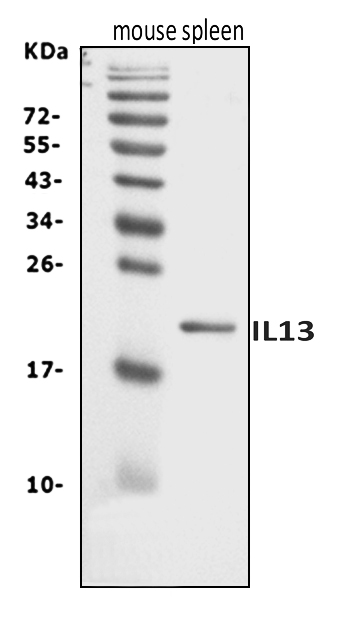
Western blot analysis of Il13 using anti-Il13 antibody (A00077-2).
Electrophoresis was performed on a 5-20% SDS-PAGE gel at 70V (Stacking gel) / 90V (Resolving gel) for 2-3 hours. The sample well of each lane was loaded with 30 ug of sample under reducing conditions.
Lane 1: mouse spleen tissue lysates.
After electrophoresis, proteins were transferred to a nitrocellulose membrane at 150 mA for 50-90 minutes. Blocked the membrane with 5% non-fat milk/TBS for 1.5 hour at RT. The membrane was incubated with rabbit anti-Il13 antigen affinity purified polyclonal antibody (Catalog # A00077-2) at 0.5 μg/mL overnight at 4°C, then washed with TBS-0.1%Tween 3 times with 5 minutes each and probed with a goat anti-rabbit IgG-HRP secondary antibody at a dilution of 1:5000 for 1.5 hour at RT. The signal is developed using an Enhanced Chemiluminescent detection (ECL) kit (Catalog # EK1002) with Tanon 5200 system. A specific band was detected for Il13 at approximately 19 kDa. The expected band size for Il13 is at 19 kDa.

Click image to see more details
RCM-1 prevents type 2 cytokines expression in mice to expel H . nana . A Representative images of IHC with GATA3 (brown highlighted by black arrowheads, scale bars 50 μm). B Representative images of IHC with IL-13 (brown highlighted by red arrowheads, scale bars 100 μm for the upper panel and 50 μm for the lower panel). Percentages of positive-area of GATA3 ( C ) and IL-13 ( D ) were semi-quantified using Image J software. E The protein level of IL-4 (left panel) and the percentage of the relative expression of IL-4 were semi-quantified using Image J software (right panel). The relative quantifications of transcription levels of IL-13 ( F ), IL-4 ( G ), IL-5 ( H ), and IL-9 ( I ) were determined by the 2 −ΔΔCt method normalized to GAPDH . Data are presented as mean + SD for ( C – I ) and the right panel of ( E ), n = 7 per group, ** P < 0.01, *** P < 0.001; ns, not statistically significant
Index in PubMed under a CC BY license. PMID: 40069907

Click image to see more details
ESPs increase the number of tuft cells and IL-13 in the small intestine of UC mice. A Representative images of IHC for Dclk1 (brown indicated by red arrowheads in the lower panel; scale bars 100 μm for the upper panel and 50 μm for the lower panel) and ( B ) IF for Dclk1 (green) and the nucleus (4′,6-diamidino-2-phenylindole (DAPI), blue) (scale bars 100 μm). Percentages of Dclk1-positive area and the number of tuft cells were semi-quantified using Image J in A and B . The transcription levels of Dclk1 ( C ), IL-25 ( D ), IL-33 ( E ), and IL-13 ( F ) were determined using the 2 −ΔΔCt method normalized to GAPDH . G Representative images of IHC for IL-13 (brown indicated by black arrowheads in the lower panel; scale bars 100 μm for the upper panel and 50 μm for the lower panel); percentage of IL-13-positive area was semi-quantified using Image J. Data are presented as mean + SD for the right panel of A , B , G ) and ( C – F ). Group size of n = 7 per group. * p < 0.05; ** p < 0.01; *** p < 0.001 Full size image
Index in PubMed under a CC BY license. PMID: 40542404

Click image to see more details
ESPs enhance ISC proliferation and differentiation to promote intestinal epithelial regeneration and alleviate organoid damage. ( A ) WB results for Lgr5 and PCNA (left panel) and the relative expression levels of Lgr5 and PCNA (right panel) were semi-quantified using Image J. ( B ) WB results for Dclk1, Lyz, and MUC2 (left panel); the relative expression levels of Dclk1, Lyz, and MUC2 were semi-quantified using Image J. The transcription levels of Lgr5 ( C ), Dclk1 ( D ), Lyz1 ( E ), MUC2 ( F ), and IL-13 ( H ) were determined using the 2 −ΔΔCt method normalized to GAPDH . ( G ) WB result for IL-13 (left panel) and the relative expression level of IL-13 was semi-quantified using Image J. Data are presented as mean + SD for the right panels of A , B & G and C – F and H . Group size of n = 3 per group. * p < 0.05; ** p < 0.01; *** p < 0.001 Full size image
Index in PubMed under a CC BY license. PMID: 40542404

Click image to see more details
IHC analysis of Il13 using anti-Il13 antibody (A00077-2).
Il13 was detected in a paraffin-embedded section of mouse spleen tissue. Heat mediated antigen retrieval was performed in EDTA buffer (pH 8.0, epitope retrieval solution). The tissue section was blocked with 10% goat serum. The tissue section was then incubated with 2 μg/ml rabbit anti-Il13 Antibody (A00077-2) overnight at 4°C. Biotinylated goat anti-rabbit IgG was used as secondary antibody and incubated for 30 minutes at 37°C. The tissue section was developed using Strepavidin-Biotin-Complex (SABC) (Catalog # SA1022) with DAB as the chromogen.

Click image to see more details
IHC analysis of Il13 using anti-Il13 antibody (A00077-2).
Il13 was detected in a paraffin-embedded section of rat lymph node tissue. Heat mediated antigen retrieval was performed in EDTA buffer (pH 8.0, epitope retrieval solution). The tissue section was blocked with 10% goat serum. The tissue section was then incubated with 2 μg/ml rabbit anti-Il13 Antibody (A00077-2) overnight at 4°C. Biotinylated goat anti-rabbit IgG was used as secondary antibody and incubated for 30 minutes at 37°C. The tissue section was developed using Strepavidin-Biotin-Complex (SABC) (Catalog # SA1022) with DAB as the chromogen.
Specific Publications For Anti-Il13 Antibody Picoband® (A00077-2)
Loading publications
Recommended Resources
Here are featured tools and databases that you might find useful.
- Boster's Pathways Library
- Protein Databases
- Bioscience Research Protocol Resources
- Data Processing & Analysis Software
- Photo Editing Software
- Scientific Literature Resources
- Research Paper Management Tools
- Molecular Biology Software
- Primer Design Tools
- Bioinformatics Tools
- Phylogenetic Tree Analysis
Customer Reviews
Have you used Anti-Il13 Antibody Picoband®?
Share your experimental results or join a short interview to earn up to $1,000 in product credits or other rewards.
0 Reviews For Anti-Il13 Antibody Picoband®
Customer Q&As
Have a question?
Find answers in Q&As, reviews.
Can't find your answer?
Submit your question
