Click image to see more details
-

-
-
-
-
+7
Product Info Summary
| SKU: | A00284T254 |
|---|---|
| Size: | 100ul |
| Reactive Species: | Human, Mouse, Rat |
| Host: | Rabbit |
| Application: | ELISA, IP, IF, IHC, WB |
Customers Who Bought This Also Bought

Product info
Product Name
Anti-Phospho-N kappa-p65 (T254) RELA Antibody
SKU/Catalog Number
A00284T254
Size
100ul
Form
Liquid
Description
Boster Bio Anti-Phospho-N kappa-p65 (T254) RELA Antibody catalog # A00284T254. Tested in WB, IHC, IF, IP, ELISA applications. This antibody reacts with Human, Mouse, Rat.
Storage & Handling
Store at -20°C for one year. For short term storage and frequent use, store at 4°C for up to one month. Avoid repeated freeze-thaw cycles.
Cite This Product
Anti-Phospho-N kappa-p65 (T254) RELA Antibody (Boster Biological Technology, Pleasanton CA, USA, Catalog # A00284T254)
Host
Rabbit
Contents
Liquid in PBS containing 50% glycerol, 0.5% stabilizing protein and 0.02% sodium azide.
*This antibody is supplied in a stabilized formulation.
Compatibility with conjugation reactions depends on the chemistry of the conjugation method used.
For conjugation methods that are not compatible with the stabilizing components present in this formulation, a carrier-free antibody format is required.
Clonality
Polyclonal
Isotype
IgG
Immunogen
The antiserum was produced against synthesized peptide derived from human NF-kappaB p65 around the phosphorylation site of Thr254. AA range:221-270
Reactive Species
A00284T254 is reactive to RELA in Human, Mouse, Rat
Calculated molecular weight
60.2 kDa
Antibody Validation
Boster validates all antibodies on WB, IHC, ICC, Immunofluorescence, and ELISA with known positive control and negative samples to ensure specificity and high affinity, including thorough antibody incubations.
Application & Images
Applications
A00284T254 is guaranteed for ELISA, IP, IF, IHC, WB Boster Guarantee
Recommend Dilution
WB 1:500-1:2000
IHC 1:100-1:300
IP 2-5 ug/mg lysate
ELISA 1:20000
IF 1:50-200
Validation Images & Assay Conditions
Click image to see more details
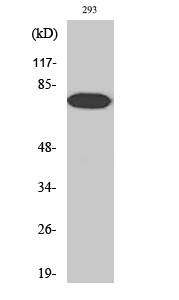
Western Blot analysis of various cells using Phospho-NFκB-p65 (T254) Polyclonal Antibody

Click image to see more details
Western blot analysis of lysates from 293 cells treated with TNF-alpha, using NF-kappaB p65 (Phospho-Thr254) Antibody. The lane on the left is blocked with the phospho peptide.

Click image to see more details
Immunohistochemistry analysis of paraffin-embedded human breast carcinoma, using NF-kappaB p65 (Phospho-Thr254) Antibody. The picture on the right is blocked with the phospho peptide.

Click image to see more details
Expression levels of C3 protein and mRNA in the mid colon of C3 KO mice. ( A ) The expressions of C3 protein and mRNA in the mid colon were measured by applying Western blot and RT-PCR analysis, using anti-C3 antibody and C3 specific primers. After determining the intensity of each band using an imaging densitometer, relative levels of the C3 protein were calculated, based on the intensity of β-actin. The mRNA level of the C3 gene was calculated based on the intensity of β-actin as an endogenous control. Tissue samples were collected from 3 to 5 mice per group, and each lysate was analyzed in duplicate for Western blot and RT-PCR analysis (final n = 6–10). ( B ) Tissue distribution of C3 protein was analyzed in the mid colon of WT and C3 KO mice. The C3 protein-specific antibody-stained sections of the mid colon from the WT and KO mice were observed at 400× magnification using light microscopy. The large image in the right column is a magnified image of the rectangle in the left column. H&E-stained sections (low rectangle in left corner) were observed at 400× magnification using a light microscope. ( C ) The expressions of C3aR and CR1 protein in the mid colon were measured with Western blot analysis using anti-C3aR and CR1 antibodies. After determining the intensity of each band using an imaging densitometer, relative levels of C3aR and CR1 proteins were calculated, based on the intensity of β-actin. Tissue samples were collected from 3 to 5 mice per group, and each lysate was analyzed in duplicate for Western blot (final n = 6–10). Data are reported as the mean ± SD. * indicates p < 0.05 compared to the WT mice.
Index in PubMed under a CC BY license. PMID: 35105928

Click image to see more details
Expression levels of MAPK signaling pathway components. ( A ) Expression levels of ERK, p-ERK, JNK, p-JNK, p38 and p-p38 proteins were determined by Western blot analysis using the specific primary antibody and HRP-labeled anti-rabbit IgG antibody. ( B ) Band intensities were determined using an imaging densitometer, and protein expressions were calculated relative to the intensity of β-actin. Tissue samples were collected from 3 to 5 mice per group, and each lysate was analyzed in duplicate for Western blot (final n = 6–10). Data are reported as the mean ± SD. * indicates p < 0.05 compared to the WT mice.
Index in PubMed under a CC BY license. PMID: 35105928

Click image to see more details
Expression levels of members in the iNOS‑mediated COX‑2 induction pathway. ( A ) Expression levels of COX-2 and iNOS proteins were determined by Western blot analysis using specific primary antibody and HRP-labeled anti-rabbit IgG antibody. ( B ) Band intensities were determined using an imaging densitometer, and protein expressions were calculated relative to the intensity of β-actin. Tissue samples were collected from 3 to 5 mice per group, and each lysate was analyzed in duplicate for Western blot (final n = 6–10). Data are reported as the mean ± SD. * indicates p < 0.05 compared to the WT mice.
Index in PubMed under a CC BY license. PMID: 35105928

Click image to see more details
Expression levels of members in the ASC-inflammasome pathway. ( A ) Expression levels of NLRP3, cleaved-Cas1/Cas1 and ASC proteins were determined by Western blot analysis using the specific primary antibody and HRP-labeled anti-rabbit IgG antibody. ( B ) Band intensities were determined using an imaging densitometer, and protein expressions were calculated relative to the intensity of β-actin. Tissue samples were collected from 3 to 5 mice per group, and each lysate was analyzed in duplicate for Western blot (final n = 6–10). Data are reported as the mean ± SD. * indicates p < 0.05 compared to the WT mice.
Index in PubMed under a CC BY license. PMID: 35105928

Click image to see more details
Expression levels of members in the NF-κB signaling pathway. ( A ) Expression levels of NF-κB-p65 and IκB-α proteins were determined by Western blot analysis using specific primary antibody and HRP-labeled anti-rabbit IgG antibody. ( B ) Band intensities were determined using an imaging densitometer, and protein expressions were calculated relative to the intensity of β-actin. Tissue samples were collected from 3 to 5 mice per group, and each lysate was analyzed in duplicate for Western blot (final n = 6–10). Data are reported as the mean ± SD. * indicates p < 0.05 compared to the WT mice.
Index in PubMed under a CC BY license. PMID: 35105928

Click image to see more details
Levels of pro-inflammatory and anti-inflammatory cytokines. ( A ) The levels of TNF and IL-1α transcripts in the total mRNA of colon tissue were measured by qRT-PCR analyses using sense and anti-sense primers set for TNF and IL-1α. Concentration of the TNF protein was measured in the serum of WT and C3 KO mice using the ELISA Kit. This assay detects concentrations as low as 3.5 pg/mL for TNF. ( B ) The levels of anti-inflammatory cytokines including TGF- \(\beta\) 1 and IL-10 transcripts in the total mRNA of colon tissue were measured by qRT-PCR analyses using the sense and anti-sense primer set for TGF-β and IL-10. The mRNA level of each gene was calculated based on the intensity of actin as an endogenous control. Tissue samples were collected from 3 to 5 mice per group, and each lysate was analyzed in duplicate for qRT-PCR (final n = 6–10). ( C ) Expression levels of IL-6 protein were determined by Western blot analysis using specific primary antibody and HRP-labeled anti-rabbit IgG antibody. Band intensities were determined using an imaging densitometer, and protein expressions were calculated relative to the intensity of actin. Tissue samples were collected from 3 to 5 mice per group, and each lysate was analyzed in duplicate for ELISA (final n = 6–10). The concentrations of IL-6 proteins were measured in the serum of WT and C3 KO mice using the ELISA Kit. This assay detects concentrations as low as 2 pg/mL for IL-6. Data are reported as the mean ± SD. * indicates p < 0.05 compared to the WT mice.
Index in PubMed under a CC BY license. PMID: 35105928

Click image to see more details
Levels of C5 and its mediated inflammatory regulators. ( A ) Expression levels of thrombin and C5 proteins were determined by Western blot analysis using specific primary antibody and HRP-labeled anti-rabbit IgG antibody. ( B ) Band intensities were determined using an imaging densitometer, and protein expressions were calculated relative to the intensity of β-actin. Tissue samples were collected from 3 to 5 mice per group, and each lysate was analyzed in duplicate for Western blot (final n = 6–10). Data are reported as the mean ± SD. * indicates p < 0.05 compared to the WT mice.
Index in PubMed under a CC BY license. PMID: 35105928

Click image to see more details
Alterations in neutrophil infiltration and leaky epithelium. ( A ) Expression levels of E-cadherin were determined by Western blot analysis using specific primary antibody and HRP-labeled anti-rabbit IgG antibody. Band intensities were determined using an imaging densitometer, and protein expressions were calculated relative to the intensity of β-actin. Tissue samples were collected from 3 to 5 mice per group, and each lysate was analyzed in duplicate for Western blot (final n = 6–10). ( B ) MPO activity for neutrophil level. MPO activity was measured in lysate of mid colon tissues using the MPO assay kit. Tissue samples were collected from 3 to 5 mice per group, and each lysate was analyzed in duplicate for ELISA (final n = 6–10). ( C ) The levels of four tight junction channels including ZO-1, Occludin, Claudin-1 and Claudin-4 transcripts in the total mRNA of colon tissue were measured by qRT-PCR analyses using sense and anti-sense primers set for ZO-1, Occludin, Claudin-1 and Claudin-4. ( D ) The levels of four tight junction channels including CFTR, Ano-1, Slc26A3 and Slc26A6 transcripts in the total mRNA of colon tissue were measured by qRT-PCR analyses using sense and anti-sense primers set for CFTR, Ano-1, Slc26A3 and Slc26A6. The mRNA level of each gene was calculated based on the intensity of actin as an endogenous control. Tissue samples were collected from 3 to 5 mice per group, and each lysate was analyzed in duplicate for qRT-PCR (final n = 6–10). Data are reported as the mean ± SD. * indicates p < 0.05 compared to the WT mice.
Index in PubMed under a CC BY license. PMID: 35105928
Specific Publications For Anti-Phospho-N kappa-p65 (T254) RELA Antibody (A00284T254)
Loading publications
Recommended Resources
Here are featured tools and databases that you might find useful.
- Boster's Pathways Library
- Protein Databases
- Bioscience Research Protocol Resources
- Data Processing & Analysis Software
- Photo Editing Software
- Scientific Literature Resources
- Research Paper Management Tools
- Molecular Biology Software
- Primer Design Tools
- Bioinformatics Tools
- Phylogenetic Tree Analysis
Customer Reviews
Have you used Anti-Phospho-N kappa-p65 (T254) RELA Antibody?
Share your experimental results or join a short interview to earn up to $1,000 in product credits or other rewards.
0 Reviews For Anti-Phospho-N kappa-p65 (T254) RELA Antibody
Customer Q&As
Have a question?
Find answers in Q&As, reviews.
Can't find your answer?
Submit your question
