Click image to see more details
-

-
-
-
-
+15
Product Info Summary
| SKU: | A05096-1 |
|---|---|
| Size: | 100 µg/vial |
| Reactive Species: | Human, Mouse, Rat |
| Host: | Rabbit |
| Application: | ELISA, Flow Cytometry, IF, IHC, ICC, WB |
Customers Who Bought This Also Bought

Product info
Product Name
Anti-SOAT1 Antibody Picoband®
SKU/Catalog Number
A05096-1
Size
100 µg/vial
Form
Lyophilized
Description
Boster Bio Anti-SOAT1 Antibody Picoband® catalog # A02948-2. Tested in WB, IHC, ICC/IF, FCM, ELISA applications. This antibody reacts with Human, Mouse, Rat. The brand Picoband indicates this is a premium antibody that guarantees superior quality, high affinity, and strong signals with minimal background in Western blot applications. Only our best-performing antibodies are designated as Picoband, ensuring unmatched performance.
Storage & Handling
At -20°C for one year from date of receipt. After reconstitution, at 4°C for one month. It can also be aliquotted and stored frozen at -20°C for six months. Avoid repeated freezing and thawing.
Cite This Product
Anti-SOAT1 Antibody Picoband® (Boster Biological Technology, Pleasanton CA, USA, Catalog # A05096-1)
Host
Rabbit
Contents
Each vial contains 4 mg Trehalose, 0.9 mg NaCl, 0.2 mg Na2HPO4.
Clonality
Polyclonal
Isotype
IgG
Immunogen
E.coli-derived human SOAT1 recombinant protein (Position: R41-Y548). Human SOAT1 shares 88.2% and 87.4% amino acid (aa) sequence identity with mouse and rat SOAT1, respectively.
Cross-reactivity
No cross reactivity with other proteins.
Reactive Species
A05096-1 is reactive to SOAT1 in Human, Mouse, Rat
Observed Molecular Weight
75 kDa
Calculated molecular weight
64.7 kDa
Background of SOAT1
Sterol O-acyltransferase (acyl-Coenzyme A: cholesterol acyltransferase) 1, also known as SOAT1, is an enzyme that in humans is encoded by the SOAT1 gene. The protein encoded by this gene belongs to the acyltransferase family. It is located in the endoplasmic reticulum, and catalyzes the formation of fatty acid-cholesterol esters. This gene has been implicated in the formation of beta-amyloid and atherosclerotic plaques by controlling the equilibrium between free cholesterol and cytoplasmic cholesteryl esters. Alternatively spliced transcript variants have been found for this gene.
Antibody Validation
Boster validates all antibodies on WB, IHC, ICC, Immunofluorescence, and ELISA with known positive control and negative samples to ensure specificity and high affinity, including thorough antibody incubations.
Application & Images
Applications
A05096-1 is guaranteed for ELISA, Flow Cytometry, IF, IHC, ICC, WB Boster Guarantee
Recommend Dilution
| Application | Dilution | Species |
|---|---|---|
| Western blot | 0.25-0.5 μg/ml | Human, Mouse, Rat |
| Immunohistochemistry(Paraffin-embedded Section) | 2-5 μg/ml | Human, Rat |
| Immunocytochemistry/Immunofluorescence | 5 μg/ml | Human |
| Flow Cytometry (Fixed) | 1-3 μg/1x106 cells | Human |
| ELISA | 0.1-0.5 μg/ml | - |
Tested application
Suggested blocking solution with 5% non-fat milk or BSA; (*)Recommended protein loading: 20-40 µg per lane
Use TE buffer pH 9.0 for antigen retrieval; (*) citrate buffer pH 6.0 is an alternative.
Validation Images & Assay Conditions
Click image to see more details
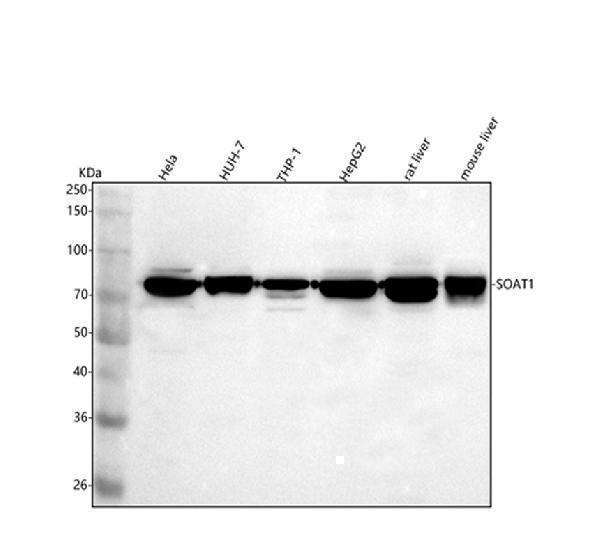
Western blot analysis of SOAT1 using anti-SOAT1 antibody (A05096-1).
Electrophoresis was performed on a 5-20% SDS-PAGE gel at 70V (Stacking gel) / 90V (Resolving gel) for 2-3 hours. The sample well of each lane was loaded with 30 ug of sample under reducing conditions.
Lane 1: human Hela whole cell lysates,
Lane 2: human HUH-7 whole cell lysates,
Lane 3: human THP-1 whole cell lysates,
Lane 4: human HepG2 whole cell lysates,
Lane 5: rat liver tissue lysates,
Lane 6: mouse liver tissue lysates.
After electrophoresis, proteins were transferred to a nitrocellulose membrane at 150 mA for 50-90 minutes. Blocked the membrane with 5% non-fat milk/TBS for 1.5 hour at RT. The membrane was incubated with rabbit anti-SOAT1 antigen affinity purified polyclonal antibody (Catalog # A05096-1) at 0.5 μg/mL overnight at 4°C, then washed with TBS-0.1%Tween 3 times with 5 minutes each and probed with a goat anti-rabbit IgG-HRP secondary antibody at a dilution of 1:5000 for 1.5 hour at RT. The signal is developed using an Enhanced Chemiluminescent detection (ECL) kit (Catalog # EK1002) with Tanon 5200 system. A specific band was detected for SOAT1 at approximately 75 kDa. The expected band size for SOAT1 is at 65 kDa.

Click image to see more details
SOAT1 promotes the malignant progression of HCC. A Up-regulated and down-regulated differentially expression genes (DEGs) in five mRNA expression profiles. B The GO category for DEGs. BP biological process, CC cellular component, MF molecular function. The color represents the P value, and the size indicates the enrichment gene number of each pathway. C KEGG enrichment pathways of DEGs. EIP Environmental Information Processing, CP Cellular Processes, OS Organismal Systems, GIP Genetic Information Processing, HD Human Diseases, M Metabolism. D Protein–protein interaction network of DEGs. E Up-regulated gene expression of lipid metabolism and tumor progression. F Representative images of IHC staining for SOAT1 of normal liver and HCC tissues cited from The Human Protein Atlas. G SOAT1 expression level in normal tissues and HCC tissues based on the TCGA dataset. H , I Analysis of the SOAT1 expression levels in TCGA HCC samples based on the individual clinical stage ( H ) and pathological grade ( I ). J High SOAT1 expression is positively correlated with poor survival ( P = 0.0175). K Representative images of positive and negative SOAT1 expression in different HCC tissues detected by IHC. L Analysis of the expression levels of SOAT1 in HCC patient liver tissues based on ES grade and MVI grade.
Index in PubMed under a CC BY license. PMID: 38724499

Click image to see more details
SOAT1 promotes the EMT in HCC cells. A SOAT1 expression level in different HCC cell lines cited from CCLE database. B Western blot analysis of SOAT1 expression in HepG2 and PLC/PRF/5 cell lines. C Western blot analysis of EMT related markers in SOAT1 overexpressed or knocked down cells. D Immunofluorescence assay of E-cadherin and Vimentin in cells treated with SOAT1 overexpression or shRNA vectors. E Cell phenotype changes under SOAT1 overexpressed or knocked down treatment. F , G Migration ( F ) and invasion ( G ) of HepG2 cells transfected with SOAT1 or PLC/PRF/5 cells transfected with shSOAT1. H Cell proliferation under SOAT1 overexpressed or knocked down treatment.
Index in PubMed under a CC BY license. PMID: 38724499

Click image to see more details
SOAT1 induces the EMT via regulating cholesterol metabolism. A , B Oil red O ( A ) and BODIPY 493/503 ( B ) staining of lipid droplets in SOAT1 overexpressed HepG2 cells and SOAT1 knocked down PLC/PRF/5 cells. The relative Oil red O and intensity of BODIPY493/503 were analyzed. C SOAT1 increased accumulation of cholesterol esters. D Cellular cholesterol distribution by Filipin III staining. E Western blot analysis of SOAT1, SREBP2, LDLR, ITGAV, and ITGB4 expression levels under SOAT1 overexpression or knockdown.
Index in PubMed under a CC BY license. PMID: 38724499

Click image to see more details
Nootkatone alleviates cholesterol metabolism disorder by targeting SOAT1. A Prediction docking score between small-molecule compounds and SOAT1. B Predicted interaction of nootkatone with cavity residues of SOAT1. C Cell viability of HCC cells with nootkatone treatment for 48 h. D , E Micrographs of Oil red O ( D ) and BODIPY ( E ) staining of lipid droplets in PLC/PRF/5 induced with cholesterol (200 μg/mL) for 24 h and then treated with nootkatone (150 and 300 µM) for 48 h. F Nootkatone decreased the content of cholesterol esters in different groups. G , H Expression of SOAT1 in different groups.
Index in PubMed under a CC BY license. PMID: 38724499

Click image to see more details
Nootkatone inhibits EMT of HCC by targeting SOAT1. A BODIPY493/503 staining of lipid droplets in Control, NK, SOAT1 and SOAT1 + NK groups. B Content of cholesterol esters in different groups. C Cholesterol distribution was determined by Filipin III staining. D , E Invasion ( D ) and migration ( E ) of PLC/PRF/5 cells with different treatments. F Immunofluorescence assay of E-cadherin and Vimentin of cells in different group. G Cell phenotype under nootkatone treatment with different concentration (150 and 300 µM). H Western blot analysis of SOAT1, SREBP2, LDLR, E-cadherin, Occludin, Vimentin, Twist1, N-cadherin, Snail1, Slug, and Fibronectin expression level in different groups.
Index in PubMed under a CC BY license. PMID: 38724499

Click image to see more details
Nootkatone suppresses the oncogenic and metastatic effects of SOAT1 in vivo. A Representative images of subcutaneous tumor xenografts in Control, SOAT1, shSOAT1, NK and SOAT1 + NK groups. B Tumor volume in different groups. C WB analysis of SOAT1, SREBP2, LDLR, E-cadherin, Occludin, Vimentin, Twist1, N-cadherin, Snail1, Slug, and Fibronectin expression levels in tumor tissue of different groups. D Visible metastatic nodules on the surface of lungs in different groups.
Index in PubMed under a CC BY license. PMID: 38724499

Click image to see more details
Nootkatone suppresses tumorigenesis and development of NAFLD-HCC mice. A Schematic illustration of experimental procedure. B Representative macroscopic images of liver in Control, Model, NK-L, and NK-H groups. C AFP expression in serum and liver tissue of mice in different groups. D Body weight of mice in different groups. E , F Liver weight ( E ) and liver weight-to-body weight ratio ( F ). G Serum TC level in four groups. H Contents of hepatic free cholesterol and cholesterol esters in four different groups. I Serum ALT and AST level in different groups. J Morphological observations of the liver and liver tissue with Oil red O, H&E and Sirius red staining. The relative Oil red O and Sirius red were obtained through the Image J Pro software. K The protein expression level of SOAT1, SREBP2, LDLR, E-cadherin, Occludin, Vimentin, Twist1, N-cadherin, Snail1, Slug, and Fibronectin expression in liver tissue of mice in different groups.
Index in PubMed under a CC BY license. PMID: 38724499

Click image to see more details
IHC analysis of SOAT1 using anti-SOAT1 antibody (A05096-1).
SOAT1 was detected in a paraffin-embedded section of human breast cancer tissue. Heat mediated antigen retrieval was performed in EDTA buffer (pH 8.0, epitope retrieval solution). The tissue section was blocked with 10% goat serum. The tissue section was then incubated with 2 μg/ml rabbit anti-SOAT1 Antibody (A05096-1) overnight at 4°C. Peroxidase Conjugated Goat Anti-rabbit IgG was used as secondary antibody and incubated for 30 minutes at 37°C. The tissue section was developed using HRP Conjugated Rabbit IgG Super Vision Assay Kit (Catalog # SV0002) with DAB as the chromogen.

Click image to see more details
IHC analysis of SOAT1 using anti-SOAT1 antibody (A05096-1).
SOAT1 was detected in a paraffin-embedded section of human prostatic cancer tissue. Heat mediated antigen retrieval was performed in EDTA buffer (pH 8.0, epitope retrieval solution). The tissue section was blocked with 10% goat serum. The tissue section was then incubated with 2 μg/ml rabbit anti-SOAT1 Antibody (A05096-1) overnight at 4°C. Peroxidase Conjugated Goat Anti-rabbit IgG was used as secondary antibody and incubated for 30 minutes at 37°C. The tissue section was developed using HRP Conjugated Rabbit IgG Super Vision Assay Kit (Catalog # SV0002) with DAB as the chromogen.

Click image to see more details
IHC analysis of SOAT1 using anti-SOAT1 antibody (A05096-1).
SOAT1 was detected in a paraffin-embedded section of rat testis tissue. Heat mediated antigen retrieval was performed in EDTA buffer (pH 8.0, epitope retrieval solution). The tissue section was blocked with 10% goat serum. The tissue section was then incubated with 2 μg/ml rabbit anti-SOAT1 Antibody (A05096-1) overnight at 4°C. Peroxidase Conjugated Goat Anti-rabbit IgG was used as secondary antibody and incubated for 30 minutes at 37°C. The tissue section was developed using HRP Conjugated Rabbit IgG Super Vision Assay Kit (Catalog # SV0002) with DAB as the chromogen.

Click image to see more details
IF analysis of SOAT1 using anti-SOAT1 antibody (A05096-1).
SOAT1 was detected in an immunocytochemical section of PC-3 cells. Enzyme antigen retrieval was performed using IHC enzyme antigen retrieval reagent (AR0022) for 15 mins. The cells were blocked with 10% goat serum. And then incubated with 5 μg/mL rabbit anti-SOAT1 Antibody (A05096-1) overnight at 4°C. Cy3 Conjugated Goat Anti-Rabbit IgG (BA1032) was used as secondary antibody at 1:500 dilution and incubated for 30 minutes at 37°C. The section was counterstained with DAPI. Visualize using a fluorescence microscope and filter sets appropriate for the label used.

Click image to see more details
Flow Cytometry analysis of Caco-2 cells using anti-SOAT1 antibody (A05096-1).
Overlay histogram showing Caco-2 cells stained with A05096-1 (Blue line). To facilitate intracellular staining, cells were fixed with 4% paraformaldehyde and permeabilized with permeabilization buffer. The cells were blocked with 10% normal goat serum. And then incubated with rabbit anti-SOAT1 Antibody (A05096-1, 1 μg/1x106 cells) for 30 min at 20°C. DyLight®488 conjugated goat anti-rabbit IgG (BA1127, 5-10 μg/1x106 cells) was used as secondary antibody for 30 minutes at 20°C. Isotype control antibody (Green line) was rabbit IgG (1 μg/1x106) used under the same conditions. Unlabelled sample (Red line) was also used as a control.

Click image to see more details
Flow Cytometry analysis of THP-1 cells using anti-SOAT1 antibody (A05096-1).
Overlay histogram showing THP-1 cells stained with A05096-1 (Blue line). To facilitate intracellular staining, cells were fixed with 4% paraformaldehyde and permeabilized with permeabilization buffer. The cells were blocked with 10% normal goat serum. And then incubated with rabbit anti-SOAT1 Antibody (A05096-1, 1 μg/1x106 cells) for 30 min at 20°C. DyLight®488 conjugated goat anti-rabbit IgG (BA1127, 5-10 μg/1x106 cells) was used as secondary antibody for 30 minutes at 20°C. Isotype control antibody (Green line) was rabbit IgG (1 μg/1x106) used under the same conditions. Unlabelled sample (Red line) was also used as a control.
Specific Publications For Anti-SOAT1 Antibody Picoband® (A05096-1)
Loading publications
Recommended Resources
Here are featured tools and databases that you might find useful.
- Boster's Pathways Library
- Protein Databases
- Bioscience Research Protocol Resources
- Data Processing & Analysis Software
- Photo Editing Software
- Scientific Literature Resources
- Research Paper Management Tools
- Molecular Biology Software
- Primer Design Tools
- Bioinformatics Tools
- Phylogenetic Tree Analysis
Customer Reviews
Have you used Anti-SOAT1 Antibody Picoband®?
Share your experimental results or join a short interview to earn up to $1,000 in product credits or other rewards.
0 Reviews For Anti-SOAT1 Antibody Picoband®
Customer Q&As
Have a question?
Find answers in Q&As, reviews.
Can't find your answer?
Submit your question
