Click image to see more details
-

-
-
-
-
+12
Product Info Summary
| SKU: | A02632-2 |
|---|---|
| Size: | 100 μg/vial |
| Reactive Species: | Mouse, Rat |
| Host: | Rabbit |
| Application: | IHC, WB, ELISA (Cap) |
Customers Who Bought This Also Bought

Product info
Product Name
Anti-VE-Cadherin Cdh5-Antibody Picoband®
SKU/Catalog Number
A02632-2
Size
100 μg/vial
Form
Lyophilized
Description
Boster Bio Anti-VE-Cadherin Cdh5-Antibody Picoband® catalog # A02632-2. Tested in ELISA, IHC, WB applications. This antibody reacts with Mouse, Rat. The brand Picoband indicates this is a premium antibody that guarantees superior quality, high affinity, and strong signals with minimal background in Western blot applications. Only our best-performing antibodies are designated as Picoband, ensuring unmatched performance.
Storage & Handling
Store at -20˚C for one year from date of receipt. After reconstitution, at 4˚C for one month. It can also be aliquotted and stored frozen at -20˚C for six months. Avoid repeated freeze-thaw cycles.
Cite This Product
Anti-VE-Cadherin Cdh5-Antibody Picoband® (Boster Biological Technology, Pleasanton CA, USA, Catalog # A02632-2)
Host
Rabbit
Contents
Each vial contains 4 mg Trehalose, 0.9 mg NaCl and 0.2 mg Na2HPO4.
Clonality
Polyclonal
Isotype
Rabbit IgG
Immunogen
E. coli-derived mouse VE Cadherin recombinant protein (Position: D46-E285).
Cross-reactivity
No cross-reactivity with other proteins.
Reactive Species
A02632-2 is reactive to Cdh5 in Mouse, Rat
Observed Molecular Weight
120 kDa
Calculated molecular weight
87.9 kDa
Background of Cdh5
CDH5 (Cadherin 5), also known as VE-cadherin, is a type of cadherin. It is encoded by the human gene CDH5. This gene is mapped to 16q22.1 using somatic cell hybrid panels. Functioning as a classic cadherin by imparting to cells the ability to adhere in a homophilic manner, the protein may play an important role in endothelial cell biology through control of the cohesion and organization of the intercellular junctions. Therefore it was concluded that VE-cadherin serves the purpose of maintaining newly formed vessels.
Antibody Validation
Boster validates all antibodies on WB, IHC, ICC, Immunofluorescence, and ELISA with known positive control and negative samples to ensure specificity and high affinity, including thorough antibody incubations.
Application & Images
Applications
A02632-2 is guaranteed for IHC, WB, ELISA (Cap) Boster Guarantee
Recommend Dilution
| Application | Dilution | Species |
|---|---|---|
| Western blot | 0.1-0.5μg/ml | |
| Immunohistochemistry (Paraffin-embedded Section) | 0.5-1μg/ml | |
| ELISA (Cap) | 1-5μg/ml |
Tested application
Suggested blocking solution with 5% non-fat milk or BSA; (*)Recommended protein loading: 20-40 µg per lane
Use TE buffer pH 9.0 for antigen retrieval; (*) citrate buffer pH 6.0 is an alternative.
Validation Images & Assay Conditions
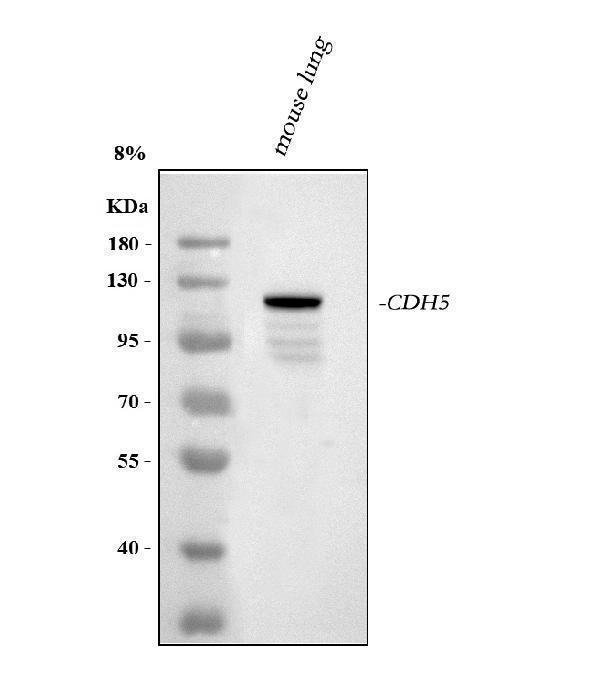
Click image to see more details
Western blot analysis of VE Cadherin using anti-VE Cadherin antibody (A02632-2).
Electrophoresis was performed on a 5-20% SDS-PAGE gel at 70V (Stacking gel) / 90V (Resolving gel) for 2-3 hours. The sample well of each lane was loaded with 30 ug of sample under reducing conditions.
Lane 1: mouse lung tissue lysates.
After electrophoresis, proteins were transferred to a nitrocellulose membrane at 150 mA for 50-90 minutes. Blocked the membrane with 5% non-fat milk/TBS for 1.5 hour at RT. The membrane was incubated with rabbit anti-VE Cadherin antigen affinity purified polyclonal antibody (Catalog # A02632-2) at 0.5 μg/mL overnight at 4°C, then washed with TBS-0.1%Tween 3 times with 5 minutes each and probed with a goat anti-rabbit IgG-HRP secondary antibody at a dilution of 1:5000 for 1.5 hour at RT. The signal is developed using an Enhanced Chemiluminescent detection (ECL) kit (Catalog # EK1002) with Tanon 5200 system. A specific band was detected for VE Cadherin at approximately 120 kDa. The expected band size for VE Cadherin is at 88 kDa.

Click image to see more details
IHC analysis of VE Cadherin using anti-VE Cadherin antibody (A02632-2).
VE Cadherin was detected in a paraffin-embedded section of mouse lung tissue. Heat mediated antigen retrieval was performed in EDTA buffer (pH 8.0, epitope retrieval solution). The tissue section was blocked with 10% goat serum. The tissue section was then incubated with 2 μg/ml rabbit anti-VE Cadherin Antibody (A02632-2) overnight at 4°C. Peroxidase Conjugated Goat Anti-rabbit IgG was used as secondary antibody and incubated for 30 minutes at 37°C. The tissue section was developed using HRP Conjugated Rabbit IgG Super Vision Assay Kit (Catalog # SV0002) with DAB as the chromogen.

Click image to see more details
IHC analysis of VE Cadherin using anti-VE Cadherin antibody (A02632-2).
VE Cadherin was detected in a paraffin-embedded section of rat lung tissue. Heat mediated antigen retrieval was performed in EDTA buffer (pH 8.0, epitope retrieval solution). The tissue section was blocked with 10% goat serum. The tissue section was then incubated with 2 μg/ml rabbit anti-VE Cadherin Antibody (A02632-2) overnight at 4°C. Peroxidase Conjugated Goat Anti-rabbit IgG was used as secondary antibody and incubated for 30 minutes at 37°C. The tissue section was developed using HRP Conjugated Rabbit IgG Super Vision Assay Kit (Catalog # SV0002) with DAB as the chromogen.

Click image to see more details
Sal B promotes angiogenesis in ischemic random skin flaps. Rats were killed and the samples in middle part of flap area II were harvested for analysis on post-operative day 7. (A,C) IHC of VEGF and cadherin 5 expression of skin flaps in the Control and Sal B group (original magnification: 200×; scale bar: 50 μm). (B , D) Histograms of optical density values of VEGF and cadherin 5 by IHC, respectively. (E – G) Western blotting of MMP9, VEGF, and cadherin 5 levels of skin flaps in the Control and Sal B group, corrected by GAPDH as internal control. The gels have been run under the same experimental conditions. The original images are available in Supplementary Figure . (H – J) Histograms of optical density values of MMP9, VEGF, and cadherin 5 in the two groups as determined by Western blotting. ∗ p < 0.05 and ∗∗ p < 0.01 vs. the control group. Data are means ± SEM ( n = 6 per group).
Index in PubMed under a CC BY license. PMID: 30405410

Click image to see more details
Inhibition of autophagy reverses the effects of Sal B in random skin flaps. Rats were killed and the samples in middle part of flap area II were harvested for analysis on post-operative day 7. (A) Autophagy level in skin flaps were estimated by immunofluorescence staining of LC3II:Autophagosomes (green) in the dermis in area II in each group; nuclei counterstained with DAPI (blue) (scale bar: 15 μm). (B) Histogram of frequency of LC3II-positive cells in the dermis. (C) Western blotting of Beclin1, VPS34, CTSD, LC3II, and p62 levels, as well as those of MMP9, VEGF, and cadherin 5, corrected by GAPDH as internal control. The gels have been run under the same experimental conditions. The original images are available in Supplementary Figures . (D) Histograms of optical density values of autophagy- (Beclin1, VPS34, CTSD, LC3II, and p62) and angiogenesis- (MMP9, VEGF, and cadherin 5) related proteins, assessed by Western blotting. (E) Western blotting of Bax, CYC, and caspase 3 levels, as well as those of SOD1, eNOS, and HO1, corrected by GAPDH as internal control. The original images are available in Supplementary Figures . (F) Histograms of optical density values of apoptosis- (Bax, CYC, and caspase 3) and oxidative stress-related proteins (Bax, CYC, and caspase 3) as determined by Western blotting. (G) Total SOD activity by xanthine oxidase method. (H) GSH level by modified 5,5′-dithiobis [2-nitrobenzoic acid] method. (I) MDA level by modified thiobarbituric acid test. ∗ p < 0.05 and ∗∗ p < 0.01 vs. the control group. Data are means ± SEM ( n = 6 per group); NS, not significant.
Index in PubMed under a CC BY license. PMID: 30405410

Click image to see more details
PF11 enhances angiogenesis in random skin flaps. (A) Immunofluorescence staining for α-SMA labeled microvessels (scale bar: 20 µm). (B) Histogram showing the percentages of a-SMA positive microvessels in the control and PF11 groups. (C) IHC results showing the Cadherin 5 expression in random skin flaps (scan bar, 50 μm). (D) A histogram exhibiting the integral absorbance of Cadherin 5. (E) Results of western blotting showing the expression of MMP9, VEGF, Cadherin 5, and GAPDH. Cropped blots are shown. (F) Histogram showing optical density values of MMP9, VEGF, and Cadherin5 in the control and PF11 group in the flaps. Values are expressed as means ± SD, n = 6 per Group. * p < 0.05 and ** p < 0.01, vs. control group.
Index in PubMed under a CC BY license. PMID: 33995096

Click image to see more details
Sandwich ELISA - Recombinant mouse VE Cadherin/Cdh5 protein standard curve.
Use in combination with reagents from Mouse VE Cadherin/Cdh5 ELISA Kit EZ-Set (DIY Antibody Pairs) (EZ1318).

Click image to see more details
Inhibition of autophagy reverses the effects of MET on angiogenesis, apoptosis and oxidative stress. (A) Autophagosomes (red) in cells in Area II of flaps in the MET and MET+3MA groups by Immunofluorescence staining for LC3II (scale bar, 25μm). (B&D) The expressions of autophagy-related protein VPS34, p62, LC3II, Beclin1, and CTSD; angiogenesis-related protein VEGF, Cadherin 5, and MMP9; oxidative stress-related protein SOD1, HO1, and eNOS and apoptosis-related protein Bax, CYC, and CASP3 in each group, were assessed by Western blotting. The gels have been run under the same experimental conditions, and cropped blots are used here. (C&E) Optical density values of VPS34, p62, LC3II, Beclin1, CTSD, VEGF, Cadherin 5, MMP9, SOD1, HO1, eNOS, Bax, CYC, and CASP3 expressions in the two groups. Values are expressed as means± SEM, n = 6 per group. # p < 0.05 and ## p < 0.01, vs. MET group.
Index in PubMed under a CC BY license. PMID: 30745824

Click image to see more details
Effect of Sit-induced autophagy on angiogenesis in the perforator flap. (A) Microvessels (red) in SCZ of flaps in the control, Sit, and Sit+3MA groups were estimated by immunofluorescence staining for α-SMA in the dermal layer (scale bar: 20 µm). (B) Histograms representing percentages of α-SMA labeled microvessels in each group. (C) H&E staining exhibiting subcutaneous histology of the flap, showing microvessels in SCZ in the control, Sit, and Sit+3MA groups (original magnification ×200; scan bar, 50 μm). (D) Histogram indicating percentage of mean vessel density in each group. (E) IHC for CD34 positive vessels in the control, Sit, and Sit+3MA groups (original magnification ×200; scale bar, 50 µm). (F) Histogram of the percentage of CD34-positive vessel density in each group. (G, I) IHC for VEGF and Cadherin 5 expression in the flap in the control, Sit, and Sit+3MA groups (original magnification ×200; scale bar, 50 µm). (H, J) The optical density values of VEGF and Cadherin 5 in each group. (K) The expressions of MMP9, VEGF, and Cadherin 5 detected by western blotting in the control, Sit, and Sit+3MA groups. All gels have been run under the same experimental conditions and cropped blots are used here. (L) Histogram of the optical density values of MMP9, VEGF, and Cadherin 5 in each group. *p < 0.05 and **p < 0.01, vs control group; @ p < 0.05 and @@ p < 0.01, vs Sit group. Data are presented as mean ± standard error, n = 6 per group.
Index in PubMed under a CC BY license. PMID: 32670067

Click image to see more details
NBP improves angiogenesis in multiterritory perforator flap. (A) and (B) IHC of VEGF and CDH5 in the ischemic flap of the control and NBP-treated rats. (C) and (D) Optical density values of VEGF and CDH5. (E) Western blotting of MMP9, VEGF, and CDH5 in control and NBP-treated groups. (F) Optical density values of MMP9, VEGF, and CDH5 from western blot. Gels were run under similar experimental conditions and cropped edited only for clarity. Values are shown as mean ± SEM, n = 6 per group. * p < 0.05 and ** p < 0.01 vs. control group.
Index in PubMed under a CC BY license. PMID: 33584290

Click image to see more details
Rapamycin reverses effects of NBP on angiogenesis, oxidative stress, and apoptosis in multiterritory perforator flap. (A) Autophagosomes (LC3, red) in cells in the control, NBP, NBP + rapamycin, and rapamycin groups. Nuclei are counterstained with DAPI (blue) (scale bar, 20 μm). (B) Digital images of the control, NBP, NBP + rapamycin, and rapamycin groups on POD 7. (C) LDBF in each group on POD 7. (D) Percentage of survival area on POD 7. (E) Percentage of the signal intensity of blood flow within the flap in each group. (F) LC3 positive cells in each group. (G) Autophagy-related protein expression (LC3, CTSD, Beclin1, and SQSTM1/p62) and angiogenesis-related proteins (VEGF, MMP9, and CDH5). (H) Optical density of LC3, CTSD, Beclin1, SQSTM1/p62, VEGF, MMP9, and CDH5 in each group. (L) Apoptosis-related protein expression (CYC, Bax, and CASP3) and oxidative stress-related protein expression (SOD1, HO1, and eNOS) in each group. (M) Optical density of CYC, Bax, CASP3, SOD1, HO1, and eNOS expressions in each group. Gels were run under similar experimental conditions and edited only for clarity. Values are shown as mean ± SEM, n = 6 per group. * p < 0.05 and ** p < 0.01 vs. control group; # p < 0.05 and ## p < 0.01 vs. NBP group.
Index in PubMed under a CC BY license. PMID: 33584290

Click image to see more details
TFE3 ameliorates ROS-induced lysosomal malfunction and downregulates pyroptosis in random skin flaps. (A,E) Immunofluorescence exhibiting the nuclear translocation of TFE3 (red) (scale bar: 25 mm). (B,F) Percentage of TFE3-positive cells. (C,G) Western blot exhibited cytoplasmic TFE3 and nuclear TFE3. (D,H) Quantification of cytoplasmic and nuclear TFE3 proteins immunoblots. (I) ELISA of 8-OHdG, AOPP, and MDA in flap tissue from WT, TFE3 KI, TFE3 KI + scramble and TFE3 KI + TFE3 shRNA groups. (J,N) Western blotting of the lysosome function-related proteins CTSD, LAMP2, CTSB, and CTSL in total protein and cytoplasmic protein. (K,O) Densitometric analysis of CTSD, LAMP2, CTSB, and CTSL. (L) Immunofluorescence for LAMP2 in skin flaps (scale bar: 25 mm). (M) The fluorescence intensity for LAMP2. (N) Western blotting of VEGF, cadheirn-5, SOD1, and HO-1 in flap tissue from WT, TFE3 KI, and TFE3 KI + scramble and TFE3 KI + TFE3 shRNA groups. (O) Densitometric analysis of VEGF, cadherin-5, SOD1, and HO-1. (P) Western blotting of the pyroptosis related proteins. (Q) Quantification of pyroptosis related proteins immunoblots. Values are shown as the mean ± SEM, n = 6 per group. * p < 0.05 and ** p < 0.01, vs. WT group or area I group. # p < 0.05 and ## p < 0.01, vs. TFE3 KI + TFE3 shRNA group.
Index in PubMed under a CC BY license. PMID: 33898433

Click image to see more details
NLRP3-mediated pyroptosis triggers the necrosis of flaps. (A) Immunofluorescence to evaluate the caspase-1 level was conducted to exhibit the pyroptosis level in the skin flaps (scale bar: 25 mm). (B) The fluorescence intensity of caspase-1 analyzed using ImageJ. (C) Image of the immunofluorescence staining of GSDMD-N in skin flaps (scale bar: 25 mm). (D) The fluorescence intensity for GSDMD-N. (E) Western blotting of pyroptosis related proteins in flap tissue from the control and MCC950 groups. (F) Quantification of pyroptosis related proteins immunoblots. (G) Digital images of flap necrosis from the control and MCC950 groups (scale bar, 1.0 cm). (H) Histogram showing the percentage of viable flap area. (I) Digital images of the inner side of the random flap in each group exhibiting tissue edema (scale bar, 1.0 cm). (J) Quantification of the flap tissue water content. (K) Full field LDBF images of flaps by LDBF (scale bar, 1.0 cm). (L) Quantification of signal intensity of blood flow. (M) Morphologic observation of flap tissue by H&E staining (original magnification, ×200; scale bar, 50 μm). (N) H&E staining to show vessels. (O) The expression of CD34 to mark vessels was evaluated by immunohistochemistry staining (original magnification, ×200; scale bar, 50 μm). (P) Histogram showing the CD34-positive vessel densities (Q) Immunohistochemistry for VEGF on the skin flaps from the control and the MCC950 groups (original magnification, ×200; scale bar, 50 μm). (R) Histograms of optical density values for VEGF in IHC. (S) Western blotting of VEGF and cadherin-5 in flap tissue from the control and MCC950 groups. (T) Quantification of VEGF and cadherin-5 immunoblots. Values represent the mean ± SEM, n = 6 per group. * p < 0.05 and ** p < 0.01, vs. control group.
Index in PubMed under a CC BY license. PMID: 33898433

Click image to see more details
Inhibition of autophagy abolished the positive effects of PF11 on angiogenesis, apoptosis, oxidative stress in skin flaps. (A,B) Immunofluorescence staining showed the α-SMA positive microvessels in the control, PF11, and PF11 + 3MA groups (scale bar: 20 µm). (C,D) Western blotting results exhibited the expression of angiogenesis-related protein MMP9, VEGF, and Cadherin 5. (E,F) Western blotting results exhibited the expression of oxidative stress-related protein SOD1, HO1, and eNOS in the control, PF11, and PF11 + 3MA groups. (G,H) Western blotting results exhibited the expression of apoptosis-related protein Bax, Bcl-2, and C-caspase3. Values are expressed as means ± SD, n = 6 per group. * p < 0.05 and ** p < 0.01, vs. PF11 group. # p < 0.05 and ## p < 0.01, vs. control group. # p < 0.05 and ## p < 0.01, vs. control group.
Index in PubMed under a CC BY license. PMID: 33995096

Click image to see more details
( a , b ) Effect of exercise on alcohol induced vascular permeability and BBB dysfunction. Representative western blot analysis showing the levels of tight junction (TJ) proteins (ZO-1 and Claudin-5) in the different mice groups ( a ). Histogram showing the quantitative estimation of ZO-1 and Claudin-5 proteins after normalization with GAPDH (b). ( c,d ) Representative images showing fluorescent protein (FITC-BSA) leakage from pial vessels into brain parenchyma – indicating alteration in microvascular permeability in the different groups of mice ( c ). Scatter dot plot showing quantitative estimation of fluorescent intensity units (FIU) in the different mice groups after FITC-BSA injection ( d ). ( e , f ) Representative images of cerebral angiogram with barium sulfate contrast in experimental mice groups ( e ). Scatter dot plot showing the pattern of vascular density in the form of percentage of vascular area in the different mice groups ( f ). ( g , h ) Representative images for the in vitro model showing microvascular permeability in brain endothelial cells (bEnd.3 cells) by FITC-BSA diffusion assay. Fluorescence intensity of bovine serum albumin conjugated with FITC (BSA-488) in lower chambers of Transwells was measured by fluorimetry and presented as FIU ( g ). Histogram showing quantitative estimation of FIU in different experimental conditions after FITC-BSA treatment in Transwell chambers ( h ). ( i , j ) Representative western blot analysis showing the levels of junctional proteins (VE-Cadherin, Claudin-5 and ZO-2) in different experimental conditions of mouse brain endothelial cells (i). Histograms showing the quantitative estimation of ZO-2, Claudin-5 and VE-Cadherin proteins after normalization with GAPDH (j). All the data are represented as mean values ± standard error (SE) in 5 independent experiments. * ,# p < 0.05 considered significant.*p < 0.05 vs. CT and # p < 0.05 vs. AL group. Uncropped blots for Fig. are presented in Supplementary Fig. and .
Index in PubMed under a CC BY license. PMID: 29581524

Click image to see more details
MET promotes angiogenesis in random skin flaps. (A&C) IHC for VEGF and Cadherin 5 expressions in the ischemic flaps of the Control and MET groups (original magnification × 200; scale bar, 50μm). (B&D) The optical density values of VEGF and Cadherin 5 were quantified and analyzed in each group. (E-G) Western blotting for VEGF, MMP9, and Cadherin 5 expressions in the ischemic flaps of the Control and MET groups. The gels have been run under the same experimental conditions, and cropped blots are used here. (H-J) Optical density values of VEGF, MMP9, and Cadherin 5 were quantified and analyzed in each group. Values are shown as means± SEM, n = 6 per group. * p < 0.05 and ** p < 0.01, vs. Control group.
Index in PubMed under a CC BY license. PMID: 30745824
Specific Publications For Anti-VE-Cadherin Cdh5-Antibody Picoband® (A02632-2)
Loading publications
Recommended Resources
Here are featured tools and databases that you might find useful.
- Boster's Pathways Library
- Protein Databases
- Bioscience Research Protocol Resources
- Data Processing & Analysis Software
- Photo Editing Software
- Scientific Literature Resources
- Research Paper Management Tools
- Molecular Biology Software
- Primer Design Tools
- Bioinformatics Tools
- Phylogenetic Tree Analysis
Customer Reviews
Have you used Anti-VE-Cadherin Cdh5-Antibody Picoband®?
Share your experimental results or join a short interview to earn up to $1,000 in product credits or other rewards.
0 Reviews For Anti-VE-Cadherin Cdh5-Antibody Picoband®
Customer Q&As
Have a question?
Find answers in Q&As, reviews.
Can't find your answer?
Submit your question
