Click image to see more details
-

-
-
-
-
+7
Product Info Summary
| SKU: | M00121-2 |
|---|---|
| Size: | 100 µl |
| Reactive Species: | Human, Mouse, Rat |
| Host: | Mouse |
| Application: | IF, IHC, WB |
Customers Who Bought This Also Bought

Product info
Product Name
Anti-FGF2 Mouse Monoclonal Antibody [Clone ID: OTI3D9]
SKU/Catalog Number
M00121-2
Size
100 µl
Description
Boster Bio bFGF (FGF2) mouse monoclonal antibody, clone OTI3D9 (formerly 3D9). Catalog# M00121-2. Tested in IF, IHC, WB. This antibody reacts with Human, Mouse, Rat.
Storage & Handling
Store at -20°C as received.
Cite This Product
Anti-FGF2 Mouse Monoclonal Antibody [Clone ID: OTI3D9] (Boster Biological Technology, Pleasanton CA, USA, Catalog # M00121-2)
Host
Mouse
Contents
PBS (pH 7.3) containing 1% stabilizing protein, 50% glycerol and 0.02% sodium azide.
This antibody is supplied in a stabilized formulation.
Compatibility with conjugation reactions depends on the chemistry of the conjugation method used.
For conjugation methods that are not compatible with the stabilizing components present in this formulation, a carrier-free antibody format is required.
Clonality
Monoclonal
Clone Number
OTI3D9
Isotype
IgG2b
Immunogen
Human recombinant protein fragment corresponding to amino acids 10-155 of human bFGF (NP_001997) produced in E.coli.
Reactive Species
M00121-2 is reactive to FGF2 in Human, Mouse, Rat
Calculated molecular weight
30.8 kDa
Antibody Validation
Boster validates all antibodies on WB, IHC, ICC, Immunofluorescence, and ELISA with known positive control and negative samples to ensure specificity and high affinity, including thorough antibody incubations.
Application & Images
Applications
M00121-2 is guaranteed for IF, IHC, WB Boster Guarantee
Recommend Dilution
WB: 1:1000
IHC: 1:50
IF: 1:100
Validation Images & Assay Conditions
Click image to see more details
HEK293T cells were transfected with the pCMV6-ENTRY control (Left lane) or pCMV6-ENTRY BFGF (Right lane) cDNA for 48 hrs and lysed. Equivalent amounts of cell lysates (5 ug per lane) were separated by SDS-PAGE and immunoblotted with anti-BFGF.

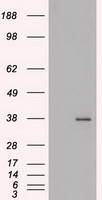
Click image to see more details
Western blot analysis of extracts (10ug) from 4 different cell lines by using anti-BFGF monoclonal antibody at 1:200 dilution.

Click image to see more details
Immunohistochemical staining of paraffin-embedded Human pancreas tissue within the normal limits using anti-BFGF mouse monoclonal antibody. (Heat-induced epitope retrieval by 10mM citric buffer

Click image to see more details
Anti-BFGF mouse monoclonal antibody (M00121-2) immunofluorescent staining of COS7 cells transiently transfected by pCMV6-ENTRY BFGF.

Click image to see more details
Flow chart of the experimental design and verification of FGF2 deletion. a Diagram of experimental design. Bone marrow precursor cells were collected from the tibia and femur of WT and FGF2 KO mice aged 8–12 weeks. They were differentiated into BMDM for 7 days using 100ng/ml M-CSF. Macrophages in C57BL/6 male mice were depleted using clodronate liposomes. BMDM from WT and KO mice were injected via the tail vein into mice to reconstitute macrophages after 2 days. Mice were treated with Sham or CLP, and the samples were analyzed 24 h later. b Serum FGF2 protein levels were assessed by ELISA ( n = 3–5). c FGF2 gene expression levels were measured in the lungs, spleen, and liver using real-time PCR ( n = 3). d Western blot analysis of FGF2 protein levels in lung tissue extractions ( n = 3). e Immunofluorescence staining of FGF2 in BMDM from WT and FGF2 KO mice ( n = 3). f The levels of FGF2 gene expression were quantified in the lung tissue of mice subjected to elimination-reconstruction procedures. Bar is 50 μm. * p < 0.05 vs. WT or vs. Clo + WT
Index in PubMed under a CC BY license. PMID: 39436561

Click image to see more details
Effect of FGF2 deficiency on BMDM apoptosis and polarization. a – c FGF2 deletion increased BMDM apoptosis. a Apoptosis in BMDM deprived of FBS for 24 h was assessed by flow cytometry ( n = 4). b - c Percentage of PI + Annexin V + and PI- Annexin V + BMDM after starvation. d - k FGF2 deletion in BMDM promoted M1 polarization. d - g Flow cytometric analysis of macrophage markers in BMDM treated with LPS or IL4, including CD86, iNOS, CD206, and Arg1 ( n = 3). h - k The levels of CD86, iNOS, CD206 and Arg1 in BMDM after treatment with LPS or IL4. N represents no treatment; * p < 0.05, vs. WT; Ψ p < 0.05, vs. N + WT; Ω p < 0.05, vs. N + FGF2 KO
Index in PubMed under a CC BY license. PMID: 39436561

Click image to see more details
Deficiency of FGF2 in BMDM resulted in the upregulation of M1 markers and proinflammatory cytokine expression and increased nuclear translocation of NF-KB p65. a - j BMDM were treated with LPS or IL4, and real-time PCR was used to determine the expression of M1 and M2 markers and cytokines ( n = 3). k , l P65 nuclear translocation was detected and quantitatively analyzed by immunofluorescence ( n = 3). m The expression of MMP9 in WT and FGF2 KO BMDM treated with LPS or IL4 were determined with real-time PCR. Bar in the first three rows is 50 μm, while bar in the fourth rows is 20 μm, * p < 0.05 vs. WT; Ψ p < 0.05 vs. N + WT; Ω p < 0.05 vs. N + KO
Index in PubMed under a CC BY license. PMID: 39436561

Click image to see more details
Transcriptome sequencing was used to analyze BMDM from WT and FGF2 KO mice treated with or without LPS. a Heat map of DEGs in BMDM from WT and FGF2 KO mice stimulated with or without LPS (Average TPM each group, n = 3). b KEGG enrichment analysis identified the top 20 altered signaling pathways in the four groups (WT, FGF2 KO, WT + LPS, and FGF2 KO + LPS). c Construction of a regulatory network to modulate PPI involving FGF2 and LPS using DEGs. d KEGG pathway network based on similarity in gene expression profiles. e Volcano plot showing DEGs of WT + LPS and FGF2 KO + LPS. f Heat map of DEGs in BMDM of WT + LPS and FGF2 KO + LPS. g Top 20 KEGG pathways for DEGs in BMDM from WT + LPS and FGF2 KO + LPS. h KEGG pathway annotation of differentially expressed genes between WT + LPS and FGF2 KO + LPS. i , j Differently regulated pathways in the GSEA. k Inflammation and cytokine gene heat map for WT + LPS and FGF2 KO + LPS. l , m TPM changes in the gene groups compared to WT weights. * p < 0.05 vs. WT; Δ p < 0.05 vs. WT + LPS; # p < 0.05 vs. FGF2 KO
Index in PubMed under a CC BY license. PMID: 39436561

Click image to see more details
FGF2 deletion in macrophages aggravates lung injury in CLP mice. a - c Clodronate liposomes were injected intravenously to deplete macrophages, followed by quantification of F4/80 + spleen cells using flow cytometry to measure macrophage clearance. * p < 0.05 vs. control. d - f Levels of the inflammatory cytokines IL1β, TNFα, and IL6 in bronchoalveolar lavage fluid (BALF) from the four groups were quantified via ELISA. The four groups were Clo + WT + Sham, Clo + WT + CLP, Clo + FGF2 KO + Sham, and Clo + FGF2 KO + CLP. g The lung wet-to-dry weight ratios were measured in the four groups. h - i The total cells and total protein in BALF were evaluated in the four groups. j The OD value of Evans blue in the lung tissues from the four groups. k - l HE staining of lung tissue from the four groups and their Smith score. (m-o) Blood gas analysis was performed using abdominal aortic blood from the four groups. Bar is 250 μm. * p < 0.05 vs. WT; Δ p < 0.05 vs. WT + LPS; # p < 0.05 vs. FGF2 KO
Index in PubMed under a CC BY license. PMID: 39436561

Click image to see more details
Mice reconstituted with FGF2 KO macrophages and subjected to CLP demonstrate increased M1 polarization in lung tissue. a - f The presence and levels of CD206, CD86, and F4/80 markers on macrophages within lung tissue were identified and quantitatively assessed using immunofluorescence staining. Bar is 20 μm. * p < 0.05, vs. WT; Δ p < 0.05 vs. WT + LPS; # p < 0.05 vs. FGF2 KO
Index in PubMed under a CC BY license. PMID: 39436561

Click image to see more details
Mice reconstituted with FGF2 KO macrophages and subjected to CLP exhibit increased proinflammatory gene expression and apoptosis. a - c The expression of the inflammatory factors CXCL1, IL1β, and IL6 in lung tissue was detected by real-time PCR ( n = 3 per group). d TUNEL staining was used to evaluate apoptosis in the lung tissue. e - f The apoptosis-associated genes BCL2 and Bax were identified by western blot analysis. Bar is 20 μm. * p < 0.05, vs. WT; Δ p < 0.05, vs. WT + LPS; # p < 0.05 vs. FGF2 KO
Index in PubMed under a CC BY license. PMID: 39436561
Specific Publications For Anti-FGF2 Mouse Monoclonal Antibody [Clone ID: OTI3D9] (M00121-2)
Loading publications
Recommended Resources
Here are featured tools and databases that you might find useful.
- Boster's Pathways Library
- Protein Databases
- Bioscience Research Protocol Resources
- Data Processing & Analysis Software
- Photo Editing Software
- Scientific Literature Resources
- Research Paper Management Tools
- Molecular Biology Software
- Primer Design Tools
- Bioinformatics Tools
- Phylogenetic Tree Analysis
Customer Reviews
Have you used Anti-FGF2 Mouse Monoclonal Antibody [Clone ID: OTI3D9]?
Share your experimental results or join a short interview to earn up to $1,000 in product credits or other rewards.
0 Reviews For Anti-FGF2 Mouse Monoclonal Antibody [Clone ID: OTI3D9]
Customer Q&As
Have a question?
Find answers in Q&As, reviews.
Can't find your answer?
Submit your question
